Those of us who believed that the Fed’s program of large-scale asset purchases had only a modest effect on long-term interest rates seem to have some explaining to do.
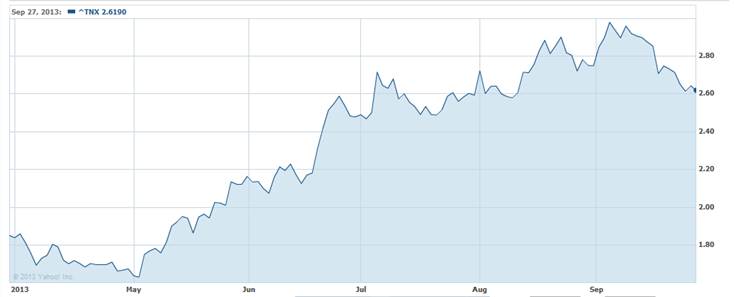 |
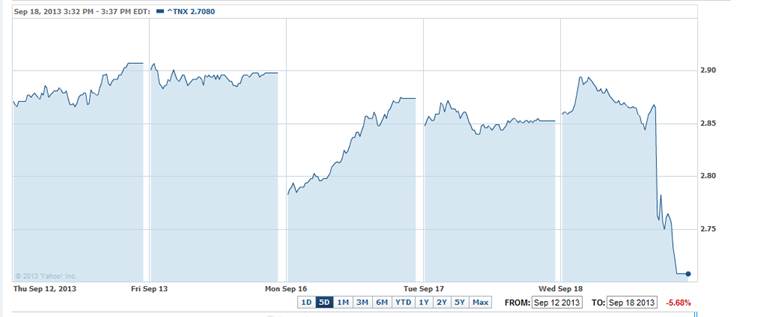
The yield on 10-year U.S. Treasury bonds has fallen 30 basis points over the last few weeks, and there seems little argument that changing views of what the Federal Reserve is planning to do have been the prime mover. There was a 10-basis point drop when markets opened on September 16 after Larry Summers’s withdrawal from consideration of Fed chair, as if this news alone had major implications for financial markets. That change was largely undone during the day. But release of the FOMC minutes that Wednesday, in which the Fed indicated that it was not yet ready to reduce the pace at which it is buying more Treasury and mortgage-backed securities, was clearly viewed as major news by financial markets and the principal factor in this month’s decline in long-term yields.
 |
The Fed’s ongoing program of large-scale asset purchases, popularly referred to as its third round of quantitative easing (or QE3), has resulted in the Fed adding $414 B to its holdings of Treasury securities between September 2012 and September 2013, or a realized pace of about $35 B each month in net additions to its portfolio after one takes into account redemptions of maturing securities. As of September 25, the Fed held $2,062 B in Treasury securities, which constitute about 17% of the $11,907 B in Treasury debt held by either the Fed or the public.
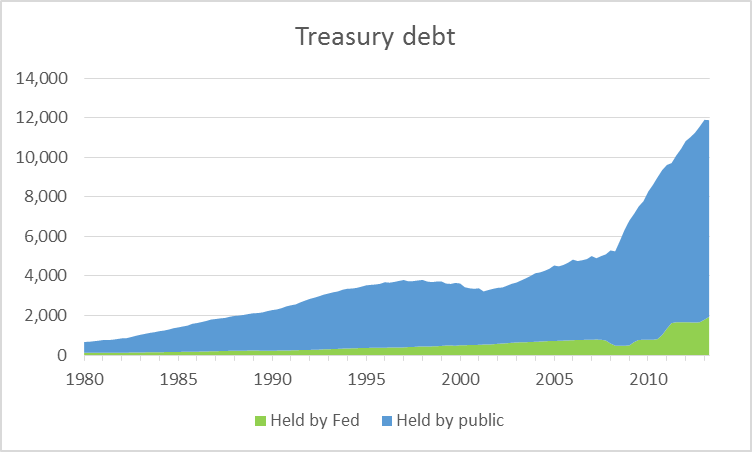 |
One theory maintains that by taking a large enough share of the outstanding long-term Treasury debt off of private-sector balance sheets the Fed can reduce the private sector’s exposure to long-term interest rate risk and thereby flatten the yield curve. But as one can see from the above graph, despite the Fed’s QE3 and the Treasury’s declining budget deficits, the volume of Treasury securities held by the non-Fed public has continued to grow impressively, increasing by $586 B over the last year. The Fed’s QE3 program may have kept interest rates from rising more than they otherwise would, but would not be an explanation by itself for a low level of interest rates overall.
No one expected the Fed to announce a complete cessation of its purchases at the September meeting, only a “taper”, or gradual slowdown in the pace of net purchases. Suppose for illustration that the Fed had announced at the last meeting that it was going to start reducing its net purchases of Treasury securities by $2.5 B per month beginning in October, so that it would be down to zero net purchases by November 2014 (in other words, back to maintaining a constant stock rather than allow its holdings to continue to grow further). Even though the Fed did not make such an announcement after its September meeting, there should be no doubt that a similar announcement is coming soon. Let’s say that in fact the Fed is not going to begin tapering until January, with net purchases not reaching zero until February 2015. The difference between the two paths I just described is that the Fed would end up holding about $100 B more in Treasury securities at the end of 2014 than if it had begun the tapering immediately. That’s a difference of less than 1% in the current stock of Treasury debt. This news is supposed to shave 30 basis points off the 10-year yield?
Some argue that it is not the Fed’s holdings as a share of the stock of outstanding debt that matters, but instead the share of the flow of newly issued debt that is purchased by the Fed. Of the $862 B in net bond sales from the Treasury to the public between June 2012 and June 2013, the Fed ended up with $277 B, or 32% of the new flow as opposed to 17% of the outstanding stock. A change in the flow of $2.5 B per month such as discussed above would represent 3.5% of last year’s flow pace of $862 B/year.
There are in any case substantial problems with the “flow” view of the importance of QE3. For one thing, it is hard to arrive at it from any economic model. Anyone who holds Treasury securities is free to sell them at any time they like, which is why the equilibrium price (or yield) must be such that the stock currently held is the quantity investors want to hold. That is a theory of the equilibrium interest rate that is based on stocks, not flows. Moreover, there’s been zero change so far in the flow, meaning the entire argument comes down to a story based on anticipation of future flows. And how can anticipation of future flows matter? It only matters insofar as it leads to a reassessment by investors about whether they want to be holding the existing stock given the current and anticipated future yield. In other words, the only way to get a story based on flows to work is ultimately to reframe it in the standard way, namely in terms of finding the yield at which investors are willing to hold the current stock.
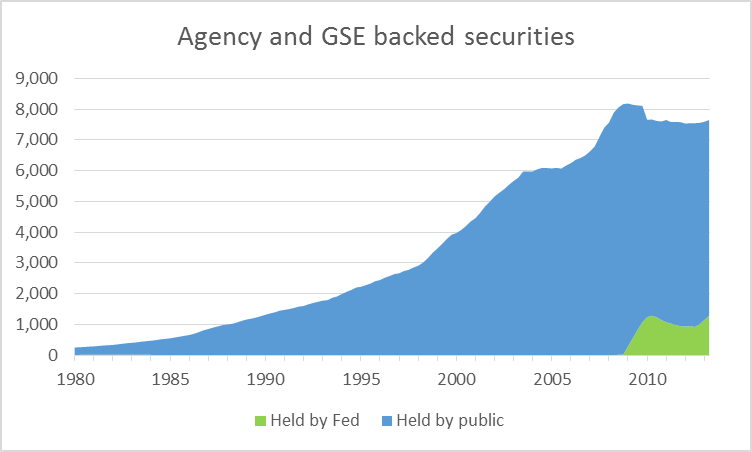
Another and perhaps more important component of QE3 has been purchases by the Fed of mortgage-backed securities. Here it is more difficult to calculate the fraction of the total stock of such securities the Fed is holding, because there is a range of assets with similar characteristics. What I have done in the graph below (partly because it seemed the simplest thing to do given the way the Fed’s Flow of Funds accounts are structured) is to look at the Fed’s MBS holdings relative to the total stock of agency- and GSE-backed securities. As of June, the Fed’s $1,277 B in MBS represented 17% of the total stock.
 |
And indeed one can make the case that Treasury securities and MBS are just part of a broader asset class, against which their yields get arbitraged globally, making claims that such large impacts on yields could be attributed to a modest change in the timing of the tapering even harder to understand.
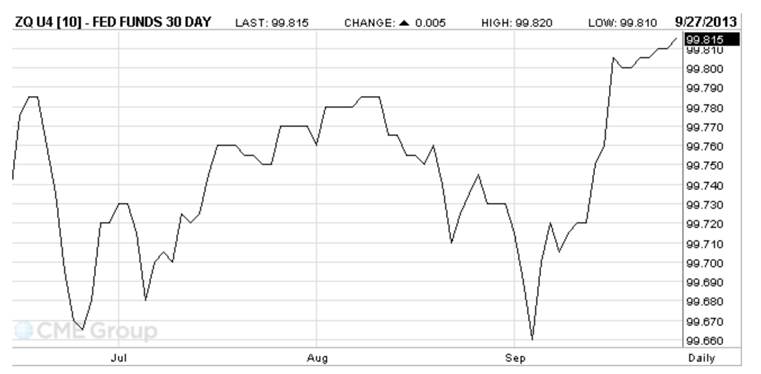
The indicated conclusion is that it is not the asset purchases themselves, but rather what they may signify about future Fed policy, that really matters for financial markets. It’s interesting to note that fed funds futures began to show some life again this spring, when discussion of Fed tapering was also in the air. The Fed has kept the fed funds rate under 25 basis points for 4 years. But at some point it will allow this (or some other summary of low-risk short-term interest rates such as the interest rate that the Fed pays on reserves) to begin to rise. The graph below shows the price of a futures contract that pays off based on what the fed funds rate turns out to be in September of 2014; to get the implied interest rate, subtract from 100. The run-up in 10-year yields last June as well as the start of this month were both associated with September 2014 fed funds futures above 25 basis points (or a price below 99.75 on the graph below). Although the Fed views its decision to start raising short-term rates as something that will come significantly later than any tapering of large-scale asset purchases, the market seems to be assigning some probability that the next cycle of rate hikes could begin before the end of next year. And that assessment seems to be tied closely to speculation as to when tapering will first be announced.
 |
Alternatively, one can look at forward rates implied by the current term structure of Treasury yields. The basic idea of a forward rate is to consider the return I could get if I were to sell $1000 worth of a bond that I have to pay back with interest 365 days from now and simultaneously buy $1000 worth of a bond that will pay me back with interest 366 days from now. In other words, I pay nothing on net today, will owe something 365 days from now, and get some money back 366 days from, so I’ve locked in using today’s interest rates the return on a one-day loan that I’m not going to make until a year from now. The graph below plots this one-year forward rate along with a 2-year forward rate (the return I could lock in today on a 1-day loan to be made 2 years from now).
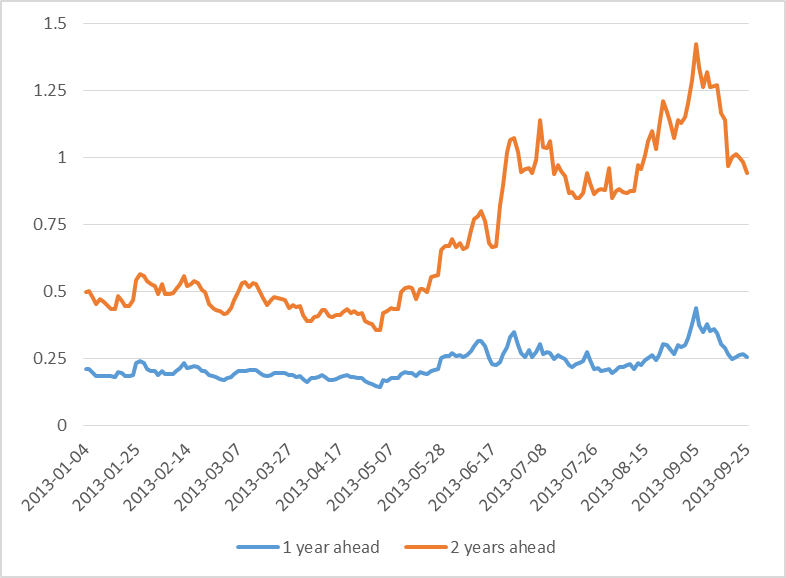 |
These also signal a view as of the start of this month that the Fed would have begun the next cycle of rate hikes by this time next year, with the short rate up above 1.25% within two years. As the market changed its assessment about the timing of the taper, there was a corresponding change in assessment of the timing of the rate hikes.
There is also a potential contribution of a risk-premium to these longer-range futures and forward rates, which may matter at this point in the cycle. Nevertheless, I think the correct overall interpretation of the data over the last few months is consistent with the view I offered last year:
the primary significance of large-scale asset purchases is not their direct effects, but rather their usefulness as a supplementary signaling device, adding an exclamation point, if you will, to the Fed’s communication of its future intentions.
My conclusion is that it’s the prospect of future rate hikes, not plans of tapering, to which markets have recently been reacting.
If you try to understand monetary policy by thinking about interest rates, you’ll just confuse yourself. Milton Friedman was right, it’s not about interest rates.
Thank you, Professor Hamilton for the interesting narratives…
Yes, we have had four years of FedZero and will likely have many more…
The Fed tapered the taping talk, because market rates got ahead of Fed policy and that is a no no…
We are in for sustained sub-growth for the foreseeable future…What will the Central bank do upon the arrival of the next recession?
This extended distortion, by government planners, will one day cause untold misery to the American people and it’s economy..I do not know what form it will take, but a price will be paid for all of this meddling…
JDH wrote:
My conclusion is that it’s the prospect of future rate hikes, not plans of tapering, to which markets have recently been reacting.
How can you separate the two?
It seems your entire post is to demonstrate that tapering, or not tapering, has an affect on the interest rate.
The FED has pained itself into a corner and that is very clear from your discussion. If the FED stops buying Treasuries interest rates will climb, but the market rates are inching upward even with the FED purchases. That means that over time the FED will have to increase its purchases (as you note, moving from 17% to 32%).
You cannot solve a debt problem with more debt.
But what is the implication of this for the debt ceiling debate? Treasury owns 17% of Treasury debt. What if they just wiped that off the books? Treasury could then float more debt. But obviously that would totally expose the illusion that the FED debt is actual debt. That would immediately transform this debt into monetary expansion with no off-setting liability, and the FED would find itself having to justify it a huge loss in “revenue.” The markets would react immediately and not in a pretty way.
Finally, this whole discussion misses the point. The financial numbers being discussed are about dumb money, money that transmits no useful information to the productive economy. It is all about manipulating money to impact the monetary statistics, not create busniesses or jobs. These games are an illusion and essentially meaningless except for the uncertainty created by the lack of information that just injects more confusion into market transactions.
Until something is done to change the economic environment, production will continue moving out of the US to more stable environments, Israel, Canada, Australia, Southeast Asia.
This debate is arguing how many angels can dance on the head of a pin while the people starve.
News From the New Governor of India’s CB
In his first official act as the new governor of the Reserve Bank of India (RBI), Raghuram Rajan raised the benchmark interest rate from 7.25 to 7.5%, causing a ripple of surprise in financial circles and eliciting protests from various business representatives. But for people who know the current condition of emerging markets and Rajan’s professional trajectory, this was not surprising, at all.”
Additional excerpt:
“[In 2005 at Jackson Hole] He argued that under Greenspan, incentives had been artificially skewed in favor of the managers of the financial system, which reaped millenary rewards if things went fine but paid very little, if at all, when things turned sour. And he added that things were likely to turn sour because the skewed incentives were offering incentive to those managers to take excessive risks. He then focused on the “credit default swaps” which promised to repay delinquent loans in exchange for moderate insurance premiums. Noting that nobody really knew how realistically these swaps were priced, Rajan said that the banks were probably taking excessive risks because they trusted that the insurer would repay them. In these circumstances, a sudden increase in defaulting loans could exceed the reserves of the insurer, leading to a financial crisis. This is exactly what happened two years later, leading to the 2008 financial crisis.
The Financial Times quotes his rationale: “Let us remember that postponement of tapering is only that—a postponement…Let’s not lose the chance, the warning that we have been given, because this is going to come back and what we need to do is put our house in order before.”
Prof. Hamilton,
When the Fed buys a Treasury, Agency or GMA bond, why doesn’t this count as paying off the bond?
The person or organization who loaned Uncle Sam some money, has the money back.
I understand, from an earlier answer of yours, that the Treasury pays the Fed interest on the Treasury bonds the Fed holds. Then at the end of the year, the Fed gives these interest payments back to the Treasury labeled as profits.
Why doesn’t Ben Bernanke ask one of his assistants to take the Fed’s newly purchased bonds from Fed headquarters on Constitution Avenue a few blocks to the Treasury Department on 15th Street, where someone could mark them as Paid In Full?
Why do Treasury and other government bonds held by the Fed count against the debt limit, since they’ve already been paid off?
Left Coast Bernard: I discuss this question in detail in Section 3D (pages 18-23) of this paper. Basically although now the Treasury only owes the Fed, the Fed has created a new liability that it owes to banks in the form of interest-bearing reserves. Essentially the government has swapped a long-term liability (Treasury bonds) for an overnight liability (bank’s reserve deposits with the Fed).
If the Treasury did not pay the Fed interest on those Treasury bonds, the Fed would be unable to pay interest on bank reserves.
JDH
Do you have an estimate for the impact of the ACA on discretionary income following the implementation of the ACA? Over the next year tens of millions of households, many with binding budget constraints, must increase the fraction of their income devoted to healthcare spending, relative to the fraction they spent this year.
We can take as given the claim that coverage will improve for those that currently have little to no coverage.
Nevertheless, discretionary income will fall for tens of millions of households who are forced to purchase coverage for the first time, and for those who are forced to pay more because their current policy does not meet the minimum coverage standard. (Given, some will see an offset from subsidies).
Is there an equal and offsetting reduction in healthcare spending by households (relative to last year) somewhere in the system? If not, then perhaps the FED is wise to delay tapering for a year to offset the negative ACA shock to discretionary income.
Shouldn’t you be looking at the Fed’s ownership of treasuries on a DV01 basis? The chart understates the magnitude of their position when it doesn’t consider duration.
MP: Yes, you’re right. If I’d had more time for this post I would also have updated the calculations you’ll find here.
“There are in any case substantial problems with the “flow” view of the importance of QE3. For one thing, it is hard to arrive at it from any economic model. Anyone who holds Treasury securities is free to sell them at any time they like,…”
I would like to see the Treasury debt series sans foreign official holdings. These might in some sense be viewed as locked in stasis, being part of foreign monetary bases. True, they could be traded for other reserves (yen or euros, for example), but the metrics do not seem the same as for new Treasury issues.
Your graph of Treasury debt looks frighteningly like other bubbles we have witnessed of late.
JDH: “the primary significance of large-scale asset purchases is not their direct effects, but rather their usefulness as a supplementary signaling device, adding an exclamation point, if you will, to the Fed’s communication of its future intentions.”
Yep, sounds about right. When you reach the zero lower bound about all you have left is future guidance. Actions, even symbolic ones, speak louder than words.
Hi, where can I find the One-year forward and two-year forward overnight interest rate series? BTW, how does your analysis apply to the increase in T10 yields beggining on may? thank you very much!
Gustavo: The forward rates are reported in the spreadsheet here. I’m telling the same story about the May increase– although the press focused on talk of tapering then, if you look at the behavior of the futures and forward graphs above, it looks like markets were reading this as signaling near-term hikes in the short-term interest rate.
Some very interesting articles in The Economist this week.
Here’s a terrific chart on historical current account balances. I think it strongly supports an oil shock and Blame-it-on-Beijing thesis–particularly the oil shock aspect.
Well worth a separate discussion by, say, Jim.
Another from The Economist on the impact of disability insurance on the unemployment rate. Were Menzie in a mood to run a pure technical analysis, also well worth discussing. (In reality, it’s probably more a Tyler Cowen or Bill McBride piece.)
http://www.economist.com/news/finance-and-economics/21586810-rising-disability-claims-may-explain-americas-shrinking-labour-force-missing
For Menzie – Again from The Economist, on pros and cons of austerity. It would they were hanging around here during our debate of two weeks ago.
http://www.economist.com/news/schools-brief/21586802-fourth-our-series-articles-financial-crisis-looks-surge-public
Finally, has anyone noticed that President Obama has gotten much better at his job?
Sorry, here’s the current account article:
http://www.economist.com/news/finance-and-economics/21586838-less-skewed
Scott Sumner has it about right today;
http://www.themoneyillusion.com/?p=23914
‘But it’s [monetary policy] not important because of the effect it has on interest rates, they are not an important part of the monetary transmission mechanism. If economists focused more on stock price movements and less on interest rate changes they would notice that monetary policy is extremely important even at the zero bound. Monetary policy is very important because it affects the expected path of nominal GDP. An expansionary monetary policy might raise or lower long-term bond yields, but it will always increase expected NGDP growth.’
Hi James,
any news from Harvard, the community shall know ?
Do you already miss relaxed sunny San Diego ?
Good luck !
Both prospects for sooner or later tapering and prospects for sooner or later rate hikes are driving movements in Treasurys. And there are other factors, which I’ll get into below.
A narrow “flow” model of the market that looks only at Fed purchases and net issuance is obviously wrong. But traders aren’t wrong believing that flows set prices. The trader is including within his definition of flows all kinds of trading of existing stocks, which are the greater part of flows broadly defined.
The “stocks” view is nothing more than a model of how that broader view of flows works. It’s an overly simple model that doesn’t really tell us very much. As JDH puts it: “the equilibrium price (or yield) must be such that the stock currently held is the quantity investors want to hold.” Well yes, of course. That’s a tautology. What does it tell us about how prices will react to a decrease in Fed purchases? Mmm, nothing.
It turns out we’re not really interested in the price at which investors are willing to hold their stocks. We’re interested in the prices at which investors will be willing to accumulate more stocks, depending on how much more stocks they’re asked to accumulate.
In our present situation, investors are not accumulating, they’re selling. That’s mainly because Treasury has been putting off spending and squeezing money out of GSEs to delay hitting the debt ceiling. Net issuance has been zero since April while Fed purchases have been about $150bn. So the market price recently has reflected the price at which the marginal investors have been willing to sell at that rate.
The scale of flows and stocks both matter. The Fed’s net purchases of ~$35 billion a month seem small compared to more than $10 trillion of stocks held outside the Fed. But the proper comparison is to stocks of the longer-term debts that the Fed is buying. The Fed buys only 4+ year debt. There’s about $4.6 trillion of that outstanding. The Fed owns $1.35 trillon 5+ year debt and $440m 1-5 year debt. So roughly the Fed owns $1.5 trillion 4+ year debt and the public owns $3.1 trillion.
Compared to that, the Fed’s ~$420 billion a month of purchases aren’t so small.
With the deficit running around $650-$700 billion, we know that net issuance will eventually turn positive and roughly equal the deficit. Predicting how much of net issuance will be 4+ year is tricky, but let’s guess it will be half or $325-$350 billion a year. That’s $27-$29 billion a month.
That leaves us with the following impact of taper: Without taper, Fed net purchases will be greater than net issuance, and the public will be asked to sell an average of $6-$8 billion a month from its $3.1 trillion of supply. With taper, net issuance to the market will turn positive until the public is instead being asked to accumulate $27-$29 billion a month.
That’s not a colossal difference, but it is an important difference. Changing opinions on whether and when taper will happen would affect prices even if there were no change in opinion on the course of future short rates.
That all said, opinions on the future of short rates also matter very much to prices, and they too have moved. That has been perhaps even more important than changing opinions about the timing of taper. It’s impossible to know the relative weights of such simultaneous impacts.
There are also other factors, and one has been very important: the ability and willingness of foreign central banks to accumulate Treasurys. QE lowers rates for dollar credit in foreign countries, and news of pending taper increased those rates and thus reversed the direction of net dollar flows to outward from many countries. So many of the foreign central banks that have been buying large amounts of Treasurys no longer have inflows of dollars with which to buy them.
@Patrick – No, Sumner’s all wet. QE has pushed up equity prices mainly through a multiples expansion, while profit growth expectations have actually fallen. There’s no evidence that QE has any effect on NGDP or NGDP expectations other than through lowering interest rates.
PS Another thing to keep in mind on this topic is that Treasury issuance creates demand for itself. The government sells bonds then spends the money, which eventually becomes someone’s savings. With QE that created additional savings meets no corresponding additional supply of Treasurys.
“Finally, has anyone noticed that President Obama has gotten much better at his job?
Posted by: Steven Kopits at October 1, 2013 06:12 AM”
Thank you, Mr Kopits, for the enlightenment!