1. From my (undergraduate) Economics 390 “Topics in Macro” midterm:
Consider this statement:
“Borrowing and spending by the public sector will crowd out investment and growth in the private sector.” Paul Ryan, “Path to Prosperity” (April 2012).
1.1 In a standard IS-LM model, where investment spending is given by:
(7’) I = b0 – b2i
Will higher government spending crowd out investment? Use a graph to help explain your answer.
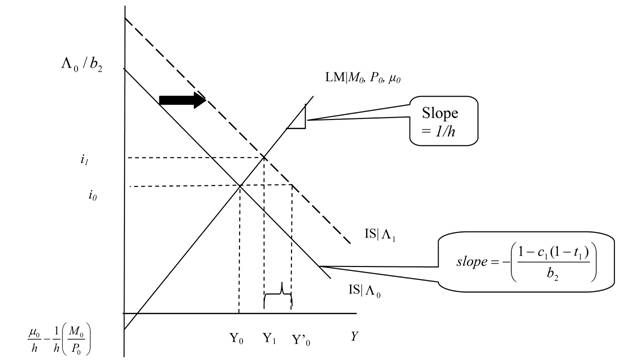
Answer: The increase in government spending shifts the IS curve out by α‾ΔGO ; aggregate demand
would rise to Y’0, except for the increase in interest rates – associated with the higher money demand
arising from higher income – decreases investment. [α‾ ≡ (1-c1(1-t1))-1]. Hence, there is crowding out of investment of:
Δ I = −b 2 Δ i < 0
The distance Y’0-Y1 is the amount of income crowded out.
1.2 Suppose instead investment spending is given by:
(7) I = b0 + b1 Y – b2 i
Do we know if government spending will result in reduced investment? Use a graph to help explain your answer.
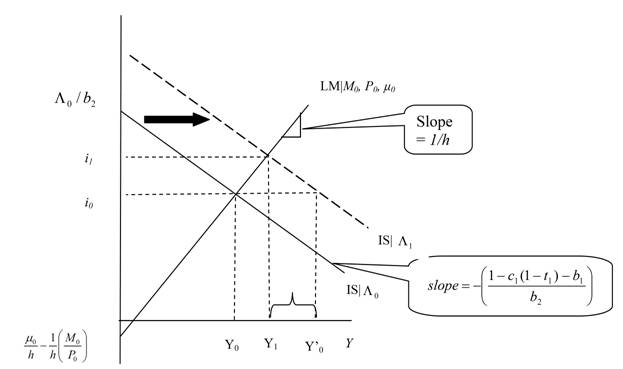
Answer: The increase in government spending shifts the IS curve out by α ‾ Δ GO ; aggregate demand
would rise to Y’0, except for the increase in interest rates – associated with the higher money demand
arising from higher income – decreases investment. [Now α ‾ ≡ (1-c1(1-t1)-b1)-1]. Hence, there is crowding out of investment of:
ΔI = b1Δ Y – b2Δ i ? 0
The distance Y’0-Y1 is the amount of income crowded out.
1.3 If the economy starts out in a liquidity trap, what is the impact of an increase in government spending on investment (assuming equation 7)? Use a graph to help explain your answer. Be careful to state your assumptions.
Answer: Assuming the economy ends up in a liquidity trap, then investment will increase.
Recall:
ΔI = b1 ΔY – b2Δi
As long as interest rates stay at zero, then
ΔI = b1 ΔY > 0
Where by α‾ΔGO = ΔY and α‾ ≡ [1-c1 (1-t1 )-b1]-1
1.4 Consider problem 1.3 again, but assume:
Where MB is money base [B is government bonds], and the price level is held fixed. Use a graph to help explain your answer. Be careful to state your assumptions.
Answer: The correct answer depends upon whether interest rates remain at zero. In this case with the revised money demand equation, the LM curve will shift up due to the increase in government spending (as long as the initial budget balance was zero or less).
If the interest rate does rise (as in the figure above), then investment might or might not fall. Otherwise, investment will increase.
Relation to Current Conditions
I can hear now certain individuals (the usual suspects) muttering about ivory tower economics and the irrelevance of such concepts to real world conditions. Hence, it’s interesting to see what Goldman Sachs sees as important to investment behavior. From D. Mericle, “Capex: The Fundamentals Remain Strong,” Goldman Sachs 11/12/2013 [not online]:
- Business investment has been weak so far this year and grew a disappointing 1.6% in Q3. But it is not surprising that businesses have been hesitant about investing in a year that included a $200bn tax hike hitting consumers and a large drop in government spending.
- Our investment growth model suggests that consumer demand is the missing piece of the capex puzzle. In contrast, the other fundamental drivers of business investment growth remain strongly supportive. Profit rates are high, lending standards continue to ease, and the starting level of investment remains low.
- We expect capital spending to strengthen next year, with an added boost if consumption recovers in line with our forecast. This reinforces our view that private sector spending should accelerate in 2014, pushing GDP growth into the 3-3.5% range.
(emphasis added – mdc)
I think it’s of particular note that output (consumption in particular) is seen as a critical driver of investment; crowding out due to high interest rates — current or incipient — is nowhere to be seen.
Profits (which are correlated with economic activity) are another positive. This also suggests the accelerator effect is more important than the dreaded crowding out effect due to fiscal policy.
By the way, despite the recent increase in long rates, the real ten year interest rate in October is just now reaching levels last seen in mid-2011 (and is much below levels recorded before the recession).
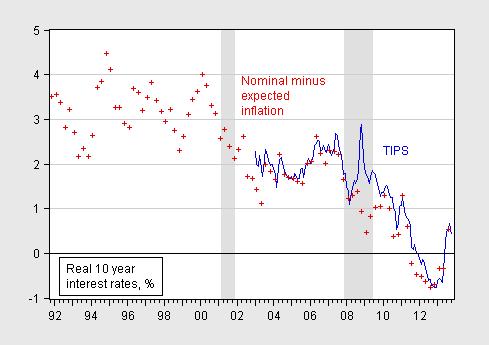
Figure 1: Ten year constant maturity TIPS yields (blue) and real ex ante yields calculated as difference between ten year constant maturity nominal yields and mean expected ten year inflation from Philadelphia Fed Survey of Professional Forecasters. NBER defined recession dates shaded gray. Source: Fed via FRED, Philadelphia Fed, NBER, and author’s calculations.
The astute observer will note that in 2009-2010, as the American Recovery and Reinvestment Act was implemented, real interest rates declined even as spending rose and peaked.
Awesome, this is why I come to this blog. Clear and concise. Hard to argue with it due to its clarity of exposition and relative simplicity.
Menzie,
An even more astute observer would note the growth of the monetary base in that 2009-2010 period (and beyond).
gofx: A yet even more astute observer would note that most estimates of the impact of QE1/QE2 range 0.4 to 1.6 ppts; add those values to the October real yield, and at most we are still at the rates just before the recession. Use the midpoint, and we are at early 2009 rates, before ARRA kicked in.
Technically Goldman Sachs only uses ivory tower economists to mislead clients of its sell-side desk. That’s not much of a proxy for the “real world”.
As the prior astute observer observed, by 2009 QE was in full swing whether bond investors liked the stimulus or not.
Speaking of numerology, when’s that J-curve on Japan’s exports that you predicted earlier this year thanks to Abenomics going to kick in? Given that Japan’s trade deficit keeps getting more negative as the yen weakening backfires…
Menzie,
A totally astute observer would note that monetary policy impacts are not solely transmitted via interest rates (short and/or long), but also through expectations (including dY (Accelerator!), especially coming right out of a financial crisis where lender-of-last-resort, conventional, and unconventional monetary policies were all in effect, some at extraordinary levels. BTW why are we still using IS-LM to analyze this?
To paraphrase, the system is initially at equilibrium. Increased government spending pushes the system to a shift to a new equilibrium state. Does the concept of metastable equilibrium ever become applicable? In other words, does there exist another equilibrium state that can only be reached by transitioning over a barrier (in thermodynamics, it is called an activation energy). The graphs would be reasonable only until that activation energy barrier was exceeded at which point a new equilibrium would be established that would not be predicted by the above graphs.
Menzie, great post. Question for you (and anyone else): Suppose the future payoff of a firm’s investment depends on two things: 1) firm-specific factors; and 2) macroeconomic factors, e.g., NGDP, which is presumably correlated with demand for the firm’s goods. Next, suppose the firm wants to hedge its investment bet, and can “short” an NGDP 2020 Index, thereby insuring against a low-demand (low-sales revenue) outcome. So, the question is: if there were “macro markets” of this kind, wouldn’t Investment be greater?
gofx: Well, I’m happy to entertain the role of expectations – but I don’t see how that changes the analysis in a profound way. (The recommended textbook — Blanchard and Johnston — allows expectations to shift the IS and LM curves.)
And I am curious what model you’d prefer to use? An RBC (the downturn due to shift in preferences for leisure, perhaps)? Do recall that one of John Taylor’s contributions was incorporation of model-consistent expectations in essentially a conventional AD-AS model.
I am in agreement that financial accelerator is important. See Problem 5 in the midterm.
Menzie –
Maybe this is just a Rorschach test, but when I look at your graph of stimulus spending & interest rates (https://econbrowser.com/archives/2013/05/co_heritage2.gif), I see that interest rates stayed well above zero until stimulus spending tapered off, *despite* a concerted effort by the Fed to push rates to zero.
Secondly, Ryan’s budget sounds like a long-run plan (the sentence previous to your quote references the year 2025). How do the questions change if you are using an AS-AD framework in the long run instead of the short run?
anonymous,
it is possible that another equilibrium point could exist-not too sure about its stability however. you could also interpret that approach as economic eigenvalues. the problem is we have working models as shown above. we do not have good working models that can easily produce these equilibrium points (stable or unstable), or eigenvalues. if you can produce a valid model which has these points, great. but be careful to suggest current models are incorrect because of a behavior you posit to exist, but cannot demonstrate with your own model. i don’t disagree with your thinking-need to stay flexible-but we need a model for proof.
gofx,
“An even more astute observer would note the growth of the monetary base in that 2009-2010 period (and beyond).”
and what exactly does this have to do with crowding out? how does it prove your argument?
Salim: Spending tapered off in 2010, and yet interest rates continued to decline. Not exactly the pattern I expect.
The Ryan plan, as described (not scored) by CBO looks pretty contractionary immediately — if you’re going to magically and in an unspecified way going to cut revenues by 5 ppts of GDP by FY2014 and keep deficits from exploding, then spending must…(I’ll let you finish that thought)
Finally, I don’t answer exactly the same questions in the context in an AD-AS framework, but if you can solve Problem 1 in the Econ 390 practice midterm, you’ll have your answer. I might do that in the next post.
Ecomedian: Re: J-curve, see WSJ RTE.
The whole concept of crowding out becomes silly when the banks can borrow at negative real interest rates. In that case there is essentially an unlimited supply of money available for businesses who can present a worthy business plan. The current problem is that without a solid demand increase there is no way for a business to expand. In other words we have do not have a lack of money we have a lack of “worthy business plans”. Government borrowing does not “crowd out” private sector demand.
Menzie, (brief, more when I can). Glad you added expectations. I just think their effect is larger. Maybe add mundell-fleming (global recession). I do empirical non-academic work so I will borrow from or think it through from several approaches including RBC,NK,OK, ABC (“sectoral” crowding out?) ending up in an “a theoretical” VAR sometimes. On the fiscal multiplier issue the IMF used NK TVARs; Christina Rormer used a “narrative” approach. The key point is that whatever model you use, monetary policy and asset market conditions must be adequately represented due to the financial nature of the crisis and the extraordinary nature of monetary policy response. Even though it is probably too interest rate centric for me, I am always tempted to run Ray Fair’s model too!
Well, gee, after 5 years we ought to be able to see that Federal spending as a percentage of GDP is higher than the 20% it was prior to the recession. Simple arithmetic tells us SOMETHING else has to have declined.
@Menzie, if it wasn’t for those meddling one off factors the J curve would have gotten away with it!
Looking in vain for evidence of a J in the trend:
http://www.tradingeconomics.com/japan/balance-of-trade
Real world data appears to be thwarting ivory tower economic models again.
Ecomedian: Real economists use regression, not bivariate correlations. See here. Maybe no J-curve in aggregate, but I do believe that net exports rise relative to counterfactual. The reduction in nuclear power use (and hence associated increase in foreign energy dependence) is pretty exogenous.
Regarding problem 1.3, a better question would be – If everything you have learned in this course about Keynesian stimulus is correct, then why are we still in a liquidity trap?
tj,
perhaps you fail to acknowledge we had effectively one year of stimulus. however, we have had multiple years of austerity in the form of cuts in federal, state and local employment. we also had sequestration cuts-which appear to be even larger in the coming year. so really, what is this keynesian stimulus you talk about? our lack of keynesian stimulus could be why we are still in a liquidity trap? or you can look at europe to see how austerity works.
Isn’t it true that the “crowding out” hypothesis assumes that banks (which are the principal source of the credit that finances most residential and corporate investment) lend out of a fixed supply of loanable funds? If government borrows some of these, that shrinks the supply and raises the price of the remainder?
It’s my understanding that banks don’t operate like that. They lend by creating deposits out of nothing (similar to how the Federal Reserve creates reserves balances out of nothing when it purchases bonds in its Open Market Operations). There is not a fixed supply of credit that government competes for against private borrowers.
Banks lending isn’t constrained by a supply of loanable funds; it’s constrained by the availability of creditworthy borrowers.
Further, from the private lender standpoint, the purchase of Treasury debt does not make the funds expended unavailable for other use. The bond is highly liquid and safe and can be pledged as collateral in repo or in an ordinary term loan, and the proceeds used to fund whatever investment would have been funded by the funds originally lent to the Treasury. There would be a haircut in repo, and the bank interest will typically exceed the T-bond coupon, but those are relatively minor effects, it seems to me. “Crowding out” is too aggressive a term for such minor second-order effects.
perhaps some examples of previous liquidity traps and how they were escaped might be helpful?
If investment = savings = business savings + public savings + household savings + net inward foreign investment,
(where “net inward foreign investment” is defined as the current account with its sign switched)
how does reducing public savings (ie increasing public borrowing) increase investment?