From an opinion piece by Sean Fieler in USAToday:
If easy money delivers what it always has throughout history — growing inflation, growing inequality and growing government — a Republican embrace of sound money will offer America a way back to prosperity and the GOP a way back to a governing majority.
I found the reference to growing inflation of interest. Here are some data of relevance. They indicate low and declining inflation using various measures, CPI, PCE, PPI, core, headline.
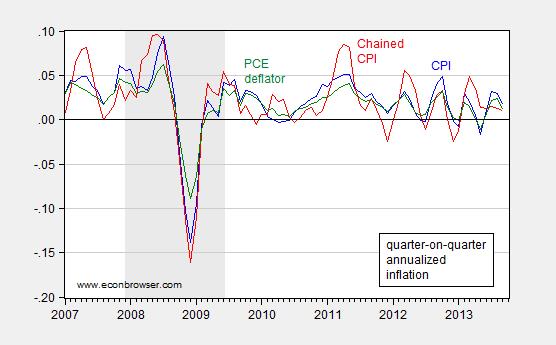
Figure 1: Quarter-on-quarter annualized inflation measured by CPI (blue), Chained CPI (red), and personal consumption expenditure deflator (green). All, seasonally adjusted, measured using log differences. NBER defined recession dates shaded gray. Source: BLS and BEA via FRED, NBER and author’s calculations.
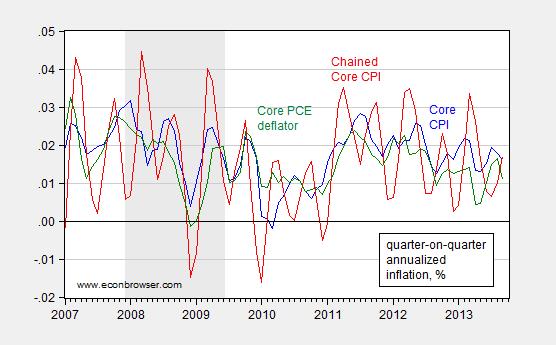
Figure 2: Quarter-on-quarter annualized inflation measured by core CPI (blue), Core Chained CPI (red), and core personal consumption expenditure deflator (green). All, seasonally adjusted, measured using log differences. NBER defined recession dates shaded gray. Source: BLS and BEA via FRED, NBER and author’s calculations.
These graphs indicate low and declining headline and core inflation. Low inflation also shows up at the producer stage.
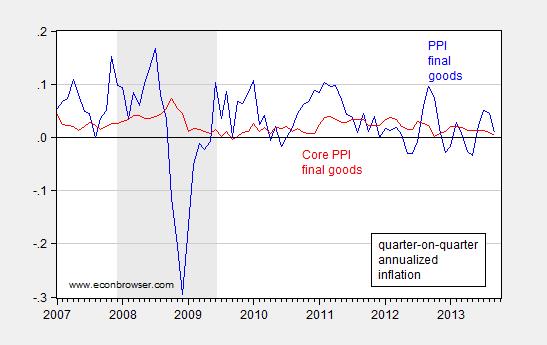
Figure 3: Quarter-on-quarter annualized inflation measured by PPI for final goods and services (blue), and core PPI for final goods and services (red). All, seasonally adjusted, measured using log differences. NBER defined recession dates shaded gray. Source: BLS and BEA via FRED, NBER and author’s calculations.
At this juncture, I’m certain the usual suspects (and others) will argue that there is a massive conspiracy in place to hide rapid inflation. I therefore appeal to a non-governmental source, namely the Billion Price Project (discussed by Jim here):
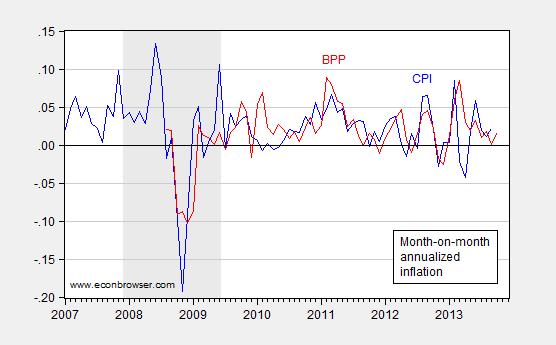
Figure 4: Month-on-month annualized inflation measured by CPI (blue), Billion Price Project (red). CPI seasonally adjusted. NBER defined recession dates shaded gray. Source: BLS FRED, Billion Price Project, NBER and author’s calculations.
Note that the month-on-month inflation measures are similar. Whatever differences exist, they are nothing like the massive differences cited by John Williams at Shadowstats (ably debunked by Jim here).
Finally, it’s of interest to note that inflation expectations have remained fairly stable.
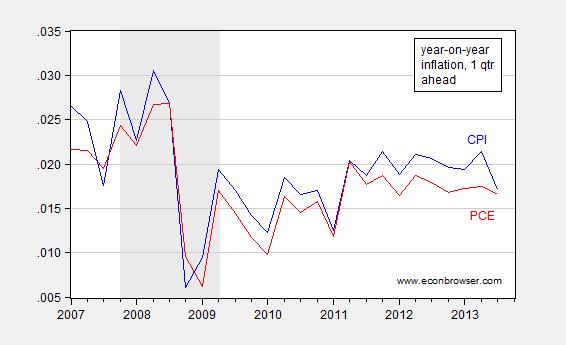
Figure 5: One month ahead year-on-year inflation using CPI (blue), and PCE (red). NBER defined recession dates shaded gray. Source: Philadelphia Fed Survey of Professional Forecasters.
Oh, and the allegation of growing government — just look at Figure 6.
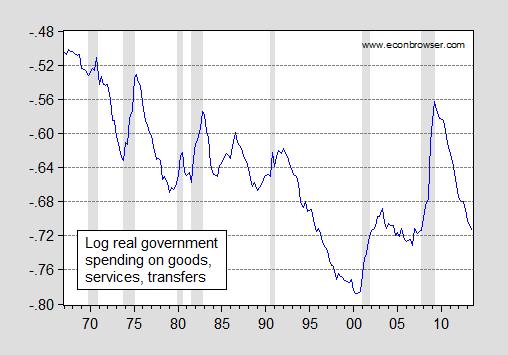
Figure 6: Log real government spending on goods, services, transfers ex-interest payments, all levels ratio to GDP. Government transfers deflated by PCE deflator. NBER defined recession dates shaded gray. Source: BEA, NBER and author’s calculations.
Finally, I will note that the piece is remarkable for the detachment from data (in addition to detachment from reality). Mr. Fieler notes:
“…the Fed’s nearly $4 trillion balance sheet expansion.”
This is a problematic assertion because the Fed’s balance sheet is only $3.6 trillion (as measured by monetary base, in October — MDC 11/19, 3:20PM) [1], which is only $2.8 trillion higher than before the unconventional monetary policies undertaken by the Fed. But I guess the ability to do proper addition and subtraction is too much to ask for in this type of fictional literature.
I don’t know if the article was modified, but the text reads: “After all, labor participation rates remain near 20-year lows despite the Fed’s nearly $4 trillion balance sheet.”
The Fed’s balance sheet total, as of Nov. 14, was $3.95 trillion.
http://www.federalreserve.gov/releases/h41/current/h41.htm
The author does have a point, in fact, three:
Costs have been rising faster than wages. I personally don’t think easy money is the reason, but it does appear to be happening, and no one has really proposed a convincing explanation of why, or what the path is likely to be. (Of course, I could propose an explanation…)
I think it’s also reasonable to assume we’re seeing an asset bubble due to low interest rates. Certainly in the investment community, this is broadly held to be the case. So low interest rates are helping those with assets at the expense of those without.
It’s also true that low interest rates are facilitating government deficits and creating the impression that we can afford levels of debt which, by the standards of 1970-2008, would appear potentially crippling.
Americans are being shaken to the core by the explosion in their health insurance premiums. Health insurance has a weight of 0.659% in the CPI! Hardly more than the .411% weight on pet services!! According to the BLS, health insurance costs for consumers rose just 2.4% over the year!!! Preposterous! What is this all about?
“The CPI began publishing a health insurance index in January 2006. The weights in the CPI do not include employer-paid health insurance premiums or tax-funded health care such as Medicare Part A and Medicaid. Currently, the index employs an indirect method for measuring price changes for health insurance premiums. Under this indirect method, the medical care index will not be affected by changes in policy characteristics, such as modifications to policy benefits and utilization changes. The approach implicitly assumes that the level of service from individual carriers is strictly a function of benefits paid. While other components may affect the index, such as more convenient claims handling or a 24-hour nurse line, their effects are probably small. This indirect approach factors medical insurance premiums into two parts: Changes in the prices of medical care items covered by health insurance policies. Changes in the cost of administering policies, maintaining reserves and, as appropriate, profits.
Most expenditure for health insurance goes to the first item above, and reflects insurers’ payments for medical treatments. The CPI allocates this portion to the indexes that account for medical care items (i.e. physicians’ services). Thus, the weights for most of MCS indexes reflect out-of-pocket expenditures plus allocated health insurance benefit payments. (It is for this reason that providers’ reimbursements from insurance companies are valid prices for the CPI.)
The price change that the CPI uses for the remaining weight, changes in the retained earnings of health insurance carriers (the second item above), is the product of two relatives of change: The change in the retained earnings ratio, and the change in the cost of medical items from elsewhere in CPI medical care.
Retained earnings ratios are calculated based on data obtained from various industry sources. BLS acquires calendar year data on premium income, benefits payments, and retained earnings from national non-profit health insurance carriers and from Bests Insurance for commercial carriers. The relative of change is calculated by dividing the previous year’s ratio by the current year’s ratio. The relative of change is then converted to a monthly relative (by taking its twelfth root), and these changes are used monthly to reflect retention margins. The second relative reflects price change for the eight medical care items whose basic weight includes allocated health insurance premiums.
Challenges to pricing health insurance The current indirect method for measuring health insurance premium changes does not mimic the way consumers pay for health care and it forces the medical care indexes to measure changes in what medical care providers receive from insurance companies rather than what consumers pay for the medical items out of pocket. A direct measure that would have an index for health insurance premiums along with out-of-pocket indexes for the various medical items would be an ideal way to measure medical care price change—provided that BLS could produce an accurate constant-quality index for health premiums. The CPI has tested the feasibility of directly pricing health insurance policies several times and each time showed that there were major barriers to obtaining data on changes in quality variables such policy benefits and utilization (the number of claims per insured). Consequently, BLS was unable to produce consistent constant-quality premiums for health insurance policies for use as CPI prices.”
No business would hire the economic statisticians, nor the academics who train them, who put out drivel like this that so distorts reality.
The hinder part is foremost in classrooms and halls of government in far, far more than this. And Americans, a notoriously tolerant people, are finally waking up to it.
James Pethokoukis at AEI would agree with you that inflation is basically non-existent and that GDP and employment are depressed.
However, he doesn’t draw the conclusion that continued massive spending and growth of debt is a sound solution.
http://www.aei-ideas.org/2013/11/larry-summers-fears-the-new-normal/
Of course the government cooks the inflation books. They have been doing this for decades. This is not a partisan thing it is a political class thing to keep the voters ignorant. They remove food and energy from the “core” numbers to create a more stable measure. Duh!! I thought the numbers were supporsed to actually report on changes not stabliity. If you can’t get stability change the methodology.
But that said, inflation can be manifest when prices don’t change but purchasing power crashes. The prices of goods for the average citizen are significcantly down. A family could afford a $250K home during the Bush adminstration. Now they have difficulty finding a home to rent at a price they can afford. Those out of the workforce are at record levels. There has been massive destruction of wealth greater than of the bursting bubble.
This is another problem with demand side analysis. If it can’t be expressed in money values it is not important to demand side economists. They only look at the dollar values and actual goods and services are secondary.
Professor Chinn,
For those who experienced inflation in the 1970s & 1980s with treasury rates above ten percent and mortgage rates above 15%, can you help us understand the salient differences between now and then and why you think inflation may or may not be a problem in the next few years?
When talking about inequality, it’d probably make sense to look at the basket of goods, and break it down as necessity, unecessary, and highly needed. Just because inflation is low, doesn’t mean it’s low for every demographic. There can be deflation is high end goods while there is inflation in lower end good that are needed and not easily substitutable.
Steve, I think financials have been in a bubble for over a decade. Much of the wealth in that sector is probably just inflation.
Maybe we’re about to seem the steam let out. GE is selling off a big chunck of it financial part.
http://www.bloomberg.com/news/2013-11-15/ge-gets-back-in-the-stuff-business.html
Discretionary stuff is cheaper due to productivity, cheap energy, and a still-weak consumer.
Government-meddled necessities like utilities, health care, and education are still going up at a rapid clip though.
jbh,
i think you are combining concepts of inflation and concepts of rising health care costs at your convenience, and separating them at your convenience as well.
rising health care costs are NOT necessarily inflation. there is nothing to say that a low inflation environment should warrant slow health care cost increases. the MRI is now in common use, and it still has significant cost of use. but its inclusion into health care costs over the past decade will certainly cause the cost of health care to rise. but, at least to me, that is NOT inflation. this is the result of new product and supply/demand. premium increases are more a result of employer profit margin than a response to inflation-contrary to what is broadcast in the media.
why are you complaining the BLS is wrong because it cannot gather valid data for both the employer paid and the out of pocket cost to the employee? the system is intentionally set up this way. that is why health care is not a free market system. price discovery really does not exist!
Adjusting the purchasing power of wages and all income of the bottom 90% for the higher cost of energy, health care, and payroll taxes as a share of hourly wages, hours worked, and household income, the purchasing power of the bottom 90% is at the level of the late 1950s to early to mid-1960s.
The similarly adjusted purchasing power of the bottom 50-60% is at the level of the 1930s-50s. Were the decelerating trend to continue for the bottom 50-60%, their purchasing power will be back to the late 19th and early 20th centuries by the mid-2020s, and to the 1930s-50s for the bottom 90%.
“Progress” ceased for the bottom 50-90% of Americans in the 1970s-80s.
Gains for the top 1-10% have come primarily from growth of debt-money, debt, and asset inflation of 6-7%/year (vs. 3% for wages and production) and the secular effects of financialization of the the economy and the increasing monetization and commodification of every aspect of existence.
Now that the differential rate of growth of public and private debt to GDP has reached the order of exponential magnitude (characteristic of the point reached before a secular debt-deflationary regime), public and private debt to GDP can no longer grow faster than GDP.
That the trend of GDP since 2007-08 is 2.5%, debt (and debt-money) will not grow faster than 2.5%, which is problematic in that debt-money (lent into existence by private banks, including lending to gov’ts to deficit spend) must grow at least fast enough to provide sufficient debt-money to service debts. The implied ~2% rate of growth of debt-money (largely from the net growth of Fed printing and gov’t deficits) is insufficient to service existing total credit market debt owed. Therefore, no growth of bank lending and debt deflation are the implied outcomes hereafter.
This means price inflation will continue to decelerate and interest rates trend lower, even as wage growth decelerates and the purchasing power of wages also declines with decelearting real GDP per capita (now below 1% vs. 2% in 2000).
The further implication is that ZIRP and QEternity will persist indefinitely, i.e., there will be no “exit” and thus no need for an “exit strategy”.
As in 1830s, 1893, 1929, 2000, and 2007, stock speculators are again discounting GDP, earnings, and revenue growth out to 2023-25, thanks to ZIRP and QEternity.
Steven — unit labor costs vs prices:
nonfarm business
…………ULC…………….deflator
2009……..-4.0%…………….0.1%
2010……..-0.3……………..1.6
2011……..+0.5……………..1.8
2012……..4.4………………1.7
2013 2nd Q 2013 over 2nd Q 2012
………….1.5……………..1.2
Maybe over the past year wages have risen more than costs, but that is after four years of prices
rising faster than unit labor costs.
Moreover, the spread between ULC and the deflator
is a major determinate of profit margins and the strength of profits in four of the last five years
directly contradicts your claim.
Yes, I’m using ULC rather than wages. But that is because I believe that is what you should use.
Sean Fieler really only has two issues he is interested in and has spent millions of his personal wealth promoting them — pushing for a gold standard and beating down the gays. I assume there is a connection somewhere there.
In fact, Fieler is right in the middle of the tawdry family feud in Wyoming where he is currently running TV ads gay-baiting Liz Cheney.
Not sure, Spencer.
ULC reflect the cost of producing a unit of output, not wages of the employees, no?
Real median wages are probably a better indicator of how most folks feel.
http://www.huffingtonpost.com/2013/08/22/median-household-income-dropped_n_3794191.html
Is that what you were referring to?
“The weights in the CPI do not include employer-paid health insurance premiums…”
Seems to assume implicitly that “employer paid” means “not paid for by the workers,” which is highly questionable. My own guess would be that a moiety of the insurance costs are passed through to workers (after accounting for the tax subsidy).
Are interest rates, especially long term rates low because of Fed policy, or because of low velocity of money, a world-wide labor glut, and world-wide lack of aggregate demand as both nations and individuals try to cut their spending and increase their savings (nations do this by building up their foreign reserves and running current account surpluses)? Ambrose Pritchard Evans is hardly a liberal Keynesian, but at least can face the fact that except for CEOs and those in the medical and finance guilds, wages for most workers in most trades face downward pressure due to technology and globalization, while the savings of Asia, Germany, and the oil producing nations (Norway, Saudi Arabia, and the Gulf states come to mind) flood the world. Low velocity of money, disinflation transitioning to deflation, chronic unemployment, and low demand are our current problem and the problem for the next decade. http://www.economonitor.com/danalperts2cents/2013/09/24/the-stubborn-slump-in-advanced-economies-fighting-the-last-war-is-not-a-path-to-success/ But still some want to crucify mankind upon a cross of Gold.
For some reason, people have a hard time grasping what money is versus credit and how “printing money” isn’t when it just sits and isn’t converted into credit. I’m not sure why. I don’t think it’s all “politics” but rather a mental disconnection perhaps rooted in the word “money” and thus the idea that “printing money” translates as “making dollars that circulate” when that isn’t what happens. Money in these uses is not credit, which is more like money when it’s actually in use. That measure of money has shrunk and it seems a lot of people have trouble grasping that monetary policy is thus “tight” when “printing money” because the actual “money” available in society as credit is doing lousy.
But I’m not sure why this is hard to understand because people used to grasp the concept of negative real interest rates – and lots of money was made using that knowledge – and that is directly applicable to understanding the issue of nominal rates bumping zero with low inflation. But people clearly have trouble understanding that this is basically the same as the old negative real rates issue, just that we “need” in some way even lower negative real rates than we have and the only way to get those is inflation because nominal stops at zero.
It’s a similar thing with prices. You can find any index you want – and the billion price index is about as big an index as you can find – and people will argue with you. Of course what they tend to want is to pick this price when it’s up (or down if that’s their politics) and then ignore it when the price reverses. That kind of mis-thinking I understand.
Supply side economics of the Reagan era was tagged with the label “trickle-down” economics because it was based on removing wedges to allow producers of goods and services to increase their supplies at a lower cost. The prosperity of the 1980s (and ironically the huge growth of China) gives clear evidence that, as President Kennedy said, supply side policies rasied all boats. Yet today as we face the Yellen Fed and we are seeing the Progressive economic policies, Progressive “trickle-down” economics, devestate the little guy.
Rather than removing wedges hindering producers Progressive policies increase wedges through greater taxes and regulation under the theory that the government will spend us to prosperity and the spending will “trickle-down” to the little guy. We see massive government subsidies thrown at unproven schemes simply because they are called “green” with speculation that it will create employment for the average guy. We see massive quantitative easing and monetary expansion under the theory that the money given to the mega-banks will “trickle-down” to the little guy. We see government living off of constantly increasing continuing resolutions so that the government spending will “trickle-down” to the little guy. We see a Treasury that is constantly on the edge of its borrowing limits under the theory that the borrowing will “trickle-down” to the little guy. We hear claims of prosperity because the stock market is constantly increasing all with claims that it will “trickle-down” to the little guy.
We have the greatest number receiving SNAP payments than at any time in our history. We have more people out of the workforce than at any time in our history. We have an employment number that is stagnant at best. And we have record numbers of people losing their homes.
Yet the Progressives still persist in saying that their policies will “trickle-down” to the little guy.
Compare the “trickle-down” that actually put people to work and increased production and growth in the 1980s to the “trickle-down” that has done nothing but load a mountain of debt on every man, woman, and child in the country.
Stephen — NO, ULC does not represent the cost of producing a good.
It is a measure of the labor cost in a good.
In the first half of this year ULC was 57% of the cost of producing non-farm business output.
Unit nonlabor payments include profits, capital consumption allowances, interest, rental income of persons and indirect taxes.
ricardo, that post was pure bogus. your “trickle down” argument is pure strawman-nobody is saying that today.
you are a supply sider, eh? well, your cost for expansion is at a record low. you can almost get paid for borrowing because interest rates are sooooo low. if that is not a supply side desire, i don’t know what is. and yet business is not expanding. why? there is nothing on the DEMAND side which will prompt increased selling. that is why you see so little increase in SUPPLY. i can remove any supply side wedge you desire, and it will not change the fact that demand is the problem. making more widgets which will not be sold is not productive.
maybe you need to review the debt explosion under reagan before you quote the success of that era. deficit spending under the guise of defense is a form of stimulus spending! so you embrace that philosophy? that is your reagan era!
Sherparick: Interest rates are low because the front of the curve is pegged to zero percent. Fed funds is the anchor, from which rates all the way out to the 30-year can hardly stray. Since 1979, the fed funds 10-year spread averaged 124 basis points. Over the past decade, 185 bp. But the important number is the max spread, which was 349 bp in 1992 (year’s average). If we use this max spread as a benchmark off today’s zero base, the 10-year should probabilistically fall below 3½% today, as where at 2.70% it clearly is. Since 1979 the 10-year has averaged 6.9%, so today’s rates are as you say historically low. But that is entirely because fed funds is zero, and not for any other reason. Measured inflation is not the candidate to explain today’s low rates other than indirectly through Fed policy. Only in 1980 was the real rate of the 10-year below 1%. That is until the past three years (2011-13), where under ZIRP it has been below 1% all three years, averaging 36 bp. This abnormality and artificiality is not because of inflation. It is because of bureaucratic price setting.
Causality for today’s low rates devolves onto Fed policy. ZIRP is in place because of an unwarranted bordering-on-irrational fear of deflation on the part of the Fed and especially Chairman Bernanke. Even more, the core reason for ZIRP still being in place is to “bail out” the 20 biggest US banks and the majority of the banks in Europe – nearly all which are still insolvent. It is a no brainer that if your cost of funds is virtually zero, the carry from investing in longer maturity assets falls directly to the bottom line. Over time, this will cumulatively rebuild capital. And bank capital is where the real shortfall lies. In my judgment, and in the judgment of most savvy market participants, bail out is what drives Fed policy, hence the funds rate, hence the structure of today’s historically low yields. The Fed justifies this policy to the public by the message that real growth is not yet strong enough or sustainable enough to warrant raising rates. They can hide the deeper truth about the banking system and get away with this superficial justification because monetary policy is opaque and completely enigmatic to the public.
Regarding your Keynesian belief-driven conclusion: “But still some want to crucify mankind upon a cross of Gold.” Odds are, within your lifetime you will witness the greatest financial collapse the globe has ever seen. While there are a great many aspects as to why this is likely, the foundational reason is that the globe is now on fiat money. Given the imperfection of human nature, this cannot but lead to catastrophe in a world gone global and fiat for the first time in history. And because of the concomitant increase in the complexity and interconnectedness of the global financial system making it increasingly more subject to shocks, with bureaucratic minds (no less) believing they can guide the system. Mankind is not being crucified upon the one element in all of nature that because of its properties has competed its way over two millennia to the top, to become the quintessential, soundest form of money. Rather, mankind is being crucified on a cross of fiat. The more formal training in modern economics one has, the harder it is to see this.
To the Troll Known as “Ricardo” (you should try reading Ricardo sometime – very pessimistic about Capitalism due to declining return on investment).
1. Since U.S. population and economy grow over time, statistics good and bad are usually “the largest ever.” That 47 million Americans are now take food stamps (many by the way working in low wage jobs because the median U.S. income is around $26,000 a year) out a population of 317,000,000. In 1986, at the peak of the Reagan boom, 19 million were drawing food stamps out of 240 million Americans. The change from then 8% to the current 14% is the effect of the current economy still being depressed (as opposed to the S&L bubble boom of Reagan!) and a larger population of olds whose social security payments are at or near the poverty level. (I know we should turn them into Soylent Green, but we will have to await the arrival of the Libertarian/Koch brothers utopia for that Blessed Day!)See http://www.fns.usda.gov/pd/SNAPsummary.htm and http://www.multpl.com/united-states-population/table for SNAP and population figures.
2. Where you get the work figures you use I can only guess. Participation rate is down from the 2000 peak, but again that part demographics (Boomer aging) and part is the depression. In 977 both Baby Boomers and women in the boomer and pre-boomer generations were coming into the labor force in record numbers. http://data.bls.gov/pdq/SurveyOutputServlet
3. Actually, the 1980s were not so great, they just have some great publicists. There was a double dip at the beginning (1980-83) and popping of the first great bubble at the end as S&Ls showed up as the first big control fraud. Economic growth was actually average higher in both the much despised 1970s and Clinton’s tax raising and regulating 1990s then in Reagan’s “Morning in America” 1980s.
4. I find much to complain about the Obama-Geithner-Lew economic policy, which, including tax cuts has pretty much been an extension of Bush-Paulsen during Bush’s second term, including the tax cuts being made permanent. http://data.bls.gov/pdq/SurveyOutputServlet
There is plenty of supply in the world right now, but not enough demand. We have returned to the world of the 1920s and 30s.
For more on the 1970s see: http://uneasymoney.com/2012/06/18/1970s-stagflation/
For the gold bugs out there, Barry Ritholz as a great article on how money is after all more important as medium of exchange (my labor for this conglomeration of shelter, food, and luxuries I can exchange for it). How many hours of work do I need to pay the rent is what is being measured, whether by a piece of paper or a shiny coin. The chart also showed how real wages fell due to inflation adjustment as the world caught up to the post WWII U.S. during the 1970s through mid-nineties. http://www.ritholtz.com/blog/2013/11/has-the-dollar-really-lost-97-of-its-value-no/
Steve Kopits: I added a clarification that I was using money base as of October (from FRED, as footnoted) as my measure. The quote was exact, as I “cut and pasted” from the Fieler article. Hence, I can only conclude the article was revised after the fact (I indicate deletions and amendations in my articles, but this apparently is not a procedure followed by Mr. Fieler).
Menzie –
I assumed the article might have been changed, since I assumed you probably cut-and-pasted (which is a verb).
But clearly, the author was in error then; he probably read the review, saw the error and changed it.
I have frequently had published articles changed, typically for typos not realized until that time. These have never been noted in the text; but they were not substantive changes, either.
JBH,
“Since 1979 the 10-year has averaged 6.9%, so today’s rates are as you say historically low. But that is entirely because fed funds is zero, and not for any other reason. Measured inflation is not the candidate to explain today’s low rates other than indirectly through Fed policy. ”
then i will ask you the same question I do others, but never get any rational reply.
if you know the rates are being held below their true value, then you know what the true value of interest rates should be. tell me that number. and explain why it should be high in an era of low inflation/deflation and slow/no growth?
your anger with the fed is blinding you to the reality of the economy!
Spencer, I’m more concerned about the disposable income people have after necessities.
It’s not that there is no demand, it’s that the wrong people have fund to express demand.
There is no point in investing when you know that people can’t afford to buy.
The Runaway inflation of 2013 (Not), as seen by the Cleveland Fed.
http://www.calculatedriskblog.com/2013/11/key-measures-shows-low-inflation-in.html?utm_source=feedburner&utm_medium=feed&utm_campaign=Feed%3A+CalculatedRisk+%28Calculated+Risk%29
I would say odds of deflation setting in increases each month. They will especially increase if QEIII ends and the yield curve goes flat or inverts.
Sherparick,
Thanks for supporting my post. Each of you points you take issue with me then say what I wrote was true. I will take back-hand complements.
Sherparick, you could fart into a walkie-talkie and Ricardo would take it as a compliment.
I realized that many of you are very young and only know the supply side revolution through the distortion of biased economic history books. The article I linked in my post above was by Jeff Bell. He was an original member of President Reagan’s supply side economics team. He knows “trickle-down” from both sides and he knows that the Progressive claim of “trickle-down” is a reality of crony capitalist “trickle-up” from the poor to the political class.
ricardo, as i told you before, you have a slack in demand. this is not a supply side problem-if it were then low interest rates would spur the economy to no end. this is not what is happening. you need to rethink your model.
M2+ and large time deposits less Fed-funded bank cash assets is contracting yoy for the first time since 2009 and the 1930s.
Bank net interest from assets is growing in excess of the change of GDP from a year ago, which is historically recessionary.
TBTE banks directing the Fed to continue the unprecedented bank reserve crediting is resulting in further decline in the multiplier and velocity, with the stock and corporate bond bubbles further exacerbating the decline in velocity, misallocation, and GROSS mispricing of risk assets.
The US (and developed world) is closer to Japan- and 1930s-like deflation than most realize.