Contractionary fiscal policy is … contractionary
There has been some dispute over the robustness of the finding that countries that embarked upon fiscal contraction experienced lower growth. There’s also been some dispute over the proper time horizon (I used 2010-12 in this post.) Here I provide some additional information.
First, here is the entire sample of advanced countries (as defined in the IMF’s World Economic Outlook), for cumulative growth rates 2009-13 plotted against cumulative change in the cyclically adjusted budget balances. Note the statistically significant negative relationship, indicating that the more contractionary the policy stance, the slower the growth.
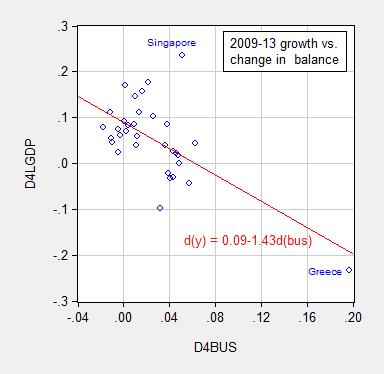
Figure 1: Cumulative growth rate 2009-13 versus cumulative change in cyclically adjusted budget balance as a share of potential GDP, for all advanced countries (IMF WEO definition). Source: IMF, World Economic Outlook database (October 2013).
The slope coefficient is negative, and highly significant, with the adj-R2=0.39.
Second, it’s clear that eurozone countries are a special case, where monetary policy is out of the control of the individual countries; a question is whether countries with their own monetary policy could actually experience an expansionary fiscal contraction. Figure 2 illustrates the same relationship, excluding euro area countries (and Singapore, which is an outlier, even in the full sample).
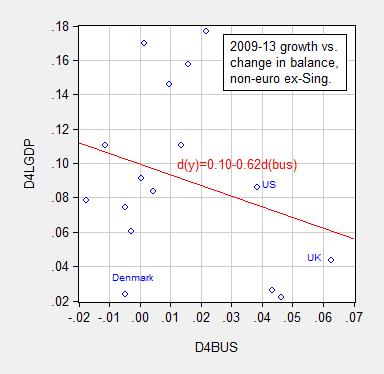
Figure 2: Cumulative growth rate 2009-13 versus cumulative change in cyclically adjusted budget balance as a share of potential GDP, for all non-euro advanced countries (IMF WEO definition), ex.-Singapore. Source: IMF, World Economic Outlook database (October 2013).
For the non-euro area group, the regression coefficient is less negative, and is only significant at the 17% marginal significance level. There is one question whether Denmark belongs in the non-euro area, as it pegs to the euro. Dropping Denmark, the slope coefficient falls to -0.82, significant at the 8% msl (adj-R2 = 0.09).
I have also run the regression using primary structural budget balances to GDP (not potential GDP) for the available countries (including Denmark) from the IMF’s Fiscal Monitor Appendix Table 1; I obtain a slope coefficient of -0.86, significant at the 8% msl. I discount these regressions somewhat because GDP (the denominator in the budget-to-GDP variable) is highly endogenous to the change in the numerator.
[Added 1/21 3:30PM Pacific; thanks to Mark A. Sadowski for pointing out the alternative FM data]I have also run the regression using primary structural budget balances to potential GDP for the available countries from the IMF’s Fiscal Monitor Appendix Table 2; I obtain a slope coefficient of -1.86 for full sample, -1.10 ex.-Greece (both significant at 1% msl, latter adj.-R2=0.22. Excluding the euro area, I obtain a slope coefficient of -0.58, significant at the 18% msl (using White SE), adj.-R2=0.02. For the ex.-euro area, ex.-HK, ex.-Singapore sample, the slope coefficient is -0.85, significant at 1% msl with adj-R2 at 0.30.
Clearly, other factors besides fiscal policy can affect output — monetary policy, supply shocks, financial policies, exogenous export demand shocks, such as ones that hit Singapore. But interestingly, the negative relationship still shows up in these bivariate regressions.
However, other studies have controlled in a more sophisticated manner for exchange rate regimes, openness, debt levels, and also come to the conclusion that contractionary fiscal policy is … contractionary. I’ve reviewed some salient papers in this post. Yet more discussion of some of the additional nuances can be found in the posts under the multiplier category. See this New Palgrave Encyclopedia of Economics chapter for an examination of why one would expect to see relatively large multipliers in the current economic conditions of ZLB and excess capacity.
I take the general point. There has also been some confusion and some obfuscation about what austerity is.
Example: British spending went up in some areas – due to increased social spending requirements – but public investment spending was substantially reduced. I would regularly read British conservative (and conservative commenters) remarks to the effect that there was no real austerity – see, we’re spending! – and now a general acceptance that maintenance spending is not the same as investment spending.
Another, even more complicated example is the shift of resources to the financial sector. So Ireland guaranteed – why??? – all bank obligations and that has been a near black hole. To make up for that, money has been shifted into the hole – same across Europe – but you get people arguing “this isn’t austerity” because bank takeovers, actual or in all but name, are an expansion of the state. I find this a weird topic: the people of these countries don’t see this as expansion but as contraction of what they have in favor of bailing out the creditors and the bankers. It seems almost perverse to argue helping bankers is somehow not austerity, as though the wealthy bonus crowd and the bond holders were ordinary citizens.
http://www.nber.org/papers/w19823#fromrss; where’s all the braying about how stupid these people are – and the graduate students pointing out silly spread sheet mistakes?
Hi Menzie, a good way to evaluate the complex, general equilibrium, direct and indirect effects of fiscal measures is using an open-economy macro model. I use such an approach in a recent (forthcoming) study to show that for the euro area, 1/ contractionary fiscal policy is indeed contractionary ; 2/ that the contractionary effects are state dependent, i.e. the effects are a function of e.g. the output gap and monetary policy; 3/ tax hikes have less negative effects than spending cuts affecting, e.g., public employment. I also find that by far the best way to reduce debt ratios is by raising (somehow) trend labor productivity growth through some type of “structural reform”, although it is clear that economic growth is very far from being a policy variable!
Menzie wrote:
Contractionary fiscal policy is … contractionary
Menzie, an excellent observation. Let’s look a some contractionary fiscal policies.
1. Tax increases – reduce investment in the productive economy causing contraction.
2. Deficit spending – wasteful of resources and commodities that the broad demand of the consumers, market demand, would have more efficiently allocated causing contraction.
3. Crony socialism – government policies that give money to unproven and questionably viable technology such as green energy which ultimately go bankrupts with the executives and politicians walking away with millions (billions anyone) causes contraction.
4. Democrat socialized medicine – forcing those with perfectly good insurance out of their policies into worse policies with higher deductibles and higher premiums causes contraction.
That is a few. I am sure others can find others. Good point Menzie!
*notes the graph is plotted against “potential” GDP*
*ignores it*
your first plot relies totally on just one outlier: Greece
It is well known, that their government fudged the numbers,
Some IMF Blanchard got ridiculed for doing some similar arguments with his multipliers, e.g. by Gavyn Davies of the FT.
You don’t know data analysis, you don’t know about the countries you are talking, and you dont read the press
genauer: Did you even read the post? Figure 2 omits Greece (in fact all euro area countries). If I replicate Figure 1, omitting Greece, I still get a negative and significant coefficient. Jeez!
I did read the post
How about you fit a parabola into your Figure 2?
peaking at x=0.02, y=0.18
eye balling y = 0.18 * (1 – 0.5*(x /0.02 – 1)^2 )
Should give you an R^2 of about 0.5 gut feeling
your R^2 of 0.09 is just noise
Most conservatives agree that GDP will increase if stimulus increases (obviously, since GDP includes government spending). However, people want to get bang for their buck, and stimulus has not provided this in any way shape or form. If $1T is spent, there will be at least a few people that become employed as a result of the spending, but to make it worth it has to be a HUGE amount of people that go off of unemployment. And this has not occurred due to stimulus in a very long time (let’s say 50 years).
This is so confusing. Changing transfers is neither contractionary or expansionary. Anyway the transfer multiplier is nowhere’s near 1 (or even positive). Only changes in real spending on goods and services are contractionary/expansionary. I suspect most of the changes have been in transfers. Please clarify? Seems like you are confusing taxes v. debt (the ill named “budget balance”) with what should be Keynesian style fiscal measures, real spending. Lowering real spending would be austerity to most macroeconomists.
ricardo, your list is wrong as follows:
1. Tax increases do not always reduce investment and cause contraction. in todays environment, excess cash is being saved in very low interest rate vehicles and not being productive because those vehicles are funding small amounts of loans. so a tax which is then spent circulates through the economy-and does not sit in a savings vehicle. this is not contractionary.
2. “Deficit spending – wasteful of resources and commodities that the broad demand of the consumers, market demand, would have more efficiently allocated causing contraction.” In light of the horrendous financial decision making in the private sector in the runup to the great recession, it does take balls to say those same folks more efficiently allocate resources! reality check in your ideology.
3. crony socialism. I think you mean crony spending. and the defense department would be example number 1!
4. have you been forced out of your health insurance? you are completely miscategorizing the effects of obamacare to further your agenda. most people have been able to remove the threat of health care induced financial ruin by actually obtaining good health insurance. this will have an expansionary effect. no insurance produces uncertainty and contraction.
Menzie,
First of all thanks for doing this post. I truly appreciate the fact you separated out the non-euro countries and changed the starting and ending dates.
Now for some comments on this post.
1) My results for graph #1 are identical. But as genauer and you have already discussed, Greece is an outlier. Dropping Greece lowers the adj-R2 from 0.39 to 0.08, the msl rises from 0.0% to 6.5% and the slope coefficient rises from (-1.43) to (-1.00).
2) Greece is also an outlier in the euro only group. Excluding it and doing the same sort of analysis produces an adj-R2 of 0.33, an msl of 1.4% and a slope coefficient of (-1.56).
3) In graph #2 my results are identical except that I’m coming up with an msl of 29%. (The adj-R2 is 0.13.) Similarly, dropping Denmark produces identical results except that the msl is 15%. (With regard to the msl I wonder why our results are so different. I assume it must be me.)
4) The following passage leaves me puzzled:
“I have also run the regression using primary structural budget balances to GDP (not potential GDP) for the available countries (including Denmark) from the IMF’s Fiscal Monitor; I obtain a slope coefficient of -0.86, significant at the 8% msl. I discount these regressions somewhat because GDP (the denominator in the budget-to-GDP variable) is highly endogenous to the change in the numerator.”
By “structural” I assume you mean “cyclically adjusted”. The cyclically adjusted primary balances (CAPB) in the IMF Fiscal Monitor are measured with respect to potential GDP, not GDP. Furthermore I thought this was always the case by definition for cyclically adjusted balances. What am I not understanding?
5) I still think doing this in terms of NGDP instead of RGDP is very important, as it eliminates variation due to shifts in aggregate supply. Redoing the second graph in terms of NGDP also enables us to keep Singapore as it is not an outlier in terms of NGDP growth. This results in an adj-R2 of (-0.05), an msl of 66.7% and a slope coefficient of 0.35.
6) I don’t think there is any problem including Denmark in the non-euro set because the whole point of separating out the non-euro countries is in my view to look at a set of countries with independent monetary policies. However, I still think keeping Hong Kong in this set is incorrect as it is pegged to the US dollar. Eliminating Hong Kong and replacing Denmark with the Euro Area as a whole (and using NGDP) results in an adj-R2 of (-0.07), an msl of 98.3% and a slope coefficient of (-0.02).
Mark A. Sadowski: First, an apology. I didn’t see Appendix Table 2 in the IMF Fiscal Monitor, and so used the primary cyclically adjusted balances to GDP ratio in Appendix Table 1. Second, I’ve rerun the regressions using the primary cyclically adjusted balances to potential GDP ratio. In all my cases, I obtain a significant and negative coefficient; the exception is the non-euro ex-HK grouping, in which case I get a significant coefficient at the 18% msl. Yet, excluding the outlier of Singapore, I recover the statistically significant coefficient. So I really think the negative relationship is there.
Side note: I calculated growth rates as log differences.
genauer: I can get a much higher adj-R2 fitting a 4th order polynomial in budget balance than a 2nd order one…by the way, running the regression of Figure 1 and omitting Greece still gives me a highly significant negative coefficient. I did not see you respond to that finding.
Since some posters seem quite exercised over Greece as an outlier, I suppose Menzie could have bounded the influence (as opposed to excluding) potential outliers via DFFITS or DFBETAS corrections, which are options in Eviews.
I’m still a little miffed over the concerns about the supposedly low adj-R-squares. Back in the day I was always taught not to pray to the R-square god.
Menzie Chinn,
1) On the previous post I was using ratios for the growth rates and Excel. When I saw this post I switched to logged differences for the growth rates and to Eviews.
2) I figured why our msl have been different. You are using White standard errors. Thus I shall use them as well.
3) Using White SE the msl for the entire non-euro group (with Singapore), using CAB and NGDP instead of RGDP, is 69.3% instead of 66.7%. Using White SE the msl for the non-euro group without Hong Kong and substituting the entire Euro Area in place of Denmark, using CAB and NGDP instead of RGDP, is 98.4% instead of 98.3%.
4) The primary balances in Table 1 of the IMF Fiscal Monitor are not structural. Incidentally in case you are not aware of it, the data for the Fiscal Monitor can be downloaded in Excel format (with more significant figures). At least we are now on the same page with respect to CAPB (Table 2).
5) For the non-euro group without Singapore and Hong Kong, using CAPB and NGDP instead of RGDP, the adj-R2 is (-0.07), the msl is 80.1% (using White SE) and the slope coefficient is 0.15. So obviously using NGDP instead of RGDP makes a huge difference. An examination of the respective scatterplots reveals that the negative slope in the RGDP result is mainly being driven by Iceland and the UK. Both of these nations suffered large reductions in labor productivity growth in 2009-13 when compared to 2005-09. Thus the RGDP results are being driven by negative aggregate supply shocks. This is why it is so important to measure the impact of policies meant to impact aggregate demand by actually looking at aggregate demand (NGDP) and not real output.
6) For the entire non-euro group, using CAPB and NGDP instead of RGDP, the adj-R2 is (-0.07), the msl is 96.4% (using White SE) and the slope coefficient is 0.03. For the non-euro group without Hong Kong and substituting the entire Euro Area in place of Denmark, using CAPB and NGDP instead of RGDP, the adj-R2 is (-0.07), the msl is 85.4% (using White SE) and the slope coefficient is (-0.12).
I guess that I hit a nerve reminding folks that Keynes was talking about real spending, not transfers. Wow. Amazing how this fundamental stuff gets stifled in these blogs. I guess the SEIU has long tentacles…they certinly have their hooks into Dean Baker. So sorry that modern econ folks like Menzi, who otherwise seems pretty clear, cannot make the necessary adjustments and appologies. It would make his arguments more appealing if proper economic thought was followed instead of this arbitrary mix and match method.
Menzie,
1. My words were a little harsh and my criticism is actually directed at the vast majority of American Economists, and not just you.
2. For people coming from natural science, a R^2 as low as 0.1 is simply showing the need to look at the other 90% influencing it, so I thought with mentioning the 0.09 , I am done with.
3. The same goes for arbitrary fits of higher order polynomials, as long as there are no good reasons for it, it just shows that the underlying mechanisms are not understood, and my parabola suggestion was a joke not coming across, apparently
4. Even if one understands nothing of the problem, eliminating an outlier like Greece from the data analysis is an obvious must, as long as there is no well discussed reason to keep it.
5. what we see here in Europe is, that most of the American economics discussion is far removed from the real world here.
Trying to make this pretty hard statement somewhat understandable:
Take as an example a Greek government employee, earning 19 Euro/hr for e.g. torturing new business startups with bureaucracy. His salary adds to the GDP number, although it doesn’t produce anything, he actually inhibits real GDP which would be produced.
Lay this guy off, and after some time he accepts a job in Tourism for 9 Euro/hr. The result is a permanent GDP reduction of 19 – 9 = 10 Euro /hr in accounting.
The difference is also a reduction of 19 E/hr in government deficit, and an increase of the current account by 9 E/hr, hyper simplified of course
6. No other country in the world than the US has the exorbitant privilege of providing the reserve currency, maybe the UK a little bit. All others have to care about their credibility, and that is dependent on your net foreign debt and changes, and your government debt and deficits. And the believe of creditors, international and local, that your political system has control and guarantees pay back, in full and on time.
7. And based on that, Greece, Portugal, Ireland had already lost market access for credit, had to apply for massive IMF / Euro rescue programmes, and Spain and Italy came close. This is a completely different situation to your fine tuning of a little more or a little less government spending.
To help you and your readers a little bit with understanding the situation, here is the link to the
8. imbalance assessments in Europe
http://epp.eurostat.ec.europa.eu/portal/page/portal/macroeconomic_imbalance_procedure/indicators
Government balance is not part of it.
9. access to cheap credit
As long as Euro countries follow the plans and take their medicine, they have access to 1.5 % interest rate 30 year loans, guaranteed by their stronger neighbors, who run 7% current account surpluses
http://www.spiegel.de/wirtschaft/soziales/krise-in-griechenland-euro-krisenmanager-regling-widerspricht-athen-a-942029.html
10. multipliers
a) if money is invested in a new factory, you typically need 3 Dollar invested for 1$ output per year generated, and that has a lasting GDP impact for many years to come. Multiplier 1/3, for many years
b) if you have an existing factory sitting idle for some missing spare parts, minor repairs, and some startup material needed, like with the Marshall plan after WWII, your lasting multiplier is much higher, 1, 3, maybe even 10 in the first year
c) if you run governemt deficits to finance spending, your first year multiplier is 1, and much closer to ZERO in the subsequent years, but the debt stays.
genauer: Re, your item 2, see Jim Hamilton’s post, on the R-squared fetish.
Re item (3), sorry I didn’t catch the humor. My fault.
Re item (4), shouldn’t one have a good reason for dropping outliers? If it’s not a data transcription error, I think one should think about the entire sample, as a starting point.
Re item (5), you are asserting GDP is a bad measure of real output. OK, but it doesn’t get at the point that contractionary fiscal policy contracts measured GDP, which is my point.
On item (6), exorbitant privilege — don’t you find it interesting that UK, which you acknowledge as having some exorbitant privilege — experienced such a different outcome from the US when it implemented…contractionary fiscal policy?
On item (7), I agree that the GIIPS (ex Italy) had lost market access — but that doesn’t mean that contractionary fiscal policy is expansionary. The channel — lower interest rates — only came about when Draghi’s ECB came in.
Item (10) — where in the world do these multipliers come from? A DSGE, a VAR, or just out of thin air?
“There has also been some confusion and some obfuscation about what austerity is.
Example: British spending.”
Let’s suppose a government, instead of borrowing money with bonds and spending it, offers guarantees to private citizens which induces them to spend, guarantees which will probably cost the state multiple billions in the future. Now I guess that’s not the Keynesian idea of stimulus (look ma, no bonds!), but the cash flows in the present and the future are the same (spending now, government needing to pay back money in the future). So in my eyes that is stimulus, and that my friend is exactly what the UK government is doing wrt its guarantees for housing loans.
In Argentina, expansionary policies are expansionary!
@ anonymous
expansionary in deed, going from 5 $ to 8 today in just one year, but the official inflation rate is at 10%
http://finance.yahoo.com/q/bc?s=ARS%3DX+Basic+Chart
@ Menzie
I was wondering how I would put that into the limited space of a blog, and I am working on it.
An R^2 of 0.997 shows you also, that you do something wrong, this doesn’t happen with economic data, you are basically just proving 1 = 1,
or that somebody is actively managing it.
Solow 1957 did this as well, he still got a Nobel price : – )
Maybe some folks want to find out for themselves first?
For today, just an example, where a little bit of local knowledge can go a long way in explaining 90% of the variation
http://worthwhile.typepad.com/worthwhile_canadian_initi/2013/12/living-longerand-longer-1.html#more
while I am working on some politically correct, but true answers to the rest : – )
genauer: I just told you how to get an R-squared of 0.997 with economic data, namely, regress the level of the S&P500 this month on a constant and the level the previous month. I also provided a link to where you can download the data. If you know how to run a regression, you can try it yourself and see.
I infer that you don’t know how to run a regression, yet nonetheless deem yourself a high authority on what their results mean.
Food for thought on whether NGDP or RGDP makes the more appropriate dependent variable.
Given:
1) For the non-euro group without Singapore and Hong Kong, regressing RGDP on CAPB, the adj-R2 is 0.30, the msl is 0.2% (using White SE) and the slope coefficient is (-0.85).
And:
2) For the non-euro group without Singapore and Hong Kong, regressing NGDP on CAPB, the adj-R2 is (-0.07), the msl is 80.1% (using White SE) and the slope coefficient is 0.15.
It should come as no surprise that:
3) For the non-euro group without Singapore and Hong Kong, regressing the GDP implicit price deflator on CAPB, the adj-R2 is 0.07, the msl is 14.6% (using White SE) and the slope coefficient is 0.70.
If aggregate supply shocks are not affecting the results in #1, then by what coherent mechanism does fiscal consolidation cause the rate of inflation to increase in #3?
P.S. Another good reason to exclude Singapore is the fact (hitherto unknown to me) that the IMF classifies Singapore’s exchange rate regime as a “composite exchange rate anchor”:
http://www.imf.org/external/pubs/nft/2012/eaer/ar2012.pdf
P.P.S. In R-squared’s defense, it’s possible to compute t-values from R-squared values. When all you have is Excel available, this makes it rather useful. Furthermore if R-squared is as useless as some seem to think it is, then it should be removed from the standard estimation output in econometric software. (It’ll never happen.)
@slugbaits,
In genauer’s defense, he wasn’t the first one to bring up outliers. Also, DFFITS and DFBETAS were not added to Eviews until version 7. (I only have version 5 and am quite content with it.)
1. @ Mark A Sadowski
It is well known, that Singapore is actively controlling its exchange rate.
If you pul exchange rates from yahoo SGD=X is Singapore, EUR=X the Euro, CNY (and I leave out the =X from here on) China, and USD per definition = 1 : – )
Up to End of 2009, the Correlation of 1 SGD = 1 EUR + 0.06 CNY + 0.32 (USD) was 0.989 : – )
In the next half year, they did a straight linear transition to same as above but only 0.17 USD in the basket, that worked precisely until mid of 2011, until they got cited in your reference, and they do it now a little less obvious.
Singapore deviates so much from nearly all other countries, that I would exclude it from most analysis on principle, IF not size weighted, and when I look for GENERAL dependencies.
Alone the Name “Greece” is sufficient reason to push immediately the delete button.
As late as 2013, the trade union of Greek statistics employees tried to get the boss of the statistics office into jail, for doing accounting according to the binding rules of the European Union, and not deciding the numbers per democratic vote of said union representatives.
(http://uk.reuters.com/article/2013/02/08/uk-greece-statistics-idUKBRE9170SO20130208)
This is not a joke or urban myth !
2. all
a) I would like to encourage you to just open up your spreadsheet program, put 2 columns of maybe about 10 data point with random numbers in , and then calculate the confidence parameter of your choice, r^2, correlation coefficient, whatever.
Reiterate that a few time and get a feel for how large you get some correlation just from noise.
b) Now keep further in mind, that the most Euro countries are economically tightly integrated, this is not an independent sample.
c) most economic data are significantly co-correlated over time, giving you very easily spurious fake interactions, especially if countries enter turn-around programs at different times
d) msl or similar numbers will often give you the illusion of significance, where there is none.
e) if exclusion of one data point, even if it is the US, changes the story substantially, I do not believe it.
3. @ Menzie
I did not come to this blog, to stink up the place, and you and Blanchard are certainly not anonymous nobodies, when I look at wiki, or ssrn.
That your data analysis deviates so much from what I see in other areas as common sense, was actually a kind of shocker to me.