From the Economist last week:
Since the financial crisis the European Central Bank (ECB) has ploughed a solitary course, reflecting its unique status as a monetary authority without a state. While other big central banks, notably America’s Federal Reserve, adopted quantitative easing– buying government bonds by creating money– to stimulate recovery, the ECB relied mainly on lowering interest rates and providing unlimited liquidity to banks on longer terms and against worse collateral. But as the Fed phases out its asset-buying programme in 2014, it may be the ECB’s turn to become unorthodox.
By one measure, the ECB may already be there.
I have earlier described research by UCSD Ph.D. candidate Dora Xia and University of Chicago Professor Cynthia Wu that can be used to characterize the dynamics of the term structure of interest rates and policy actions taken by the Federal Reserve over the last five years. Their approach is based on the idea that there are some latent factors that determine changes over time in interest rates of different maturities. The dynamics of these factors follow simple linear equations. During normal times the overnight interest rate is a particular linear function of these factors. The idea is to continue to use that same linear function through the recent episode, even though that calculation in today’s environment turns out to produce a negative number. That number, which corresponds to the overnight interest rate when it is positive, but can still be calculated even if negative, is referred to as the “shadow” short-term interest rate in this class of models. The actual overnight interest rate is the maximum of the shadow rate and a positive lower bound on interest rates. Arbitrage conditions (expected returns and risk should be priced consistently across assets) can then be used to calculate current implied values or to forecast future values for any interest rate of any maturity. The Wu-Xia model does a very good job at describing the recent U.S. data, and their series for the shadow rate offers a useful way to summarize the effects of some of the unconventional policy measures adopted by the U.S. Federal Reserve over the last several years.
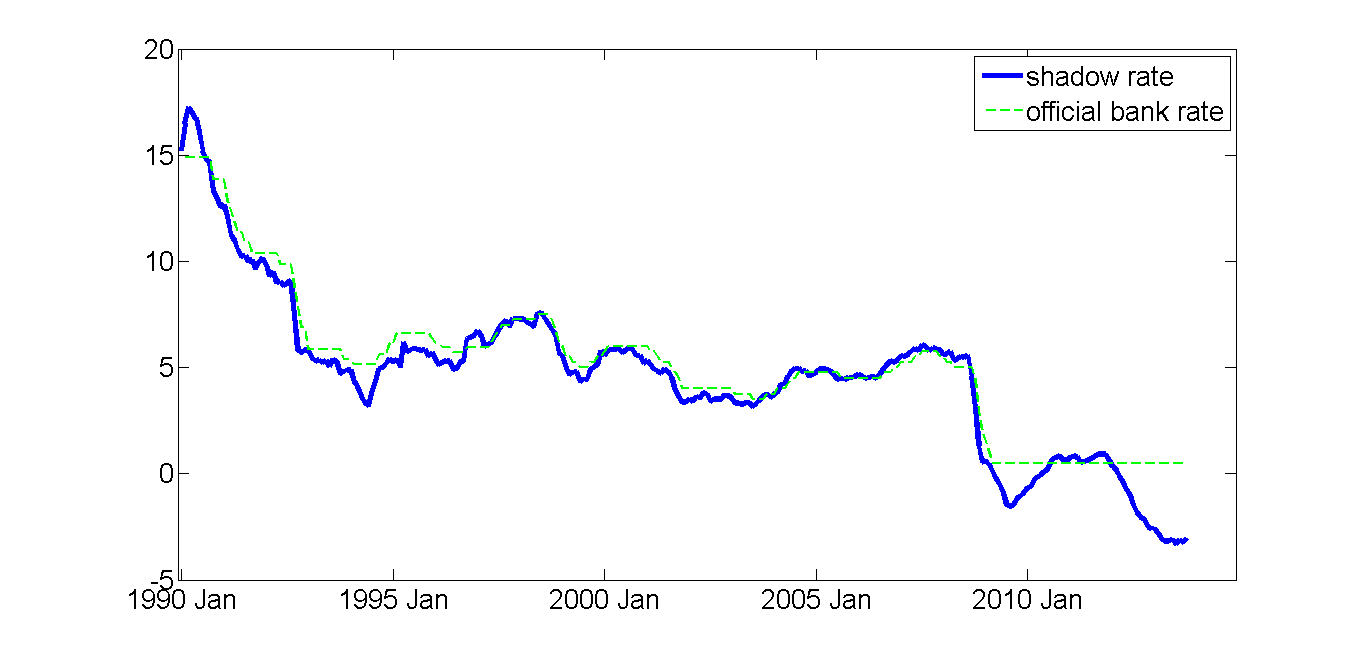
Wu and Xia have recently extended their approach to calculate implied shadow rates for the U.K. and the euro area. The shadow rate for the U.K. plunged into negative territory after the Bank of England implemented its quantitative easing policy in March of 2009.
|
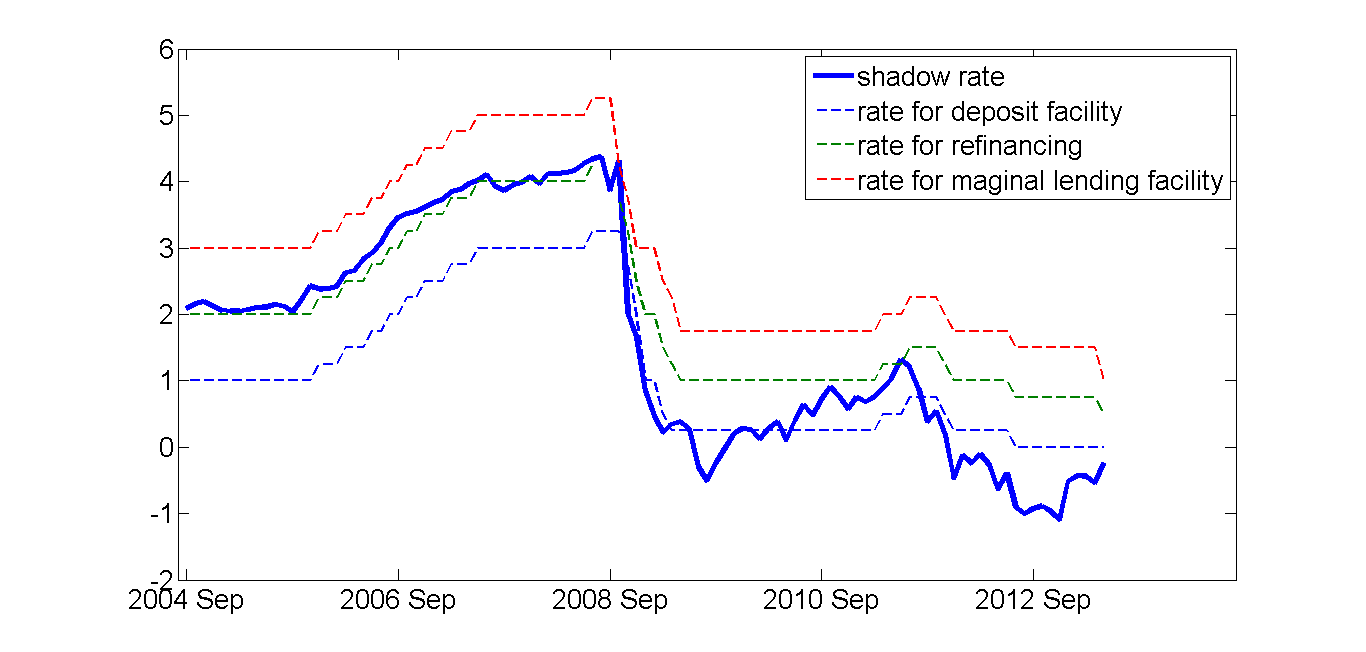
Interestingly, the ECB’s shadow rate moved into negative territory with the expanded longer-term refinancing operations (LTROs) in December 2011. The euro shadow rate saw a subsequent drop with ECB President Mario Draghi’s July 2012 commitment (and September 2012 follow-up bond purchases) to do whatever it takes to preserve the euro.
|
These new series can be a useful tool for updating models that have been fit to historical values for the fed funds rate for the U.S., the Bank Rate for the U.K., or the ECB refinancing rate. Research at the Federal Reserve Bank of Atlanta illustrates the promise of this approach. The Wu-Xia estimates of the shadow rate for the U.S., U.K., and euro area are
regularly updated online for anyone to use.
Professor Hamilton,
Can you help us “slow boats” a bit? Is the main significance of the Xia, Wu calculations to show that rates are in fact negative and thus policy is working to avoid an interest rate liquidly trap?
AS: In the old days, we would look at the fed funds rate as the number that summarized what the Fed is doing, and report whether the Fed chose to raise the fed funds rate (tighten) or lower the fed funds rate (loosen) after a given FOMC meeting. The fed funds rate used to function for that purpose, but doesn’t anymore, because the funds rate can’t go below zero. But the Fed is still making decisions to tighten or loosen using unconventional tools. The suggestion is that you might look at the shadow rate the same way you used to look at the fed funds rate for a simple summary of where the Fed (or the Bank of England or the ECB) is pushing things by use of unconventional policies such as large-scale asset purchases, forward guidance, and LTROs.
Professor Hamilton,
Thanks. I guess I should have reread an earlier post that you made on December 15, discussing the fed funds rate. As I said a little slow here.
what a fascinating paper! Here are some questions in regard to the shadow rate in the US, can anyone provide me some insights on them?
1. The Fed fund rate in Dec.,2013 is even more negative that what it was in Nov., 2013, does that imply the Fed’s policy was more loosening though the Fed cut its asset purchases by $10 billion in December?
2. To some extend, the current term spread is distorted by the Fed’s unconventional policy, so I was wondering if I can use the implied shadow rate to calculate term spread ? thanks
Sheldon
Sheldon: My view is that the Fed more than fully countered the tapering announcement with a very clear communication that it is going to keep the short-term rate close to zero for a long time, and the market believes that. Hence the announcement of the taper was associated with a decrease, not an increase, in the shadow rate. As for interpreting the long rate minus the shadow rate as the current spread, I would want to see more research on that question before treating this series that way.
Since 2012 I have been pointing out that the FED balance sheet increases have flattened out. Ever since the FED stopped expanding its balance sheet the US economy has been showing signs of recovery.
If you look at a graph of the ECB balance sheet you will see a spike starting at the end of 2011 and running through late 2012. This period was perhaps one of the most rocky for the ECB with crisis after crisis. In 2013 the ECB balance shee took a steep dive and Europe began to see a recovery growing.
If we evaluate economic conditions honestly economic recover in the US and the ECB begins to show signs when the FED stops expanding the greater money supply as represented by the balance sheets.
It is also interesting that the price of gold fell when the US and ECB balance sheets both stabilized or fell. Many people who comment on gold have made much about the recent decline in the price of gold. Most are ignorant of what the actually means. The 10 year average price of gold is around $990. The price of gold is currently between $1,200-$1,250. With the recent return of increases in both the US and ECB balance sheets, with the ECB statements of increasing the monetary quantity and the confirmation of Janet Yellen there is a good chance that gold will return to its upward trend and that the economies of the US and Europe will once again sputter as they drown in liquidity.
It cannot be possible in a good society to suppress the visible market rate below the Wicksellian natural rate to any good end. Only an emergency permits suspending this fundamental principle of natural economics. A grave emergency arose in late-2008 when the entire global financial system was in jeopardy of collapse. That state of emergency has long since passed. Society’s rate of time preference cannot fall below zero, and in practice it is highly unlikely to ever get to zero. Behavioral economists like Kahneman need only perform experiments or do a large scale study of the population to verify this. Indeed for any reader of this blog, if I a baker with a shop only a few steps away from your doorstep offer you a choice of two loaves this evening or one loaf this evening, one tomorrow evening, and one the following evening (total of three) for an upfront dollar, the choice is certainly going to be toward the latter. What are the explicit and hidden implicit assumptions of this paper? Do they accord with reason in the spirit of full disclosure? Full disclosure would include a comprehensive listing of the many unintended consequences of suppressing the visible rate to zero (ZIRP). Thus far, this real-world blog has studiously evaded any post on this top-line subject of unintended consequences which prima facie must enter into any truly scientific analysis of these issues.
James, thanks for the interpretation! I am looking forward to hearing from you in terms of that spread thing! thanks again.
I still can’t believe the ECB raised rates in late 2010. I feel like a first semester econ major could explain why that’s a terrible idea.
The Fed works in the future economy, because of lags in the adjustment process. So, it begins tightening the money supply before economic growth picks-up.
Here’s what Bob Brinker said about the Fed (Dec 2012):
“It’s only because the Federal Reserve has been active that we have any growth at all in the economy….The Federal Reserve is the only operation in Washington doing its job.
The only person that would criticize Ben Bernanke would be a person who is so clueless about monetary policy and (the) role of the Federal Reserve as to have nothing better than the lowest possible education on the subject of economics….Anybody going after Ben Bernanke is a certified, documented fool….”
ricardo,
“If we evaluate economic conditions honestly economic recover in the US and the ECB begins to show signs when the FED stops expanding the greater money supply as represented by the balance sheets.”
or is it possible the economy showed signs of recovery, which led to the FED not needing to continue to expand its balance sheet? ricardo I think you have your cause and effect mixed up!