Somewhat of a surprise, nonfarm payroll employment increased only 74,000 in December, according to estimates from the BLS. Private NFP increased 84,000.
The number was somewhat surprising given the high private NFP numbers released by ADP on Wednesday. On the other hand, anybody with an acquaintance with the BLS data knows that the series is subject to some considerable revision (not even taking into account benchmark revisions). Over the 2003-2013 period, the mean revision going from the first release to the third is 12,000, while the mean absolute revision is 46,000.
Second, with the January employment situation release (in early February), the NFP series will be benchmarked-revised. Based on the preliminary benchmark revision, the series will be revised upward approximately 235,000.
Taking these two obserations into account, one can see what the overall establishment picture looks like.
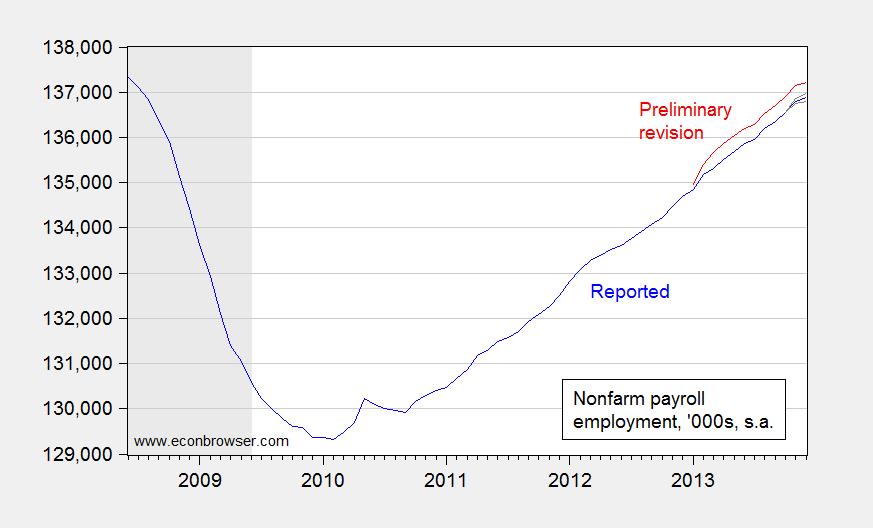
Figure 1: Nonfarm payroll employment (blue), predicted benchmark revision based on preliminary benchmark revision of March 2013 (red), and plus/minus 2 mean absolute revision bounds for 2013M12 first release and 2013M11 second release (gray). Source: BLS via FRED, BLS, BLS, NBER, and author’s calculations.
In other words, one shouldn’t take the exact number to heart; upcoming month-to-month revisions plus the shift in the level associated with the benchmark (due to more complete tax data) will likely mean a substantially altered number come next month.
Other takes on the release, from Furman/CEA, Stone/CBPP, McBride/CR, Ip/Economist FE Shah/WSJ RTE, Morath/WSJ RTE, and Izzo/WSJ RTE
Update, 1/15, 10AM Pacific: Reader Jack Coupal asks if “somewhat of a surprise” was a typo on my part. The answer is no, given the magnitude of the typical revisions, depicted by the plus/minus two mean absolute revisions (1st-3rd). Further discussion in this WSJ RTE post by K. Madigan:
Since late 2010 (after hiring for the U.S. census skewed the payrolls numbers), the consensus forecasts have overshot the initial payroll change by a large margin (more than 80,000) on eight separate occasions. On average, the forecasters thought the payroll change would by 98,000 jobs higher than the Labor Department reported initially.
When the final revisions came through, however, the average miss shrank to 56,000. In only one case, May 11, was the final number actually worse than the initial print, and that was only by 1,000 fewer jobs. If December’s revisions follow the average, the Labor Department eventually will say payrolls were up 130,000 slots last month. That’s still below the expectations of 200,000 but not as head-turning as last Friday’s disappointment.
But unemployment number used for propaganda among the uninitiated 6,7% was achieved with little fuss thanks to USG/Congress/Senate/FED deal.
Amazing, i expected they will not rely on participation rate drop engineered by themselves so openly. Apparently, the need to support full taper and recapitalization of the FED is very very urgent. It shall all come together prior to debt ceiling and January NFP date of February 7th.
Expect reading below 6,5%. May be 6,2%.
How about Fisher nomination for FED VC? True internationalism or just need for really tight control over FED as plans enter execution phase?
Its really laughable how these CB owners openly place their Carneys Fishers etc in Western CBs. National interests? Or supranational interests rather. What a joke.
Any thoughts on the really big number of people listed as not working but having jobs because of the weather?
It’s too much for me to keep up with all the nuances. I’m usually content to look at seasonally adjusted and non and then at revisions, temporary hiring figures, etc. But not weather.
Was that an unusual factor in this report?
jonathan: Shah/WSJ RTE cites Morgan-Stanley estimates of 50-75K attributable to weather.
The reason I asked is this paragraph from Felix Salmon:
“Once you take into account the weather, however, the December report wasn’t that bad. A whopping 273,000 people were counted as “Employed – Nonagriculture industries, Bad weather, With a job not at work”, which is to say that they did not get counted in the payrolls figures even though they’re employed. Most of the time, that number is in the 25,000 to 50,000 range, and although it always spikes in the winter, this was the worst December for weather-related absence from work since 1977.”
I don’t know if that’s accurate, etc.
BTW, I misunderstood your response: you meant 50-75k drag on job creation. I figured that out.
“If I had a world of my own, everything would be nonsense. Nothing would be what it is, because everything would be what it isn’t. And contrary wise, what is, it wouldn’t be. And what it wouldn’t be, it would. You see?”
Welcome to Obama’s Wonderland.
Bruce Hall: And here I thought the world you write of was the world of people who think polls need to be unskewed, anthropogenic global climate change is a hoax, that the theory of evolution is bunk, technology shocks have been the main driver of business cycle fluctuations in the past decade, and that in a normal recovery, one should expect a sustained 500,000/mo increase in NFP.
This is interesting. Graphs at the link.
http://csen.tumblr.com/post/72901864550/the-labor-market-is-tightening-much-more-rapidly-than
Similar tightening for women as well.
Regards.
IMO when seasonal adjusting data, variability due to unusual weather should be part of that seasonal adjustment process, or in addition to the seasonal adjustment process. That we still fail to do this is mystifying to me. We seasonally adjust December retail employment down because of heavy holiday shopping, but don’t adjust December construction employment up because of unusually cold weather. Duh, Duh, & Duh.
“The labor
force participation rate declined by 0.8
percentage point over the year, while the employment-population ratio was unchanged.”
The NYTimes is tooting your horn but not mentioning your name in this article, at least as far as a quick skim can determine.
http://www.nytimes.com/2014/01/13/us/twinned-cities-now-following-different-paths.html?hp&_r=
Time for another post on the two states?
dilbert dogbert: Thanks — I will post something on the divergence in per capita GDP in the two states later today. I don’t visit Minnesota very often, but the retrogressive nature of some policies implemented in Wisconsin does stand in stark contrast to those implemented in Minnesota.
My understanding is that you can’t just add back the difference between the December average for “unable to work due to weather” and the most recent December “unable to work due to weather” because this series counts those who’ve missed a day of work due to weather. That’s not what is counted in the household or payroll survey. All we know from the large count of “unable to work due to weather” is that weather had a bigger impact than normal.
I’d guess that is also the answer to Bobk’s notion, as well. The average impact of weather is included in seasonal adjustment, without even trying. However, since we don’t have a good measure of the impact of unusual weather on employment, doing additional seasonal adjustment for extremes in weather isn’t possible.
In those months in the past where there have been serious weather issues, what has the following month looked like? One might assume that it is something like 75K + the normal trend line – which would imply an enormous number is coming in January – maybe 300K.
I remain surprised that no one has created a good model to predict the number using things like ADP, ISM, Planned layoffs, etc.
It is amazing just how bad the relationships are in economic variables. The R squared’s tend to be so low (see James Hamilton’s oil/GDP model) that in other contexts they would be disregarded.
bobk: I think kharris has it right. How do you assess “extreme”? Is it temperature differential, precipitation differential, and is the “extreme” a linear or nonlinear function of the differential (i.e., are there thresholds?). So it’s hard to account for “extremes” in a statistical fashion.
On the other hand, one can examine the predicted NFP using ADP and jobless claims, and then look at the residual and attribute that to extreme weather. This is what DB has done (email communication, not online), and come up with an estimate of 75K, in line with Morgan Stanley (cited above).
“Somewhat of a surprise,”
Menzie, did you really mean to write that?
Jack Coupal: Yes. Inspect the +/- 2 mean absolute error bands.
Menzie, I’m familiar with statistics in science but not in economics. So, I’m befuddled by the jargon here. Labeling the axes would be a start to help us non-economists understand. Also, absolute error bands must have a different meaning in science.
My initial post was only about the basic concept. With the combination of federal economic policies in place, no aspect of our economy is a surprise.
Jack Coupal: Well, I must confess this is pretty much the first time I’ve been flagged on Econbrowser for not documenting the graphs sufficiently. Well, the figure notes indicate that it’s a time series, and that variable plotted is nonfarm payroll employment. The text in the box in the graph indicates that the vertical axis is measured in 000’s; and that the series is seasonally adjusted.
If you had clicked on the BLS link provided in the notes to Figure 1, you would see the explanation of what a mean error and a mean absolute error (when defining the final revision as the actual, and the initial/advance release as the predicted) is. The bands are calculated using those estimates. A “standard deviation” would be an alternative measure of dispersion, but the mean absolute error is often used if one believes the distribution of the errors is non-Normal.
I hope this helps clarify what was done in the above Figure 1, and why I said that the initial estimate was somewhat surprising. In addition, you should note that November employment was revised up, so if one thinks of emphasizing the moving average rather than each observation, then once again, I was only somewhat surprised.
The gas and electric utility industries have weather normalized monthly sales for deviations from average temperatures going back to the 1960s. Why this can’t be done for the weather sensitive portions of employment such as construction is confounding to me? Take the average December heating degree days by geographic regions, say Federal Reserve districts, and weigh these temperature deviations by some reasonable weighting of employment by region, and a much better estimate of adjusted employment then gosh the data are high or low because the weather was off – we think, maybe. It’s not as if the seasonal adjustment process used w/o weather adjustment isn’t lame, because the SA process used by BEA is pretty ugly and certainly not best practice.
Every economist recognizes that a government imposed price floor for a product that is above the market price for the product leads to a surplus. If the government establishes a minimum price of cars at $25,000 it is not difficult to understand that there would be fewer cars sold.
Why is it that when it comes to minimum wage so many economists lose their minds?
bobk: Sorry, I would welcome your prescription for a better seasonal adjustment method, and the diagnostics you use to judge the algorithm to be superior, before discarding the standard method. This is a serious question.
Jack Coupal: Following up on your question, I have added an update to the post.
There are around 2 million fewer workers in the US today than in 2007. Do you still believe that the unemployment number is not being manipulated?
ricardo, if the population is growing and baby boomer demographics increase the number of people retiring, is that not possible? or you can keep looking over your shoulder for the guys in black suits…
Quote from MarketWatch.
“Construction on new U.S. homes fell 9.8% in December to a seasonally adjusted annual rate of 999,000, pulling back after a surge in November, with drops for single-family homes and apartments, the government reported Friday. Economists polled by MarketWatch had expected cold weather to take a toll on new construction and decline from a prior starts-rate estimate of 1.09 million for November.”
Well Heaven forbid we should adjust monthly data on housing starts and construction employment by accounting for deviations from normal temperatures. If we did that we would have better adjusted data and less hand waving after the fact, and we certainly don’t want that.