The U.S. federal deficit fell from around $1.1 trillion for fiscal year 2012 to under $700 billion for 2013, and is projected by the Congressional Budget Office to be below $500 B by 2015. Although it sounds like continuing improvement, the CBO’s projected path is actually unsustainable. Here’s why.
The first thing to understand is the difference between the federal deficit and the federal debt. The deficit is a flow variable, measured in dollars per year. Specifically, the deficit is the difference between the government’s spending on goods, services, transfers and interest payments over the course of an entire year and the revenues that the government takes in during that year. The $680 B/year U.S. deficit was half as big in 2013 as it had been in 2009. By 2015 the CBO is projecting that the annual deficit will be down to only a third of its 2009 value.
By contrast, debt is a stock variable that measures how much money the government owes at a particular point in time. If the deficit is positive, it means that the government spends more over the year than it takes in as revenue. In that case, the government wouldn’t pay back any of the debt it owed at the start of the year, so it would have to roll over that debt and still owe that sum at the end of the year, and in addition would need to issue new debt to cover the deficit during the course of the year. Thus whenever the government is running a deficit (regardless of whether it is a smaller deficit than the year before) the total level of debt is going to be higher at the end of the year than it was at the beginning. At the start of fiscal year 2012, the government owed $10,128 B. During that year, it spent $1,087 B more than it took in as taxes, and it ended the year owing $11,281 B, an increase in the debt of about 1.1 trillion dollars. During FY 2013, the deficit was $680 B, and we ended the year with a debt of $11,982, about 700 billion more than we started. The deficit is projected to continue to decrease further in 2014 and 2015, but the debt nonetheless will continue to climb.
A growing debt load can be offset by the fact that the U.S. economy should be bigger in 2015 than it is today. The CBO projections released last week expect U.S. real GDP to rise by over 3% a year for each of the next three years. As summarized by the table below, the CBO is a little more optimistic than some other forecasters, but their growth forecasts strike me as quite reasonable.
| year | CBO | SPF | FOMC |
|---|---|---|---|
| 2014 | 3.1 | 2.6 | 2.8-3.2 |
| 2015 | 3.4 | 2.8 | 3.0-3.4 |
| 2016 | 3.4 | 2.7 | 2.5-3.2 |
| after 2018 | 2.2 | — | 2.2-2.4 |
Given this anticipated growth in GDP, even though the debt is expected to increase every year, the economy is projected to grow even faster, so that the CBO anticipates that U.S. federal debt held by the public will decline modestly over the next several years when measured as a percent of GDP.
Interest expense is another variable to factor in. The U.S. Treasury’s net interest expense for FY 2013 was $221 B, or about 1.8% of the ending net debt level of $11,982 B. That low interest cost, despite the large debt load, is reflective of the fact that the interest rates at which the Treasury is currently borrowing are extremely low. The imputed average interest rate, 1.8%, is close to the 2.2% average yield on newly issued 10-year Treasury securities during FY 2013. Historically, you can get a good estimate of the number of dollars that the Treasury will spend in order to make its interest payments by multiplying the level of outstanding debt by the average 10-year interest rate over the year.
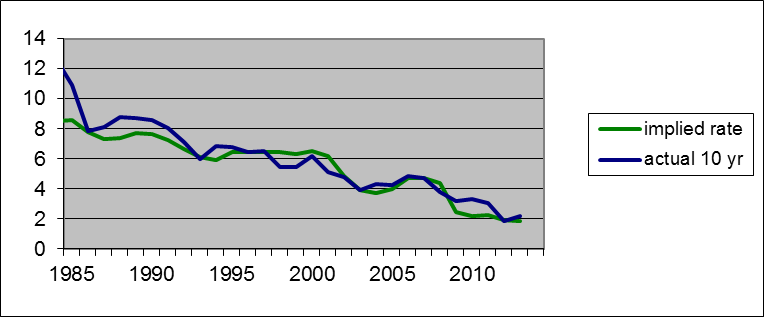
Green: U.S. Treasury net interest expense during fiscal year as a percent of net debt as of the year end. Blue: average yield on 10-year Treasury securities during fiscal year. Data source: CBO.
Low interest rates are the main reason that the net interest expense ($221 B) was so low in 2013 despite the high level of debt. If interest rates were to return to the average level of 4.5% that we saw over the last decade, it would mean that the Treasury’s net interest expense would grow to 2-1/2 times its level last year, even if we were to get the deficit all the way down to zero beginning in FY 2014 so that the level of debt never grew above where it was at the end of FY 2013.
The CBO, like most other forecasters, is anticipating that interest rates will rise gradually over the next several years. In addition, rising medical costs and an aging population are expected to bring the primary deficit back up in the near future. When the CBO put all these different factors together, their conclusion was that, despite the fact that the deficit is projected to shrink over the next two years, and despite the fact that the economy is assumed to experience above-average growth over the next several years, U.S. debt will resuming rising relative to GDP after 2017.

Source: CBO.
In the CBO’s forecast, the sum that the U.S. Treasury will be paying each year just to make the interest payments on the debt it’s already accumulated is projected to exceed the entire defense budget or the total of nondefense discretionary spending by 2021.
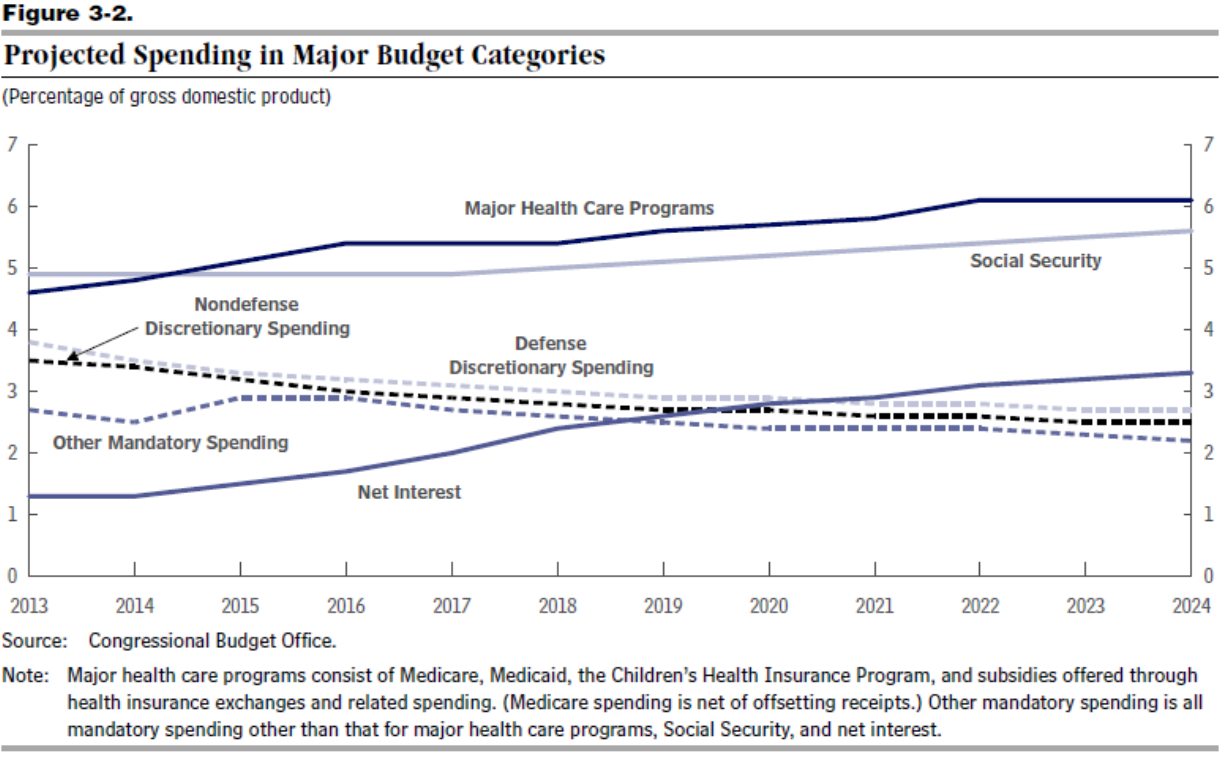
Source: CBO.
There’s no reason to think that the number of dollars investors around the world are willing to lend to the U.S. government would continue to grow at a faster rate than the economy itself. Something more has to give as you project this scenario forward.
It seems to me that the solutions are fairly simple: raising taxes in order to pay for the increasing cost of medical care, and raising the retirement age for social security to reduce the structural deficit and direct some of the benefits of that medical care towards the public purse.
An obvious candidate for a tax: a fuel and carbon tax, to internalize the cost of fossil fuel pollution and security costs. That would make our accounting reflect real costs, and allow our free market system to optimize it’s allocation of resources based on those real costs.
Nick, you are like the newspaper industry, declining circulation by increasing subscription rates.
Your solution is increased payments for failed systems rather that finding new and improved
solutions.
Tax, tax and tax some more and when that does not work, simply repeat the cycle…
hans,
have you figured out a good approach to minimize carbon and pollution? or stick with the failed approach of ignoring the problem?
solutions can work, look at how we dealt with the acid rain forests a couple of decades ago. but we had deniers back then as well…
One little difference between the two. Sulphur Dioxide is very acidic and generally harmful to everything it falls upon. Carbon Dioxide on the other hand is not only not a pollutant, it is the very foundational food used by plants to generate energy in a process called photosynthesis. You know what plants are right? The basic building blocks for all other life at the bottom of that thingy called the food chain that we sit on top of. That molecule you call pollution and want to tax out of existence is a fundamental requirement for life on Earth. I find that very puzzling. But never mind a complete lack of evidence for the last 17 years for any of the climate models or the fanciful theory behind their construction, it sounds noble to save the planet so let’s get on with it huh? Go ahead and deny my point of view and call me a denier of yours. The planet doesn’t care. I expect it will survive all your efforts to kill it.
hitchkiker,
sulpher dioxide is just like carbon dioxide-neither is an acid. they BOTH become an acid when mixed with that more common molecule, H20-or water for the less inclined. understand your chemistry before you lecture others. excess carbon dioxide acidifies the ocean-where it is readily absorbed. and how well will an acidic ocean support the ecosystem you are so concerned about?
of course, since you are soooo fond of carbon dioxide, why don’t you lock yourself into a room being filled with the factory output and see how long you last.
you say “That molecule you call pollution and want to tax out of existence is a fundamental requirement for life on Earth. ” that is a patently false statement. the argument is not to rid the world of carbon dioxide, but to keep its levels consistent with life as we know it. you are simply trying to make an exaggerated strawman argument. so yes you are a denier.
Hans,
Could you be more specific? I can’t really tell what you’re saying.
If you believe that fossil fuel is a “failed system”, then we agree. If you feel that newspapers are increasingly obsolete, and that they are similar to fossil fuels in that regard, then we agree. If you believe that taxing fossil fuels will decrease our consumption of them (like newspapers), then we agree. If you feel that healthcare is a “failed system”, then I’d be curious to hear your logic.
What should give is the total of military/defense/security spending.
Numbers FY2014 (which ends 6/30/2014): Total of $744.2B, which consists of f $744.2B, which consists of
Military: $612.4, which includes $91.9 for Afghanistan (Overseas Contingency Operations) and $520.5B for DoD
Plus Veterans Administration ($63.2 billion), Homeland Security ($39.3 billion), the National Nuclear Security Administration ($11.2 billion from the Energy Department), Military Construction ($9.8 billion) and the FBI ($8.3 billion from the Justice Department).
Jonathon,
Have you seen a good analysis of how much of that military/defense/security spending is due to the involvement of the US in the Middle East? I seem to remember that number jumped from about $300B just before 9/11.
How much of our accumulated debt is allocatable to military spending?
Gov’t receipts to GDP and Willshire 5000 Total Market Cap to GDP:
http://research.stlouisfed.org/fredgraph.png?g=rVs
Change rates:
http://research.stlouisfed.org/fredgraph.png?g=rVt
investors around the world are not “lending” to the US government…they are receiving Treasuries in payment for their exports to the US, and holding those Treasuries as a store of value…our Treasuries are not like a household’s debt that needs to be paid back; they function as money internationally, and any reduction of them would be contractionary like any shrinking of the money supply would be, and would risk putting the entire world into a recession..
rjs: No one in their right mind is expecting a fall in the supply of Treasury debt. The issue discussed here is a scenario in which the supply grows faster than U.S. GDP.
so currently we have low interest rate and growing supply of treasuries which are happily being purchased by us and the world-alternative options are riskier as they should be.
not sure if/when we will reach a situation where supply grows faster than gdp, coupled with investors not buying the treasuries? this could occur if/when treasury risk becomes greater than some other investment option-do you see this happening in the near or long term? even the significant increase of fed balance sheet and us debt has not caused an increase in interest rates or lack of demand-hence risk relative to other options remains very low. this has occurred in spite of the loud arguments from a sector of the population who said interest rates would skyrocket.
i would imagine the real issue is the duration to maturity of the treasuries and when they are rolled over. this is where the argument exists that today we should be issuing long term debt rather than short term debt. rising interest rate environment becomes a big concern if you are rolling over low interest debt into high interest debt. but high interest rates should also correspond to higher gdp-hence greater revenue and smaller yearly deficits?
out of curiosity, during the late 70’s and 80’s we had a burst of high interest rates which were assumed to be caused by high inflation-i was not a businessman then so apology for my ignorance. during that period of high interest rates, did the US still easily sell treasuries or was there an alternative, less risky asset to move money into?
During the late 70s and earlier 80s, everyone loved 6 month T-bills. Of course, we should have been buying 30 yr T-Bonds that were yielding over 14% for a while in 1981 & 82, but those were only for conservative investors. There was never a lack of buyers because the stock market was terrible in those days and real estate crashed.
it just seems to me we have never had a period in modern times where our debt became a burden of high interest rate due to lack of demand. and i am not sure if we are going to encounter a period where us treasuries are not considered the least risky investment, in the near future.
The CBO projections are overoptimistic for two main reasons.
One is a major flaw in the CBO’s methodology whereby it is required by law to base its forecasts on current law. Congress games that provision by putting into law bogus pending spending cuts or tax hikes and perpetually postponing them. For this reason CBO forecasts are inherently unrealistic beyond the current fiscal year. This situation has improved in recent years as Congress permanently fixed the Alternative Minimum Tax law, which used to provide for pending big tax hikes that were always postponed. However, big pending Medicare spending cuts that nobody believes will ever happen remain on the law books, and the CBO remains legally obliged to base its forecast on the assumption that those pending cuts will happen.
Another is over-optimistic GDP forecasts. Three years of c. 3.3% CAGR is not “reasonable”. Nobody honestly expects that, and those who say they do are either officials or salesmen. What’s more the long-run US average growth rate is well below 2.2%. The 2002-2013 CAGR was 1.8%. The 2007-2013 CAGR was 1.0%. To get a 2.2% CAGR you have to start at 1997 or earlier.
On the other hand, the CBO’s long-term interest rate forecasts are also almost certainly too high. They put them so high in line with their rosy GDP forecasts, because as mid-level bureaucrats they want to be certain they won’t be seen as talking down the economy. A look at Japan’s experiences suggests that long-term average US rates are as unlikely as GDP growth rates to conform to 20th century norms.
Another very important point, which the CBO takes into account but JDH leaves out, is how a rise in rates would affect the Fed’s payments to Treasury. Currently, a big part of the interest paid out by Treasury goes to the Fed, which owns a huge chunk of mostly long-dated Treasurys. The Fed returns most of that interest right back to Treasury, after deducting the Fed’s operating expenses and the interest it pays out on reserves. In effect, Treasury is paying a short rate, the IOR (0.25%) for much of its long-term debt. Similarly the Fed coughs up its mortgage and GSE debt income to Treasury, less operating costs and IOR. In FY13 the Fed paid $76b to Treasury. So Treasury’s true interest expenses, net of interest income on Fed-owned mortgages and GSE debt, were only $211b – $76b = $135b.
If and when interest rates rise, IOR costs will increase in line. A 3% IOR would be 12 times as costly as the current 0.25% IOR. Remember that the IOR is the rate that Treasury effectively pays on debt held by the Fed. Alternately, the Fed could sell assets, in which case the Treasury would roll the debt over to the public and pay a mix of short and long rates, averaging at least 100bp over IOR.
That explains why rising interest rates would very quickly expand the deficit and in a worst-case scenario throw the US into a classic debt spiral of falling confidence, rising rates, bigger deficits, further falling confidence, etc.
Which in my opinion argues against the likelihood of US rates getting very high before the next recession.
There seem to be two tools to handle the debt problem:
1. A weaker dollar policy. This would do little harm domestically (most of our trade is intra-country) since the deficit is shrinking. The balancing of capital accounts that would occur would generate additional government revenues.
2. A higher inflation rate. This decreases the implied value of saving and increases the implied value of current earnings. It is a mark to market concept, where old debt assumes the time discounted value of new debt. Sort of a bond death spiral, unless you are the US Treasury. The problem with promoting inflation is increased capital risk tolerance. As we have recently seen, this can lead to bad results.
Japan seems to be melding the two ideas efficiently enough to be showing signs of throwing off its economic lethargy of the past decade. Supporters of a strong dollar and low inflation are the owners of wealth, not the people who aspire to a higher standard living and desire economic mobility.
Actually, the number I’m seeing for FY13 Treasury interest expense, before Fed payments to Treasury, is $259b. That comes from the Sep ’13 MTS
table 3 which has $416b gross interest expenses and $157b of intragovernmental interest income.
So after Fed payments to Treasury of $76b, Treasury net interest expense came to $183b in FY13, not the mere $136b I wrote in my previous post, sorry.
(My $211b was a hasty misread of JDH’s $221b. I’m not sure where that number comes from.)
Tom: In Table 9 of the Sept MTS net interest is reported as $221 B, same as in the CBO spreadsheet which is where I was getting the numbers.
Thanks. Digging into the annual combined statement, I found the other $38b that was deducted to reach the $221b net interest expense figure. $2b was interest paid to/earned by the Federal Financing Bank, which is a kind of intragovernmental interest and obviously should be deducted. The other $36b was interest earned on federal loans to the private, local government and foreign sectors. Netting such interest makes some sense, but I’m not sure the annually reported number is meaningful given that such loans are generally subject to accrual accounting.
Nice analysis, Tom.
Also, BC, interesting graph. The Willshire 5000 Total Market Cap to GDP chart speaks to quite a bubble in equities prices.
I take total interest expense and divide by total debt. I iinclude the free interest on debt held by the Fed since that is probably accounted for by the hedge funds. I include intergovermenttal because they are obligations promised and just as difficult to cut. It has continually dropped since the 80s. I have my ideas why, but they are not pleasant ideas.
Matt Young,
I include intergovermenttal because they are obligations promised and just as difficult to cut.
I think you meant to say “intragovernmental” but nevermind that. I agree that the obligations are promised and represent a future cost; however, the same is true of lots of obligations that are not recorded as intragovernmental debt. But let’s think about this intragovernmental debt a little more. Suppose the on-budget side is suddenly balanced…say tax increases or cuts in spending. Whatever. But suppose the off-budget side continues to run a surplus of say $50B. What happens to the total unified debt if the government uses the off-budget surplus to buy back outstanding debt? Nothing. The on-budget debt is reduced by $50B and the off-budget debt increases by $50B. Now suppose the SS Trustees take the lockbox literally and stash that $50B in that famous vault in West Virginia. So none of the $50B surplus is used to pay down outstanding debt. What happens to unified debt? It actually increases by $50B. In other words, keeping the off-budget surplus in the lockbox actually increases the total debt. This should strike you as bizarre. Yes, we have “saved” $50B and the debt has gone up. True, assets in the form of green pieces of paper with pictures of dead Presidents have also increased by $50B, but note that the same would be true if we had taken that $50B and invested in in additional on-budget capital infrastructure projects. My point is that you really need to be careful when you start including intragovernmental debt. Not all, but probably most economists only look at the debt held by the public because that’s the debt that has the most relevance. And you also need to compare debt to assets. Increasing debt is not such a bad thing if doing so also increases capital projects that pay a return. This is an argument for more capital infrastructure project spending while the real interest rate is effectively negative. Almost any infrastructure project will earn a positive return.
Larry Signor,
Can you give me an example of any time in history your formulat for recovery has worked? Can you name any country, not just the US, or any society that created real economic growth through a weaker currency and higher inflation?
BTW, examplesof strong economic growth after adopting a stable currency and low inflation are almost innumerable.
Ludwig von Mises, HUMAN ACTION
If only Mises’s words had been heeded prior to 2008!
Argentina ……………………. oh wait, …………………..never mind.
Another excellent post Professor. Thank you.
The interest we are paying on our national debt is 1.3% of our national income (GDP) while our unemployment rate is 6.6% of our labor force after more than 6 years of employment recession. Must millions of Americans and their families continue to suffer unemployment so that our interest payment rate falls further?
What would we gain by balancing the budget except another recession exactly as happened the last four times we engineered budget surpluses going back to 1957?
Paul,
What takes the economy down is the credit impulse going negative. The credit impulse is the second derivative of the level of credit. Total credit is private sector plus public sector. When the government deficit turns down (year-over-year), that’s the point where the public sector impulse turns negative. Magnitudes are important. Specifically, it is the movement of the public and private sector impulses jointly that determines things.
You imply that balancing the budget would cause another recession “exactly as happened the last four times we engineered budget surpluses going back to 1957.” Indeed the government ran surpluses in 1956 and ’57. But the public impulse went negative in 1954. The recession was a long time coming, and did not arrive until the private sector impulse fell from its huge peak in 1955 to a small positive in 1956, and then eventually negative as well. More correctly then, an unsustainable private sector credit bubble was what took the economy down in 1957. Though the government surplus played a supporting role.
The next government surplus was a small one in 1960, the next recession. The impulse went negative in 1959, but its effect was swamped by a massive private sector impulse at that time. Not until two months into the recession did the joint combination of the two go negative. Why did the recession begin before marginal credit had fallen far enough? Because of the 1959 steel strike, settled that fall. But in the process causing a huge private sector inventory buildup. The 1960 recession was a short 10 months. And the inventory contribution was twice the drop in real GDP. The perturbations to inventory drove this recession, with the government surplus having very little to do with it.
The next and last surplus before the Clinton era was 1969, immediately before the 1970 recession. The overall credit impulse went from a very large positive to just treading water (essentially zero) by mid-1969. By now it had been nearly a decade since the previous recession. Excesses had built, and it was due time for a correction. Guns and butter, remember? Had these excesses not grown to the size they had, there probably would not have been a recession. Already by spring 1970 the public impulse had turned positive. But by then the private sector impulse was sufficiently negative to take over. And did not reach full negative until the recession had ended.
In the Clinton era, the public impulse went negative (Clinton produced surpluses) in 1992. And remained negative but for a couple quarters all the way to mid-2001. Those surpluses did not cause a recession. That is, not until the dotcom bubble burst. The private sector impulse was massively positive from 1997 through 1999. Swamping the effect of the government surpluses. Not until the start of the 2001 recession did the joint impulse go negative. Nor can we ever know if 2001 would not have been a mere growth recession were it not for 9/11. For by then deficit spending was gathering steam – in the impulse sense. The dotcom, Y2K excesses had piled up. The stock market reacted first. Then the Fed inverted the yield curve. And these joint pressures were the cause of the 2001 recession. Not the dwindling negative public sector credit impulse, that was by then only a small straw on the camel’s back.
This is a far more gradated sketch of what happened. And, I carefully refrained from bringing in yield curve inversions so as to not complicate the picture. These run on an obviously independent track from government surpluses. But they are powerful forces in their own right, triggering and thus causing recessions through numerous channels.
“What would we gain by balancing the budget?” We would more quickly get out of the corner we have painted ourselves into by growing the debt all these decades – running those deficits that are seemingly benign – but are in fact what will keep this economy growing at a subpar rate of 2% and less for decades to come. The problem is that both public and private sector debt are now jointly higher (hardly off their high) than ever before in the history of our nation. We are in uncharted waters. Hence, this is not something you can look back at history and make a statement about – without truly understanding the perniciousness of debt – because we have never been here before. The work of Reinhart and Rogoff (and Minsky) are the early warning of what is to come.
Already as of late last year the total credit impulse turned negative. It is too early too tell, but likely it will meander around at a low close-to-zero level. Not enough to cause recession (yet). But enough that the consensus more likely than not is over-projecting growth once again. The most salient point of this is the having painted ourselves into a corner. A corner where if we turn and face it, we see the most towering global debt ratio in all of recorded history.
JBH
Thank you for your careful explanation of the credit cycle and how it impacts the business cycle. Remarkably, although we have completely different perspectives, we don’t disagree fundamentally about what causes recessions: the failure of demand, i.e., negative credit impulse, to provide sufficient impetus for continued economic growth. In the modern era the facts are compelling: over the past 60 years, EVERY TIME the federal budget has been balanced or in surplus, we have had a recession. The recessions of 1957, 1960, 1969 and 2001 were all preceded by budget surpluses and the recessions of 1954, 1974 and 2008 were all preceded by budgets that were nearly balanced – deficits of 1% of GDP or less.
Of course there are many factors that contribute to the onset of recessions as you pointed out, but, as in tort law, there is one proximate cause which has been manifest for six consecutive decades and is completely consistent with Keynesian analysis: “a change-over from a policy of Government borrowing to the opposite policy of providing sinking funds (or vice versa) is capable of causing a severe contraction (or marked expansion) of effective demand.” The General Theory, p. 95.
What is baffling, however, is that having recognized the gravity of a negative credit impulse and the current danger we are in — “as of late last year the total credit impulse turned negative” — you then disregard that situation in favor of a purely hypothetical danger — “the most towering global debt ratio in all of recorded history” — apparently ignoring the massive debt situation of the world in 1945 from which we recovered facilely. It is inexplicable to me why you would advocate exacerbating the current negative total credit impulse when the result — recession — is patent.
Paul,
your comments raise an interesting question. recessions seem to follow budget surplus-at least from the government. now a surplus can be caused by too much revenue (tax hike or growing economy) vs too little spending (spending cuts). which of these parameters is most important? tax hikes produce revenue which is then spent in the economy. spending cuts reduce government spending, but what happens with that extra money that was not spent? if it does not recirculate back into the economy-then you could get a recession. what is the best policy to keep that money circulating rather than in a bank or existing stock equity?
The best way to keep money circulating is to stimulate consumer demand which the Fed has been doing with low interest auto loans and mortgages. Unfortunately, the Fed is now tapering that stimulus by reducing purchases of MBS and long term Treasuries. Combined with the rapid reduction of the federal deficit — 37% in the first 4 months of FY 2014 compared to FY 2013 — I believe we are headed into dangerous waters.
Unless American consumers increase PCE, there is no obvious source of additional demand to sustain the recovery.
sure does make you question the supply side paradigm in current economic conditions.
Paul,
Thanks for your follow-up. I explained that surpluses do not in and of themselves cause recessions. But let me reiterate that the federal deficit peaked in 1992 and fell consecutively for 9 years until the 2001 recession. There is far more to recession causality than shrinking deficits.
You say: “What is baffling, however, is that … you then disregard that situation in favor of a purely hypothetical danger — “the most towering global debt ratio in all of recorded history” — apparently ignoring the massive debt situation of the world in 1945 from which we recovered facilely. It is inexplicable to me why you would advocate exacerbating the current negative total credit impulse when the result — recession — is patent.”
The early postwar recovery period was not part of your post. Now you bring it up, imagining I ignore it. What might make you think that? Do you know what happened then? Households saved massively during the war. Personal saving rate approached 30%. After the war, they were able to drawn on that savings and borrow with near impunity. Household borrowing offset the runoff of government debt during those halcyon years.
I went back and reread my post. I can see how you might have misinterpreted what I said. So to be clear, I was not advocating exacerbating the current situation with deficit reduction. I was attempting to raise the visibility of the serious problem we face. It is not at all well understood. Debt did not appear in the General Theory . And I doubt if debt came up in any of your coursework.
The CBO projects deficits 2013 through 2018 to be: $680, 514, 478, 539, 581, 655 (billions). There are no surpluses, which are what bother you. The negative credit impulses start small and quickly turn positive: -$166, -36, 61, 42, 74. The CBO is projecting roughly 3% real growth over this period. No recession. For many reasons, not just the budget position, I suspect the CBO’s forecast is on the high side. But there is no recession on the horizon in 2014. As for 2015 and beyond, we’ll have to take that as it comes.
Your word “hypothetical” implies a proposition about the future. Indeed, I am making one. It is about systemic risk, something the profession was clueless about ahead of the crisis. Systemic risk is still not well understood. BIS economists like Cecchetti seem to have a handle on it. And savvy hedge fund operators. The risk has everything to do with debt and leverage. Since the crisis, China has created what many economists knowledgeable about China believe is another massive bubble. Japan has long been hamstrung by its debt. Here in the US, the level of joint public and private sector debt is unprecedented. There are only two such peaks in all of American history: 1930s and today. The debt ratio peaked during the Depression just below 300%. Twice normal. The ratio fell to around 130% by 1950. And then started climbing in earnest in the 80s. It peaked during the recent crisis at over 370%! Today it is just below 350%. But has once again turned up. Climbing when it is still far above the level that was so deleterious during the Depression. This cannot be good. We are not in the short-run anymore. The long-run has accordioned and has now arrived. General government gross liabilities as a percent of GDP: Japan (232%), China (160%), France (116%), UK (110%), US (106%). Most large banks in the eurozone effectively insolvent. US bank stocks only 45% of the way back to their 2007 peak. US stock market in bubble. US home prices in early stage of bubble. Emerging markets roiled by tapering. Cheering for more deficit spending is cheering for the wrong team.
I Completely Agree: “Systemic risk is still not well understood.”
Total debt ratio “is just below 350%. But has once again turned up. Climbing when it is still far above the level that was so deleterious during the Depression. This cannot be good.”
So is the systemic risk that another Great Depression is just around the corner? Previously, you seemed to rule out even a recession.
“General government gross liabilities as a percent of GDP: Japan (232%), China (160%), France (116%), UK (110%), US (106%).”
Is the risk that these governments, except for France which does not control its currency, will default?
Or is the risk unsustainable interest rate increases?
As Alan Greenspan famously remarked in 2011, the U.S. cannot default because we can “print” more money, just as Japan, China and the UK can do. Moreover, 30-year T-Bond rates have been declining steadily since the early 1980s and are now well below the budget surplus years of the Clinton Administration.
Of course there is always the risk of hyperinflation, but that seems remote given that the last 5 years have seen the lowest inflation in more than half a century despite the Fed’s massive increase of its balance sheet. But with the Fed’s tapering of QE combined with the rapid reduction of the federal deficit — 37% in the first 4 months of FY 2014 compared to FY 2013 — I believe the systemic risk is recession particularly given the stagnation of medium household income which is actually lower than 1989 in real terms.
Keynesian analysis is compelling: “a change-over from a policy of Government borrowing to the opposite policy of providing sinking funds (or vice versa) is capable of causing a severe contraction (or marked expansion) of effective demand.” The General Theory, p. 95.
I don’t think the word “unsustainable” means what you think it does.
Japan appears to have sustained a very high debt-to-GDP ratio for quite a long time.
miltiary spending could be reduced easily. But the lobby would have something to say … remember, JFK ?
James, take it easy, be a dude.
Federal defense spending fell 7.4% in dollar terms and 12% in real terms from 2010 to 2013, according to the BEA. You can thank the Tea Party, mainly. I would say by far its biggest accomplishment.
Those are calendar year numbers, from the “Federal: National Defense” line of nominal and real GDP. I don’t know the details of how they’re counted, but evidently they include more than just DoD, and since this is GDP methodology they would exclude all transfer payments to households, including many kinds of Vet benefits (which are growing).
The trend may be turning, as mainstream Rs appear to be regaining control of the House and especially its role in the budget process after the Tea Party deeply wounded itself with last year’s partial shutdown.
But the 2010-2013 result was impressive and should put to rest the notion that it’s politically impossible to cut back the military industrial complex.
I seem to remember that you did almost exactly the same analysis two years ago that
completely failed to project the decline we have seen in the federal deficit over the last few years.
Not to target you, but
I really can not seem to remember anyone two years ago projecting the drop in the federal deficit we have seen,
and essentially everyone doing exactly the line of analysis you are doing now.
There are two blades to the scissors. Financial and real. The inventory impulse drove the economy out of its trough and for the first year-and-a-half of the recovery. Into early 2011. This was a classic, easy to predict, always recurring phenomenon. And then, credit took over. The credit impulse has been positive since then until late last year. Private sector credit dominated the mid-2010 to mid-2012 lull in public sector credit. Naturally enough, as all it took was a slowing in the massive multi-year decline of private sector credit for the impulse to go positive. The debt-ceiling package was signed into law in August 2011. But – and this is a very important caveat – the marketplace did not know if the bargain would be kept. Recall all the turbulence around the fiscal cliff in January last year, and around the sequester in March. Only when in fact rather than in promise was this 10-year deal consummated could anyone be certain. The tooth-pulling painful struggle in Washington around these two dates bears witness. Only then could the hammer come down. The public sector credit impulse pivoted on a dime. In April the impulse peaked at its high of around $200 billion year over year. (Impulse equals second derivative of the level.) Latest reading from the Treasury Bulletin is that the year-over-year impulse is now minus $600 billion. The level of trust in government has fallen so low, that in matters like this strong hands must wait until they see the whites of the eyes before firming up their projections. Point is no one could honestly, and with conviction, project the “drop in the federal deficit we have seen” until then.
Great article and also great comments afterward. Question I have is the business regarding the need for negative domestic savings need to equal our trade deficit, which is about $540 billion or so. Right now the government deficit is about that size, so we’re close to equal. But if we do actually balance the federal government debt, without reducing our trade deficit, then the negative savings required would have to all come from the private sector. That sounds like a tough situation, to me; involving lots of unemployment and a severe recession. Am I missing something here?
Chris,
If we were to balance the federal budget deficit (ignoring the fiscal drag on growth), gross and net national saving would rise by that amount. Saving would rise not because of the private sector, but because the federal government would no longer be dissaving. If the current account were then also to come into balance (effectively eliminating the trade deficit, and again abstracting from second order effects), that amount of foreign saving would no longer flow to the US from abroad. Were the two deficits say, each $500 billion, the impact on saving would be a wash.
This highlights the dire straits the US is in. During the five years since the crisis, net national saving was effectively zero. Net real investment has fallen very low. Five years of no saving is a huge cumulative shortfall. It will condition (constrain) productivity growth for years to come. After the initial recovery kick to productivity, productivity growth collapsed back to an unprecedented low level. Productivity growth this past three years averaged 1%. The US is now hobbled by two straps: abysmal saving and excessive debt. Over the medium term, the former must go up and the latter come down. This “double belt tightening” must occur if the US economy is ever to get back on a healthy track. Were the level of government debt (to GDP) down around 50%, there would be slack enough for Keynesian spending to help out. We no longer have that luxury, though, because of the difficult-to-quantify but very real systemic risk given the excessive level of debt, both household and government. The overall level of global debt plays a big role in all this as well. The globe is far too highly leveraged. And bad news will strike at some point, as it is the way of the world.
spencer,
actually several people noted a couple of years ago the large deficits would be reduced-it was pundits with a political agenda who claimed trillion dollar deficits for years to come because of uncontrolled spending. it was simply not true. the large deficits were caused by two factors, decrease in revenue caused by contraction and safety net spending caused by unemployment issues. once the economy stabilized, these two effects dissipate and low and behold, deficits reduce!
Note that even a modest military cut is being reversed: the modest adjustment of 1% in COLA to military pensions for working age recipients (put in by Paul Ryan and not only backed but asked for by the Pentagon) agreed to in December is being reversed. And this minor cut – literally only $7B over 10 years projected – included an adjustment at retirement age as a make-up.
So we’ll continue to argue over a few hundred million for food stamps and other miscellaneous nothings rather than look at the $744B of total military spending. We spend more than essentially all other countries combined – certainly the next 25 together – have something like 10 carrier groups with 2 under construction and no other country has more than 1. And yet we’ve demonstrated that we won’t use our military to force countries to do our bidding, whatever that might be, and we’ve learned our military is essentially useless against the small scale acts of terror. In contrast, if we look at drones, our total annual spending on them, including research (and manpower) is maybe $30B (and most of that cost is people).
So we’ll continue to take money that doesn’t really matter from US citizens so we can walk around the world looking more powerful than we are.
Heck, we can’t even cut much foreign aid because the biggest chunk of that is actually credits to the US defense industry disbursed by our own government to our own companies.
So yes, we face more budget pressures because we’re incapable of making rational decisions about military spending.
And the military soaks up a very large portion of our engineering talent and R&D spending.
Think what that talent and money could do in more constructive applications, like healthcare research and clean energy.
Everyone is forecasting growth for the next few years. Why? Historically we have recessions every ~8 years. We’re going to be due for one, certainly under President Hillary Clinton. Model a recession in and let’s all have a good laugh.