There’s no denying that our bodies deteriorate as we age. But here’s one fact in which those in their golden years may take comfort. If you live long enough, your odds of developing certain cancers decline rather than increase as a function of age.
Source: Physics arXiv Blog.
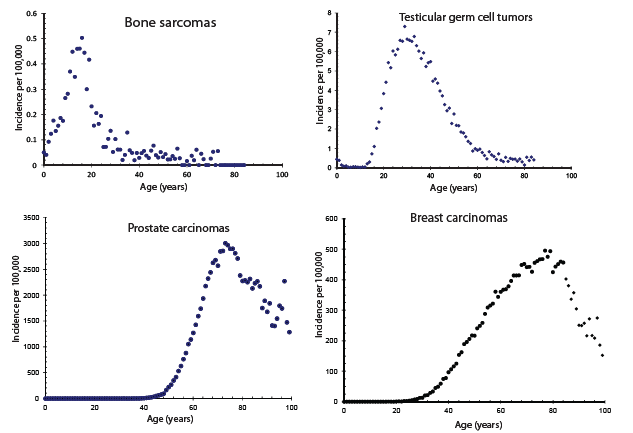
Why would that be? U.C. Irvine Biomedical Engineering Professor James Brody has an answer. The accumulation of mutations that lead to cancer takes time to develop, which is why incidence of cancer is usually observed to rise as a function of age. But people are different, and a subset of the population turns out not to be susceptible to a particular form of cancer. Some of the susceptible group first develop the disease at age 50, others not until age 70. But if you look at a group who have not shown any sign of the disease at age 80, all of the susceptible individuals who had been diagnosed by the time they were 79 are by definition not included in the group of 80-year-olds you’re looking at. As the group you’re looking at becomes older, the fraction of remaining susceptible individuals becomes lower, and the overall incidence of the cancer starts to decline as a function of age.
Brody points out that the data only make sense if people become members of one group or the other before the age of twenty. Your susceptibility to a particular form of cancer seems to be determined genetically or in development, though the particular conditions that determine this are not directly observed.
This is the same principle of dynamic sorting behind the economic research with UCSD graduate student Hie Joo Ahn that I
described last week. Just as the probability of getting cancer changes with age, we observe in data from the Bureau of Labor Statistics that the longer a person has been unemployed, the more likely it is the individual will still be unemployed next month. One explanation could be that different people start out in different circumstances, with some having a higher probability of finding jobs than others. If you look at a given group of people who have all been unemployed for n months, the higher is n the smaller the share in that group of people whose situation allows them to find jobs quickly.
This effect is driven in part by the circumstances under which the individual first became unemployed. People whose old job was permanently eliminated often face big problems finding new work, whereas those who voluntarily quit their old jobs typically find something new fairly quickly. As you look at a group of people who have been unemployed for a certain number of months n, when n is higher so is the fraction of those who suffered permanent job elimination, and the more likely it is that you’re going to observe any given individual in that group is still looking for work in month n + 1. While some factors like whether or not someone voluntarily quit their previous job are included in the BLS database, the patterns are best explained if we hypothesize that there are additional ways in which individuals differ from each other that at present we don’t observe.
Our research suggests that inflows of new people with low probabilities of getting out of unemployment make a critical contribution to typical recessions and the recent rise in long-term unemployment. Identifying the characteristics and the cause will help us to understand the slow recovery of the labor market after recessions since 1990 and find the best way to help the long-term unemployed today.
It was very interesting to see that the same idea that we were using to interpret economic data also has applications in the field of medicine.
And it’s comforting that there’s at least one good thing about growing old.
I think, people who need a job are more likely to be employed. A recent phenomenon is the collapse of the teen labor force participation rate, since the peak in the late 1970s. Chart:
http://research.stlouisfed.org/fred2/series/LNS11300012
Perhaps, some contributory factors are:
1. The decline in the real minimum wage.
2. living off parents longer.
3. The education boom.
Many teens may prefer to live off their parents, play video games, attend college, and go into debt, rather than work for minimum wage, or low wages, and compete with older immigrants.
Also, it has become more difficult for the economy to expand, because of excessive regulations, taxes, fees, fines, fares, tolls, etc.. Most regulations tend to be regressive and have a negative impact on employment, prices, and wages.
Regulation has a cost in time, effort, and money, which are not limitless, and tends to slow economic growth (ceteris paribus). Perhaps, the U.S. economy hasn’t been able to absorb more regulations on top of excessive regulations.
Some taxes (federal, state, and local) are regressive and some have become more progressive. For example, federal income taxes have become more progressive, which may make it more difficult for small business start-ups and expansions:
CBO: Top 40% Paid 106.2% of Income Taxes; Bottom 40% Paid -9.1%, Got Average of $18,950 in ‘Transfers’
December 9, 2013
“The top 40 percent of households by before-tax income actually paid 106.2 percent of the nation’s net income taxes in 2010, according to a new study by the Congressional Budget Office.
At the same time, households in the bottom 40 percent took in an average of $18,950 in what the CBO called “government transfers” in 2010.
The households in the top 20 percent by income paid 92.9 percent of net income tax revenues taken in by the federal government in 2010, said CBO.”
It seems, the way the CBO measures taxes paid is if I pay $2 in taxes and someone else receives $1 in negative taxes, then the government collected $1 and I paid 200%.
Moreover, raising corporate taxes, or other taxes on production, may just raise prices, to offset the taxes, which would hurt low income Americans the most.
If taxes are too high, there may be undesirable effects, including disincentives to work and taking less risk to expand the economy (entrepreneurship, for example, is at 30 year low). And, I think, most Americans grossly underestimate the real costs of regulations and taxes.
I don’t think that data shows that federal income taxes have become more progressive. First, it doesn’t compare current data to to historical data.
More importantly, it doesn’t necessarily say anything about tax progressivity: it may just show that income is very, very unequal.
Federal income taxes have become more progressive over time:
http://taxfoundation.org/article/cbo-report-shows-increasing-redistribution-tax-code-despite-no-long-term-trend-income-inequality
Peak,
At times I’ve tried to glean useful ideas from heavily biased sources, but I’ve found that one has to work pretty hard to find anything of value. On the whole, it’s not really worth the effort of researching bad ideas, one by one. The Tax Foundation you’re using as a source is one of those sources that’s just not worthwhile.
A quick look at the article you referenced indicates that they’re not analyzing progressivity, they’re just looking at actual taxes paid. The main chart shows average tax rate paid, not marginal tax rate – that’s not useful at all. Here’s one comment which illustrates that: “Since 2007, the tax rate on the top 1 percent has actually increased, from 19.4 percent to 21 percent, such that it is higher now than at any time since the Bush tax cuts. This is largely due to the collapse of the stock market, which reduced capital gains as a source of income.” That analysis is a waste of time.
We can see how much time this article wastes by looking at the footnotes: all of them are self-referential. I’d have to spend quite some time hunting down the primary OECD and CBO sources, and they’re unlikely to support the ideas of the original article (if they did, they’d be front and center).
Also, I may add, raising the national minimum wage (which is not a tax), perhaps up to $15 an hour, is a pro-growth policy, because of an increase in productivity and a decrease in other production costs. So, it’ll have a signficant effect on raising GDP, although little or no effect on employment. Income inequality will be reduced through inflation.
PeakTrader, those quotes above that you insinuate are from the CBO are instead from Brent Bozell’s Conservative News Service. Were you fooled or were you trying to fool us? Are you dumb or dishonest — or both.
In Bozell’s tortured analysis, federal taxes include only income taxes while social security and medicare payments are considered negative taxes. So you don’t count social security and medicare taxes paid but do count social security and medicare payments spent. Talk about distorted statistics!
As for the $18,850 in transfers, almost all of that is social security and medicare payments. It turns out that a lot of lower quintiles are the elderly who paid social security and medicare taxes their entire lives but are paying low taxes in retirement.
Moreover, I may add, a higher minimum wage shifts idle capital (earning enough for capital preservation), in the saving glut, into capital equipment (because labor becomes relatively more expensive).
So, better jobs are created, because workers are needed to create, build, ship, install, improve, maintain, operate, and manage those machines.
Currently, in the U.S., there’s an overabundance of capital and an education boom.
There are too many overeducated Americans working at low-skilled jobs, and too much (idle) capital kept in unproductive assets.
Joseph, the article was about “income taxes.” There’s a difference between “federal taxes” and income taxes. Here’s what the CBO says about federal taxes:
“Households in the top quintile (including the top percentile) paid 68.8 percent of all federal taxes, households in the middle quintile paid 9.1 percent, and those in the bottom quintile paid 0.4 percent of federal taxes.”
http://cbo.gov/publication/44604
Sounds like survivors bias in the stock market indexes. My little pea brain flashed on that quickly.
PeakTrader: “There’s a difference between “federal taxes” and income taxes.”
Funny, you want to exclude social security and medicare tax from income taxes, but you want to include social security and medicare payments as negative income taxes in the same calculation. So which is it? You can’t have it both ways. Citing from Brent Bozell — have you no pride.
PeakTrader: ““Households in the top quintile (including the top percentile) paid 68.8 percent of all federal taxes.”
And in the same report the CBO says “households in the highest quintile received 51.9 percent of before-tax income.”
Rising riches: 1 in 5 in U.S. reaches affluence
December 6, 2013
“New research suggests that affluent Americans are more numerous than government data depict, encompassing 21% of working-age adults for at least a year by the time they turn 60. That proportion has more than doubled since 1979.
Sometimes referred to by marketers as the “mass affluent,” the new rich make up roughly 25 million U.S. households and account for nearly 40% of total U.S. consumer spending.
In 2012, the top 20% of U.S. households took home a record 51% of the nation’s income. The median income of this group is more than $150,000.”
****
Growth in the
Residential Segregation
of Families by Income,
1970-2009
“The proportion of families living in affluent neighborhoods doubled from 7 percent in 1970 to 14 percent in 2007.
Likewise, the proportion of families in poor neighborhoods doubled from 8 percent to 17 percent over the same period.”
My comment:
In 1970, the proportion of Americans in the “affluent” and “upper income” classes, and also in the “low income” and “poor” classes were relatively small, while the proportion of Americans in the “high middle income” and “low middle income” classes were very large.
If you break down those six classes into three classes, the high and low classes grew and the middle class shrunk. Those three categories are almost equal in size today.
In 1970, both the high and low classes were about 18% each, while the middle class was over 60%. In 2007, both the high and low classes were about 30% each, while the middle class was over 40%.
Many middle class Americans moved into the higher classes, while many immigrants from dirt poor countries moved to the U.S. and into the lower classes.
Despite conventional wisdom, there has been tremendous upward income mobility in the U.S..
“Identifying the characteristics and the cause will help us to understand the slow recovery of the labor market after recessions since 1990 …” You are looking under the wrong tree. If joblessness is predominately ginkgo leaves and you look under an oak, your count of acorns may be valid to the third decimal point, yet virtually irrelevant. This all too common error of looking in the wrong place plagues macroeconomics. The profession does not take a cosmic dome view. It is too absorbed in ivory tower mathematical sophistication, and too little in comprehending what is going on in the real world. It is math, not economics. Of all commenters on this blog, BC and Anonymous (probably more than one Anonymous) think from a cosmic dome perspective. They may get a few things wrong, but that is far outweighed by their being on the right track and getting the broad dimensions of what is coming right.
To the matter at hand — joblessness. Joblessness is the number of months it takes for employment to regain the level at the cycle peak prior to recessions. Joblessness has sequentially increased from recession to recession ever since 1982. You will search the economic literature in vain in for why this is so. Explanations are all over the map. To prove this, spend some time and do a thorough search of joblessness on Google. The answer — the real cause of joblessness — is nowhere to be found. The American public is more interested in jobs than any other dimension of the economy. Yet the priesthood charged with the responsibility for the sacred temple is clueless on this priority matter. (Parenthetically, this is a microcosm of a more general cluelessness, due to the very lack of cosmic dome thinking aforementioned. This is by far the most important point of my comment here.)
The sequential increase in joblessness is due to the sequential growth from one cycle to the next in the US trade deficit as a share of GDP. The economic sense of why this is so is what’s important. Followed out to its logical conclusion, it drives a silver stake in the vampire heart of free trade. A giant sucking sound indeed this vampire makes. NAFTA, WTO, and similar real world trade policies have foisted off the debilitating consequences of the blind misguided belief in Ricardian comparative advantage on America, to the great advantage of China, Mexico, and the rest-of-the-world. Multinational corporations domiciled in the US getting 50% or more of their profits from abroad are the champions, pressing otherwise ignorant Congressmen and women to legislate these policies. Why is Congress so ignorant? Well, who taught them their economics? Perhaps 5 out of 100 economists grasp the points I am making here. Speak against free trade and you will be laughed at, denied tenure, and in all manner condemned.
Do not make the mistake of thinking I am throwing out the baby of comparative advantage with the bathwater. I am keeping that. It is the bathwater of the destructiveness of not playing on a level playing field, and its ongoing dynamic consequence of hollowing out American competitiveness including stillborn firms and whole industries, that I am throwing out. A hollowing out exemplified by the non-energy component of industrial production growing at the sparkling rate of a whole ½ percent since the cycle peak in 2000! As nothing is being done to remedy this – indeed more free trade agreements are in the works as we speak – it is easy to predict economic stagnation for the US as far as the eye can see. If just one more economic eye in twenty is opened to this, economic understanding will have doubled.
Professor,
While you are correct in the aggregate, but when specific behaviors are analyzed I am sure there would be different curves. This is as true with mortality as with unemployment. A population of those who never smoked would be different from the total population. The same would be true with unemployment. In a time of limited unemployment insurance and minimum wages the curve would be totally different from one with 99 months of unemployment, yearly increasing minimum wages, and allowance of disability classification with very little review.
JBH, globalization, i.e. free trade, open markets, and unrestricted capital flows, has benefited the U.S. tremendously, in raising domestic consumption (e.g. more shopping malls), and in raising domestic production (e.g. in the Information and Biotech revolutions).
If a U.S. trading partner adopts an inferior economic policy, e.g. trade barriers or tariffs, that’s our gain. As a matter of fact, the gains in U.S. trade are larger than our trading partners “gains-in-trade.”
Globalization isn’t holding back U.S. growth. It shifted production from low-end manufacturing into high-end manufacturing and facilitated explosive growth in emerging industries, while we imported offshored goods at lower prices and higher profits.
The U.S. not only leads the world in the Information and Biotech revolutions, it leads the rest of the world combined, in both revenue and profit.
In manufacturing, the U.S. is the most productive in the world, producing more output with fewer inputs:
U.S. Manufacturing: Output vs. Jobs Since 1975
Jan 24, 2011
Since 1975, manufacturing output has more than doubled, while employment in the sector has decreased by 31%. While these American job losses are indeed sobering, they are not an indication of declining U.S. competitiveness. In fact, these statistics reveal that the average American manufacturer is over three times more productive today than they were in 1975.
Chart of U.S. manufacturing real output:
http://research.stlouisfed.org/fred2/series/OUTMS
Peak, take a close look at the charts at the links below. Your perception will be fully informed.
http://research.stlouisfed.org/fred2/graph/?g=Bbz
http://research.stlouisfed.org/fred2/graph/fredgraph.png?g=Bbz
http://research.stlouisfed.org/fred2/graph/fredgraph.png?g=Bbu
Ex mining and oil and gas extraction, real US mfg. is 9% below the level in 1982, down 30%, i.e., a depression, since Peak Oil in 2005, and down 55-60%, i.e., systemic deindustrialization, since the peak in the early to mid-1970s, which was the period during which US crude oil production peaked in absolute terms and per capita, and it’s down ~50% per capita since.
In fact, US oil production per capita is back to the level of the late 1930s to before WW II, and further back to the level of 1929-30. One never hears this.
US real mfg., including mining and oil and gas extraction, is back to the levels of 1994-95 and 1982-83, down 20% since 2000, down 13% since Peak Oil in 2005, and down 50% since 1973.
That is, the US can no longer afford to be a domestic industrial economy because of the price of oil, which is why the Fortune 25-100 to 300 firms chose “globalization”, i.e., offshoring production to take advantage of cheap foreign labor and at the time of NAFTA what was still cheap oil at $12-$30/bbl. No more.
The obvious inference from the data is that real US mfg. value-added output ex mining and oil and gas extraction cannot grow with the constant US$ price of oil above $40-$50.
Now the rest of the world, including China-Asia, is where the US was in the mid- to late 1970s in terms of declining oil production and real mfg. output per capita.
However, this time around we not only have Peak Oil and peak industrialization, we have peak population (overshoot), debt, employment, and real GDP/final sales per capita, i.e., “Limits to Growth”. Growth of population, urbanization, and industrialization on a finite planet is done.
BC, U.S. real manufacturing output has more than doubled, since the 1970s, and it takes a much smaller workforce. That raises U.S. living standards.
What’s remarkable is the global share of U.S. manufacturing output has remained roughly constant at 20% for decades, although the huge U.S. trade deficits, in recent decades, raised our trading partner’s manufacturing output. So, U.S. manufacturing output had strong growth, e.g. from market power, while our trading partners had declining prices.
The only way to move from one economic revolution into the next is through efficiencies. The U.S. economy is the most efficient economy in the world, which is remarkable for a large country.
Also, I may add, the U.S. economy has become lighter, because goods produced in the Information and Biotech revolutions weigh very little, along with services.
Peak, you apparently did not look at the chart data. How you can hold the opinion you share in the face of the data is quite remarkable.
As for US being efficient, in net exergetic terms, the US wastes more than any other country in history, which is one reason why we have had to deindustrialize the economy and “globalize”/”imperialize” the production/supply chain and spend 5-6% of GDP on an imperial military force defending the global production, transportation, and distribution superstructure.
If the ACTUAL cost of non-renewable resource depletion, pollution, and health were included, the net value-added output would be even lower due to the inability to engage in the activities at a profit.
As for the IT and biotech sectors, what share of net value-added output do these sectors contribute? How many people are employed as a share of employment? As for the goods and services being “light”, where would these industries be without the pre-existing fossil fuel and industrial-era infrastructure that must be maintained to support these sectors?
Here’s real software and equipment investment, which is back to the level of 1979-80, along with full-time, private employment at the level of the mid-1980s, and goods-producing employment down 50% since US peak crude production:
https://research.stlouisfed.org/fred2/graph/fredgraph.png?g=Bcs
IT and biotech (along with finance, health care, gov’t, etc.) require effectively the cumulative growth of 150 years’ worth of fossil fuel-based industrial development and ongoing growth of real capital accumulation, which, BTW, is down nearly 40% in real terms as a share of real final sales since 2000, and down 20% since 2007-08:
http://research.stlouisfed.org/fred2/graph/fredgraph.png?g=Bcr
How can US real final sales per capita grow hereafter with capital formation, real investment, and real mfg. in long-term decline (slow-motion collapse)?
One can continue to believe the platitudes we are conditioned to tell ourselves, of course, but the data do not support the metanarrative you apparently believe and choose to repeat.
As for the goods and services being “light”, where would these industries be without the pre-existing fossil fuel and industrial-era infrastructure that must be maintained to support these sectors?
Where would manufacturing be without managers, salesmen, lawyers and accountants? Goods are dependent on services, just as services are dependent on goods.
And fossil fuels were invaluable at one time, but now it’s time to kick the habit. Just as horses became obsolete for farming and transportation, oil is no longer essential.
BC, I looked at your charts. They have no meaning that I can tell. What is it you’re trying to convey with those relationships?
This depression, since 2009, when the 2007-09 recession ended, is completely unnecessary.
Peak Oil is a constraint on economic growth. Nonetheless, the economy has the capacity to expand much faster than the past few years.
It should be noted, there’s a production boom in natural gas, with very low prices, that somewhat offsets higher oil prices.
PeakTrader
Please read my comments more carefully. I specifically addressed J. Hamilton’s main interest: “ … help us to understand the slow recovery of the labor market after recessions since 1990 … .” Not since 1975 mind you, which early date belies your comprehension of the evolution that has taken place. Trade deficits prior to the 1982 recession were trivial in size. But since 1990, and more prominently since 2000, they most assuredly have not been. My response was: “The sequential increase in joblessness is due to the sequential growth from one cycle to the next in the US trade deficit as a share of GDP.” That empirically-based point stands.
I uncovered this relationship quite a while back. Papers are now coming out in support of this conclusion. Read Pierce and Schott’s The Surprisingly Swift Decline of U.S. Manufacturing Employment (November 2013). From their abstract: “This paper finds a link between the sharp drop in U.S. manufacturing employment beginning in 2001 and a change in U.S. trade policy that eliminated potential tariff increases on Chinese imports. Industries where the threat of tariff hikes decline the most experience more severe employment losses along with larger increases in the value of imports from China and the number of firms engaged in China-U.S. trade.”
You claim globalization equals free trade, open markets, etc. Globalization does no such thing. The very word glosses over a raft of complex effects. Global markets are neither free nor fair. The US is operating at a significant disadvantage. Deliberately, as a narrow group of US-domiciled multinationals and big name high tech firms continue lobbying for more of this to the detriment of the broad American public.
The US paid a terrible price for the domestic consumption benefits you tout. The worst joblessness since the 1930s, deeper in debt domestically and internationally to make these consumer import purchases, and from the perspective of the overall dynamic process underway the US manufacturing sector is being hollowed out. NAFTA , WTO (as it relates to China), KORUS, and other alphabets opened the floodgates. The TPP currently being pushed by big multinationals is being negotiated behind closed doors away from public scrutiny. All have been job killers.
You imply job losses are not an indication of declining US competitiveness. The World Economic Forum’s Global Competitiveness Index tells a different story. These indices are available starting in 2005, with ordinal rankings before then. Since 2005 the competitiveness of the US, the biggest trade deficit nation on the globe, has fallen 33 points. The US no longer ranks number one. The world’s great surplus nations are, not surprisingly on the rise. Germany’s competitiveness up 41 points, now ranking it ahead of the US. And China is up a giant 77 points and catching up fast. This is in accordance with my original point about joblessness and the trade deficit. Causality is all too obvious.
Here’s an article by the Fed:
Income Flows from U.S. Foreign Assets and Liabilities
Federal Reserve Bank of New York
November 14, 2012
Foreign investors placed roughly $1.0 trillion in U.S. assets in 2011, pushing the total value of their claims on the United States to $20.6 trillion. Over the same period, U.S. investors placed $0.5 trillion abroad, bringing total U.S. holdings of foreign assets to $16.4 trillion. One might expect that the large gap of -$4.2 trillion between U.S. assets and liabilities would come with a substantial servicing burden. Yet U.S. income receipts easily exceed payments abroad.
As we explain in this post, a key reason is that foreign investments in the United States are weighted toward interest-bearing assets currently paying a low rate of return while U.S. investments abroad are weighted toward multinationals’ foreign operations and other corporate claims earning a much higher rate of return.
U.S. investors earned a much higher rate of return on multinationals’ foreign operations and similar corporate holdings than did foreign investors here, 10.7 percent versus 5.8 percent, respectively.
The superior U.S. rate of return on FDI, as well as the greater tilt in U.S. foreign investments toward FDI, accounts for the $322 billion income surplus recorded in this category in 2011…The United States has earned a substantial premium on FDI investments at least since the 1960s.
****
GDP is an incomplete and inaccurate measure of living standards. I stated before:
In the Keynesian consumption function (or identity), Y = C + I + G + NX; trade deficits, or negative net exports (NX), subtract from GDP growth, because consumption (C) is overstated.
For example, in a $10 trillion economy, a 5% one year increase in GDP expands the economy by $500 billion. Also, if imports are greater than exports, e.g. $1 trillion of imports and $600 billion of exports, then net imports are $400 billion in one year, which adds to our trading partners GDPs and subtracts from U.S. GDP. However, the total added to the U.S. economy is $900 billion ($500 billion from GDP growth in one year and $400 billion from net imports in one year), because the U.S. is consuming more than producing in the global economy.
It should be noted, with trade deficits, the U.S. exchanges dollars for foreign goods and foreigners exchange those dollars for U.S. Treasury bonds. However, the U.S. is able to maintain trade deficits in the long-run, mostly, because foreigners lose through changes or differences in inflation, interest rates, and currency exchange rates. For example, over the past few decades, the Japanese yen appreciated from 360 to 100 per dollar, which means Japan received fewer and fewer yen per dollar.
Also, to a lesser extent, many of those foreigners moved to the U.S., and foreign firms began producing in the U.S., because it’s better to use those dollars than exchange them for their currencies. Moreover, those foreigners can raise their standards of living by selling their assets, exchanging their currencies for dollars, and moving to the U.S., or attending a U.S. college. Furthermore, tourism (by foreigners in the U.S.) adds to U.S. exports.
One thought about the charts: the scales for the two ‘early-onset’ cancers (Bone Sarcomas and Testicular Germ Cell Tumors) are much smaller than those for the ‘late-onset’ cancers (Prostate Carcinomas and Breast Carcinomas). It looks (at first glance) like the early-onset rates would be only slightly discernible at the scale of the late-onset cancers. (Though overlaying the testicular and breast cancer charts would probably belie that oversimplification.)
Is there any relevance to this observation?
Thanks,
Peter
You call it dynamic sorting, but estimating survival curves is standard in mortgage modelling and credit research, has been for a long time. By survival I mean delinquency/default probability. Two cohorts (say those originated in 2007 vs 2010) will have different marginal/conditional default probabilities, even if one controls for FICO, loan to value, etc. The feature that default probability rises to a peak and then declines is a characteristic of many loans (if a 2007 vintage loan has not defaulted by now, it is far less susceptible to default probably due to unmodelable features such as strong “moral obligation”, other default disincentives not captured, or the obligor is less susceptible to unemployment or has off-books or uncaptured financial resources like family).
I am glad we are looking an unemployment transition probabilities this way, but I still cringe when I see this attributed to “jobs skills”, permanent job loss, unemployment insurance (dis) incentives, or other causes. It tells us that there are different cohorts to be sure, but not why. Maybe wages are stickier in some places/industries than others.
What I puzzle over is this graph: http://macroblog.typepad.com/macroblog/2014/05/how-has-disability-affected-labor-force-participation.html
The percentage of people claiming disability has climbed uniformly across all groups since 1998.
dwb, according to the chart in the link below, applications for disability benefits rise and fall with the unemployment rate. So, for example, in 1995-00, when actual output exceeded potential output and the country was beyond full employment, applications for disability benefits fell.
However, it should be noted, the Baby-Boomers, born between 1946-64, were at their peak productive years in 1995-00, i.e. at prime-age, or 35-54, and the group increasingly moved beyond its prime after 2000.
Also, it’s possible, it has become easier to qualify for disability benefits in many states.
http://apps.npr.org/unfit-for-work/
Eyeballing the macroblog chart, it is a uniform increase since 1998. Years when unemployment was low, like 98 and 2006, are not better (lower rate) than 2001.
Keep in mind, the macroblog chart is people reporting disability as a reason for non participation in the labor force, not people actually making SSI disability claims (or other private disability benefits claims). The graphs in that link are not apples-to-apples. They are not normalized by population or shown by cohort (esp in the 45-60 age brackets) as they are in the macroblog chart. If the SS admin released those numbers, it would be interesting.
The article says “disability or illness is cited (for labor force nonparticipation) most often among people 51 to 65 years old.”
Perhaps, “retired” increasingly replaces “disability or illness” after the mid-50s?
@NickG: “Where would manufacturing be without managers, salesmen, lawyers and accountants? Goods are dependent on services, just as services are dependent on goods.”
Nick, indeed, but countless tens of thousands of jobs “in mfg.” have been lost over the past 25-40 years for professionals, including accountants, managers/supervisors, engineers, technicians, purchasing personnel, product managers, production control, IT, HR, sales, logistics, and so on. It is often assumed that mfg. employment is only mind-numbing, dead-end, repetitive jobs “no one wants to do”, when in fact a majority of goods-producing jobs require value-added skills, experience; and the only way to develop that human capital is to have a viable goods-producing sector that provides the opportunities.
“And fossil fuels were invaluable at one time, but now it’s time to kick the habit. Just as horses became obsolete for farming and transportation, oil is no longer essential.”
WOW! It’s hard to know where to begin to answer that one. “Oil is no longer essential”? At $100-$110/bbl, oil is more “essential” and valuable than EVER and an increasingly debilitating cost to growth of real final sales per capita with each passing week the price remains where it is. In fact, the supply and quality of oil is now declining worldwide per capita, which is the primary constraint and reason why real final sales per capita in the US and worldwide have not grown since Peak Oil in 2005-08.
Household, non-financial, and financial debt to wages: http://research.stlouisfed.org/fred2/graph/fredgraph.png?g=Bdr
To GDP: https://research.stlouisfed.org/fred2/graph/fredgraph.png?g=Bdt
As we deindustrialized and financialized the US economy from the 1970s-80s, we replaced growth of fossil fuel-dependent, value-added goods production, employment, and purchasing power with an order of exponential magnitude of private debt to wages and GDP into 2007-08 to the point that, for debt to wages and GDP to continue to grow, debt would have had to grow at a super-exponential rate.
But here’s what happens to a hyper-financialized economy when debt to wages and GDP does not grow after reaching the mathematical debt jubilee threshold:
http://research.stlouisfed.org/fred2/graph/fredgraph.png?g=Bdu
No growth of debt with declining capital formation and real mfg. output means no growth of real final sales per capita for 6-7 years with oil above $40-$50.
Oil is “no longer essential”? Good grief, man!
You are kidding, yes?
a majority of goods-producing jobs require value-added skills, experience; and the only way to develop that human capital is to have a viable goods-producing sector that provides the opportunities.
I agree – most of the jobs in manufacturing are in fact knowledge-work. And, it’s a good idea to have a healthy manufacturing sector. I think all of us agree. The real question: how much of the loss in manufacturing employment is due to greater labor productivity, and how much of it is due to “off-shoring”. Most of the data suggests that greater productivity is the primary factor.
…we replaced growth of fossil fuel-dependent, value-added goods production, employment, and purchasing power with an order of exponential magnitude of private debt
I agree that high oil prices are hurting US households, and hurting the US’ trade balance, thus creating more debt. What’s worse, our oil addiction has deeply hurt our national security. What’s the solution? Get rid of our oil addiction. Move to higher efficiency ICE vehicles, hybrids, plug-ins and EVs. Move from trucking to rail.
We don’t need oil to add value in manufacturing: most manufacturing energy is electricity. We don’t need oil to move freight: rail is far more efficient and can use NG or electricity. Or, trucks can become much more efficient, and use NG and electricity as well.
So, I think you need to re-think a key question: why would oil be essential and unsubstitutable?
BC,
Nick is correct to say oil is no longer essential, in effect saying its constraints are sufficient on the economy to look for a viable replacement with fewer constraints. that is why we are looking at renewable energies and hydrogen systems for transportation and storage. why would you want to continue to rely on a resource that shows no future capacity at an affordable price? oil serves as a dead weight on the growth of our economy.
baffling, but there is no “viable replacement” for oil in terms of EROEI and net exergy transfer at the necessary scale and rate to permit growth of real final sales per capita that in turn permit the build out of a “renewable electricity conduit”, i.e., “renewable energy”, infrastructure AND simultaneously maintain the liquid fossil fuel infrastructure on which “renewables” depend for growth and maintenance.
Look at the charts I shared. Real US mfg. output ex mining and oil and gas extraction is in a secular (permanent) decline in complete contradiction to Peak’s claims, and not just in the US but in the UK, Germany, Japan, Australia, Brazil, India, and even China (ex the country’s runaway construction bubble, the largest in world history), i.e., the world:
http://research.stlouisfed.org/fred2/graph/fredgraph.png?g=BgZ
How do you propose that the “renewable electricity conduit” infrastructure, i.e., “renewable energy”, is going to continue to be built out to necessary scale and indefinitely maintained thereafter with the fossil fuel-dependent industrial sector in systemic decline because of Peak Oil?
And an increasing number of people are convinced that we can afford to mine the Moon and asteroids, and to colonize Mars, even though we can’t grow world real final sales per capita at Peak Oil on Spaceship Earth.
Also, are you aware that US electricity consumption per capita is back to the levels of the mid- to late 1990s to early 2000s, not coincidentally the same level as capital formation to final sales and employment per capita? This is occurring with the massive build out of wind and solar capacity. And, no, it’s not all due to increased efficiency. Rather, the US economy peaked in the 1990s to Peak Oil and has been in systemic decline since.
Please familiarize yourself with the critical concepts of entropy, exergy, EROEI,”Dutch Disease”, and the “Seneca effect”, and refer to Jeffrey Brown and Steven Kopits’ excellent work. Without a clear understanding of these concepts and examining their clearly demonstrable drag effects on value-added (un)economic activity since Peak Oil in 2005-08, one does not understand what is happening and the associated implications hereafter for monetary, fiscal, trade, tax, and foreign policy, for our standard of living, and even for modern civilization as we know it.
BC, by your logic we will simply continue to rely on oil for the next fifty years, with the exact same outcomes every year. that is foolish. we know of many possible alternatives, let’s research them, develop them, deliver them and exploit them. only a fool or somebody dependent upon an oil paycheck would insist that we not look for ways to minimize the impact of oil on our economy. it takes a closed mind to continue to argue the importance of keeping oil in our economy, because, uhhhhhhh, it has been important for the past 50 years. lets simply make the next 50 years an economy where oil has no role to play at all.
there is no “viable replacement” for oil in terms of EROEI and net exergy transfer at the necessary scale and rate to permit growth
Except for coal, natural gas, wind and solar. Why aren’t they good enough? They’re all cheap, high E-ROI, and scalable.
Look at the charts I shared. Real US mfg. output ex mining and oil and gas extraction
Is this chart US production or world? Why exclude China, or mining? If your point is that production is going down, why exclude those things, which are, in fact, real production?
the fossil fuel-dependent industrial sector in systemic decline
But what if industry isn’t dependent on fossil fuel? And why is fossil fuel even in a discussion about oil? We have vast quantities of coal and NG, and we’ve been using them pretty freely in the last 40 years.
US electricity consumption per capita is back to the levels of the mid- to late 1990s to early 2000s,…, no, it’s not all due to increased efficiency.
Why not? I’m getting pretty good light out of my LEDs and my air conditioner is twice as efficient as it was 30 years ago. Doesn’t that make a difference? GM says it’s reducing the energy needed to make a car, every year. Doesn’t that count?
see http://www.greencarcongress.com/2014/05/gm-reduced-energy-intensity-and-carbon-intensity-per-vehicle-in-2013.html
Rather, the US economy peaked in the 1990s
Why is GDP up then? I know you think some of our GDP isn’t really very useful, but still, it’s real production capability, right? If we don’t like what the economy is putting out, we can choose something else, but the production capability is there, either way.
JBH says: “The sequential increase in joblessness is due to the sequential growth from one cycle to the next in the US trade deficit as a share of GDP.”
Trade deficits allow tax cuts to generate demand and raise employment. However, average annual U.S. per capita real GDP growth from 1982-07 was 2.30%, which was strong growth, over 26 years, although increasingly larger trade deficits, over that period, subtracted from GDP growth.
Since the V-shaped recovery, in the early 1980s, and subsequent strong expansion from 1982-90 (when real GDP per capita growth averaged 3.14% in those nine years), the U.S. had three recessions: one moderate, one mild, and one severe.
There was a slow recovery after the 1990-91 recession. Real GDP per capita growth averaged 1.24% over the five years 1990-94. Over the subsequent six years 1995-00, real GDP per capita growth averaged 3.14% (coincidentally the same as 1982-90, but with much larger trade deficits).
In the 2001 recession, real GDP per capita didn’t fall in 2001. The spectacular structural bull market from 1982-00 ended and a structural bear market began. Real GDP per capita averaged 1.92% from 2002-07, on top of the huge economic gains, from 1982-00, and trade deficits peaked in the mid-2000s. The “long boom” was extended into 2007.
Because of trade deficits, a large tax cut was needed after 2007 to either reduce the severe recession or achieve a strong recovery. The Bush tax cut in early 2008 not only lessened the recession, it gave the Fed time to catch-up easing the money supply. However, the economy fell off a cliff when Lehman failed in Sep 2008. A large tax cut in early 2009, e.g. $5,000 per worker or $700 billion, may have jolted the economy into a self-sustaining consumption-employment cycle, particularly with other pro-growth policies, e.g. deregulation and a higher minimum wage, and fewer anti-growth or counterproductive and ineffective economic policies, which were expensive.
PeakTrader:
“Trade deficits allow tax cuts to generate demand.” Huh? ….. filler material ….. “Because of trade deficits, a large tax cut was needed after 2007.” Huh? ….. more filler material ….. “A large tax cut in early 2009, e.g. $5,000 per worker or $700 billion, may have jolted the economy into a self-sustaining consumption-employment cycle.” Once again, huh? You mean do something beyond what the cumulative $3,021 billion of base money and $6,232 billion of deficit spending since Lehman, haven’t able to do? You just might get a fried quail to fly into your mouth if you stand around long enough, too.
JBH, there’s no structure in your statements. And, you make false assumptions. For example, banks are holding $2.5 trillion in excess reserves, which hasn’t been put into circulation. Also, there hasn’t actually been that much deficit spending. There’s less tax revenue and more spending on the unemployed. When the economy actually recovers, and more people are employed paying taxes, budget deficits will shrink dramatically.
I stated in Feb ’09 (it should be noted, the U.S. had increasingly larger trade deficits, through the mid-2000s, where U.S. consumers bought foreign goods and foreigners bought U.S. Treasury bonds. Not enough of those dollars were “refunded,” in the form of tax cuts, to allow the spending to go on):
1. Obama should change his stimulus plan to a $5,000 tax cut per worker (or $700 billion for the 140 million workers at the time, including through the earned income tax credit), along with increasing unemployment benefits by a similar amount. This will help households strengthen their balance sheets [i.e. catch-up on bills, pay-down debt, spur consumption of assets and goods, etc.]. This plan will have an immediate and powerful effect to stimulate the economy and strengthen the banking system. When excess assets and goods clear the market, production will increase.
2. Shift “toxic” assets into a “bad bank.” The government should pay premiums for toxic assets to recapitalize the banking industry and offset the systemic problem caused by global imbalances. The Fed has the power to create money out of thin air, to generate nominal growth, boost “animal spirits,” and inflate toxic assets.
3. Government expenditures should play a small role in the economic recovery. For example, instead of loans for the auto industry, the government should buy autos and give them away to government employees (e.g. a fringe benefit). So, automakers can continue to produce, instead of shutting down their plants for a month. Auto producers should take advantage of lower costs for raw materials and energy, and generate a multiplier effect in related industries.
As a vegan,I have to mention that incidence of cancer is constantly growing in our society, which is highly correlated with the increases in the consumption of dairy products and meat. This does not mean that I question Brody and his research, it is just that we have the power as individuals to lower the probability of getting cancer just by changing our diet, which is powerful and also recognized by Chinese and Indian medicine. Western approach, on the other hand, is focusing mere consequences and thus not giving patients enough information about how they should behave.
incidence of cancer is constantly growing
Possibly we’re just getting better at catching early cancers, some of whom would never actually be a problem.
we have the power as individuals to lower the probability of getting cancer
No doubt. Heck, taking Vitamin D seems to lower some major cancer rates by 50-70%. Here’s the randomized, double-blinded study: http://ajcn.nutrition.org/content/85/6/1586.full