Preliminary figures from the Quarterly Census of Employment and Wages (QCEW), which Governor Walker has previously touted as more accurate than the establishment survey [1], indicate a substantial downward revision in Wisconsin private employment.
Figure 1 shows the 12-month change (not growth rate) in QCEW (not seasonally adjusted) private employment and 12-month change in private employment reported in the BLS establishment survey.
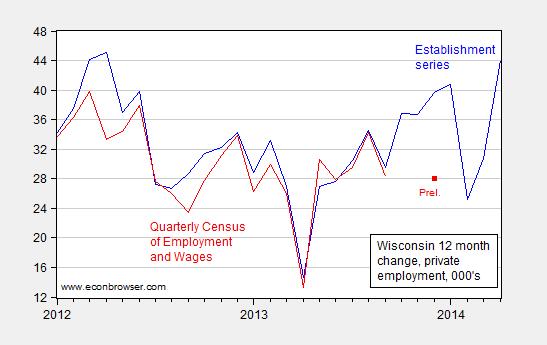
Figure 1: Change in private nonfarm payroll employment as reported in establishment survey, s.a. (blue), in private employment as reported in QCEW n.s.a. (red), both in 000’s. Red square is preliminary 12-month change as reported by WI DWD. Source: BLS, DWD, and author’s calculations.
It is interesting to note that the preliminary QCEW figure is a full 11,700 less than the BLS establishment survey estimate. As the Governor’s administration has stressed [2] [3], the QCEW numbers are from a census, not a survey, and are hence much more accurate.
The QCEW figures are not seasonally adjusted, so a comparison with the establishment series in levels is a bit complicated. In order to draw out the implications, I use the 2001M01-2013M09 sample period to estimate the relationship between the two series:
nfpt = β0 + β1nt + monthly dummies + ut
Where nfp is the log employment series, and n is the log census series.
The coefficient on n is 0.96, t-stat using robust standard errors of 94. The adjusted R2 is 0.99, SER = 0.0017.
I use this equation and the 2013M12 preliminary figure to establish the 2013M12 implied revised level of the establishment series, and then iterate using the establishment series up to 2014M04. I plot this series, and the reported establishment series, in Figure 2.
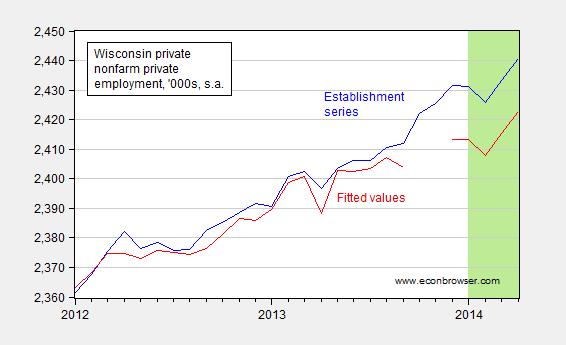
Figure 2: Private nonfarm payroll employment as reported in establishment survey, (blue), estimated establishment series based on QCEW (red), both, s.a., in 000’s. Green shaded area is iteration period (see text). Source: BLS, WI DWD, and author’s calculations (see text).
The difference is 18,000 in 2014M04.
It is interesting to consider what this implies for Governor Walker’s promise to create a net new 250,000 jobs by January 2015, reiterated as recently as last November [4].
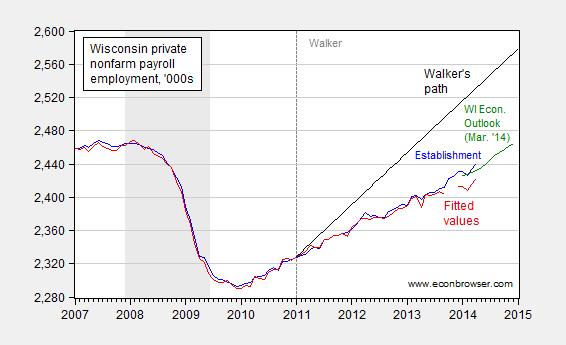
Figure 3: Private nonfarm payroll employment as reported in establishment survey, (blue), estimated establishment series based on QCEW (red), both, s.a., in 000’s, Wisconsin Economic Outlook forecast, interpolated from annual data (green), and Walker’s implied path. Source: BLS, WI DWD, Wisconsin Economic Outlook (March 2014), and author’s calculations (see text).
These calculations imply that, in order to attain the 250,000 new jobs goal, 22,078 jobs would have to be created each month, for the next 7 months (as opposed to 19,500 per month using the establishment series). Mean job creation has been 2,888/month, with standard deviation of 3,988, since January 2011. Even using the establishment series, the gap between the required monthly job creation rate and the average rate of job creation is 4.2 standard deviations. For 19,500 jobs to be created month after month for the next 7 months is therefore somewhat (!) unlikely.
It’s not surprising politicians make unrealistic statements. However, it seems, Wisconsin’s economy is picking up:
http://www.biztimes.com/article/20140425/ENEWSLETTERS02/140429843/BMO-report:-Wisconsin-economy-gathers-steam
I can understand why Walker is anti-union. For example, if labor is partially unionized, then union workers will be overcompensated and non-union workers will be undercompensated (which has historically been the case) , and the disparity may be very large. So, it’s unfair.
If all labor is unionized, it may lead to lower quality, more complacency, and fewer incentives, or more disincentives. It’s also unfair, because workers tend to be paid based on seniority rather than perfomance, which is often discouraged.
I think, raising the minimum wage is a much better way to reduce income inequality.
Slug,
One comment on why I post on this site. Most economics students are only exposed to one theory. Classical economics is mentioned in a footnote in freshmen texts, but then quickly ignored. My hope is that by posting here a challenging Keynesian dogma is students will search for economic truth on their own studying all of the available literature. Today it is good that real economics is now a stronger presence than when I took economics. I was shocked by one of my friends who received an economics degree from a major school in the 1970s and when we first started discussing economics he had never heard of Hayek or Mises.
I made good grades in macroeconomics in grad school but the claims never made sense to me because they made no sense in the real world. My study of alternative economic theories was the best thing I ever did.
All of the questions Keynesian theory could not answer simply fell into place. While all the highly educated economists simply can’t understand why our economy is struggling some of us understand clearly what is holding back production.
The Scientific Method of NeoClassical Economics is the dominant form of economics in the U.S., which includes Keynesian economics, i.e. the “Neoclassical Synthesis.” You’re talking about pre-20th century Austrian Economics.
U.S. per capita real GDP growth has been much faster after the Federal Reserve and Keynesian economics than before.
Average annual U.S. per capita real GDP growth
1913-2012: 2.04% (after Fed – 100 years)
1813-1912: 1.38% (before Fed – 100 years)
1936-2012: 2.38% (after Keynes General Theory – 77 years)
1859-1935: 1.26% (before Keynes General Theory – 77 years)
Source: Census data and the BEA.
Also, it should be noted, trade deficits subtract from GDP. Moreover, I’m sure, I don’t have to explain the power of compound interest.
I guess you’ve never heard, ‘Post hoc, ergo propter hoc.’?
I guess you never heard of anything that causes economic growth?
For example, economic boom/bust cycles (not to be confused with asset booms and busts) are inefficient both in the boom and bust phases, because of periods of strain and slack. They’re similar to feasts and famines or floods and droughts, to use some analogies. Sustainable growth is optimal growth.
The Fed has become increasingly better at smoothing-out business cycles, both short-term and long-wave, particularly, since the U.S. went off the gold standard. Before the Fed, economic boom/bust cycles were much more frequent and severe, resulting in suboptimal growth to a much larger extent:
List of recessions in the United States – Wikipedia
Recessions in the Industrial Revolution – 1871-1914
Period – Percent Decline of Business Activity
1873-79 – 33.6%
1882-85 – 32.8%
1887-88 – 14.6%
1890-91 – 22.1%
1893-94 – 37.3%
1895-97 – 25.2%
1899-00 – 15.5%
1902-04 – 16.2%
1907-08 – 29.2%
1910-12 – 14.7%
1913-14 – 25.9%
Recessions in the Information Revolution – 1982-2007
Period – Percent of Contraction
1990-91 – 1.4%
2001 – 0.3%
Peak, nice find on those numbers…
I read several chapters from a book regarding economic
growth in the 19th century. In fact, GNP increases during
this time was fortunate to exceed 1% per annum.
If you are suggesting, however, a nexus between GNP growth, the
FBR and JMK, your supporting evidence is very tenuous.
What’s the FBR?
Please, please Prof Chinn – choose another state and give WN a break?
Diversification is always desirable. Think of the rolling pleasures of Nebraska or the charms of Oregon?
There are evil Republican pockets galore to choose from or blue states that clearly could use some instruction – say, my own CT?
c thomson: Sure– exactly what state is WN?
WI – my goof – see how all those rust belt states run together – I was born in OH but escaped.