I was interested to take a look at our recent weak economic performance from a longer-term perspective.
The graph below plots private domestic fixed investment as a fraction of GDP for the United States going back to 1929, along with the median value for this fraction over the whole period. We always see investment fall as a fraction of GDP during an economic downturn. And in prolonged economic slumps– the Great Depression and its aftermath in the 1930s, and more recently the Great Recession and its aftermath– investment as a fraction of GDP remains significantly below normal for a prolonged period.
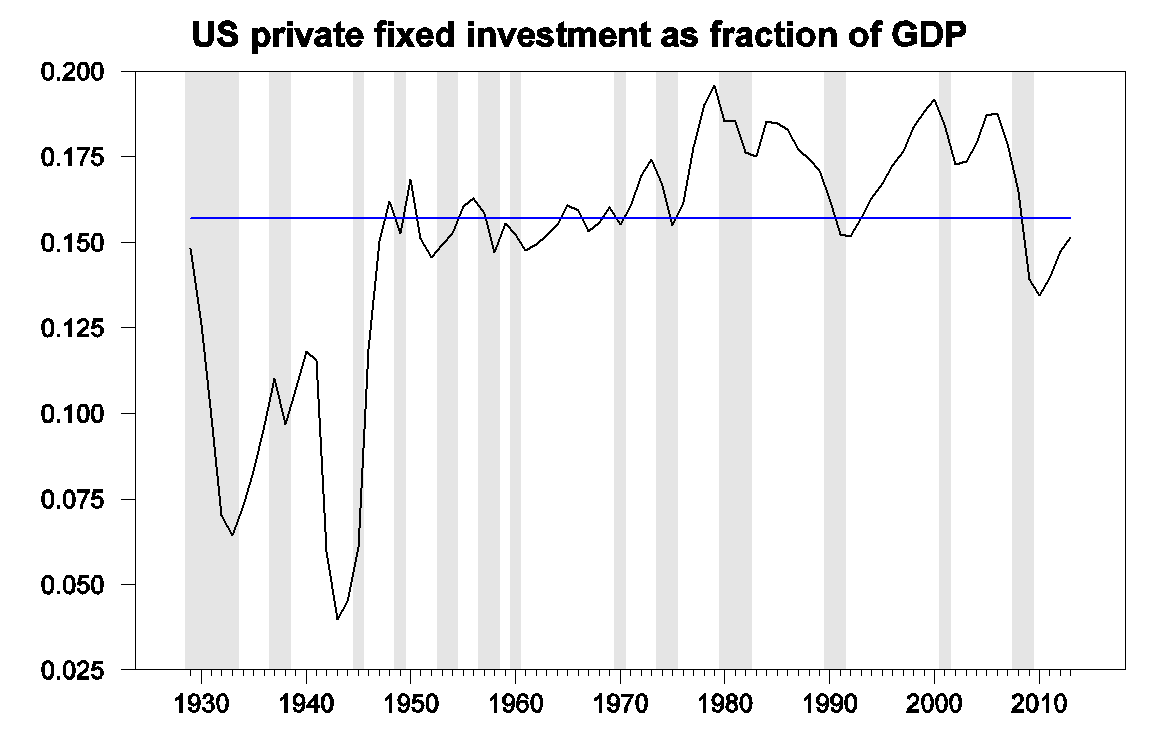
Nominal U.S. private domestic fixed investment as a fraction of nominal GDP, annually 1929-2013, from BEA Table 1.1.5. Horizontal line represents median value over the full period. Shaded regions indicate NBER dates for economic contractions.
Clearly the feedback runs in both directions. When the economy is doing badly, nobody wants to invest, and when investment is low, there’s that much less spending to contribute to GDP. Interestingly we see the same pattern in Japan. Japan’s anemic economy over the last two decades has been characterized as a prolonged period of below-normal investment spending.

Top panel: nominal Japanese investment as a fraction of nominal GDP, annually 1980-2013. Bottom panel: annual growth rate (measured as 100 times change in natural logarithm) of Japanese real GDP. Data source: WEO Economic Outlook Database.
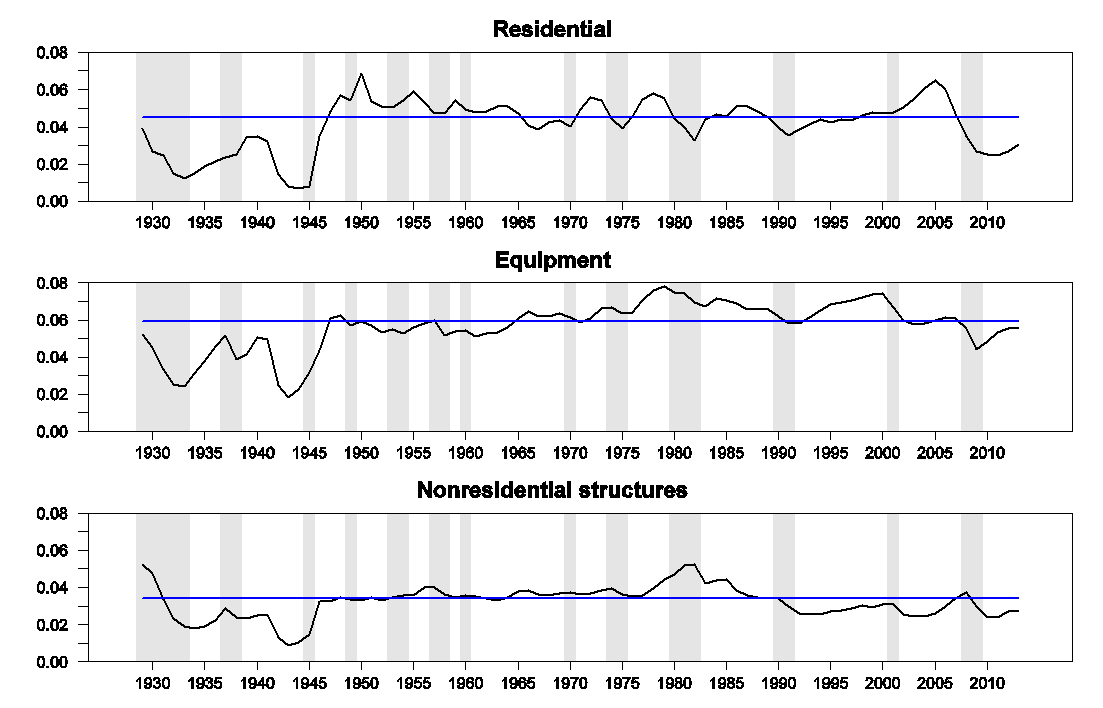
It’s interesting also to look at the individual components of investment. They each exhibit the same broad comovements with output, but with some idiosyncrasies. Notably, residential fixed investment accounted for almost all of the gain in investment as a fraction of GDP in the years just prior to the Great Recession. And in 2013, residential investment was still below normal as a fraction of GDP, and is the primary reason that investment overall remains lower than normal.
When there are no customers, for whatever reasons, a business won’t spend on inventories, hire workers, and expand.
In this “recovery,” the federal government hasn’t been effective in raising demand and reducing non-wage production costs.
We’ve had one foot on the accelerator and the other foot on the brake, resulting in an expensive and slow “recovery.”
Does “demand” even need to be raised? IMO, people need to let the Boomers and the economic accounting they brought……….go.
I am seeing alot of people struggling with this from a economic data accounting pov. The Boomers stop buying houses, then you aren’t going to build as many. Boomer’s remodeling like crazy, We have the home remodel craze. Gen X loves technologically driven gadgets, tech companies see nice boost and the Nas soars.
I think there is a massive misconception of the US economy right now. Econ-blogs try to analysis through the “Boomers” pov when they need to be analyzing from a different pov.
Income = GDP = output, and income = consumption + saving. So, both consumption and saving rise when GDP rises.
The U.S. economy is underproducing by about $1 trillion a year.
The aging of the Baby-Boomers destroys some potential output. Nonetheless, there are still over 20 million unemployed and underemployed Americans.
Many Baby-Boomers are working longer, while others who wanted to work longer were forced out of the labor force, since the economy peaked in December 2007.
Professor Hamilton,
How much do you think the residential investment ratio of GDP above the median is influenced by the relative increase in the numbers of people in age home-buying cohorts, such as the baby-boomers entering the home buying market about 1970?
Some have said when the private sector disinvests the government has to become the investor of last resort. We all know that anything the government invests in is not productive: See Iraq and the F35.
“The initial declaration of the military objectives of Operation Iraqi Freedom:
(1) end the regime of Saddam Hussein; (2) to identify, isolate, and eliminate Iraq’s weapons of mass destruction; (3) to search for, to capture and to drive out terrorists from that country; (4) to collect such intelligence as we can relate to terrorist networks; (5) to collect such intelligence as we can related to the global network of illicit weapons of mass destruction; (6) to end sanctions and to immediately deliver humanitarian support to the displaced and to many needy Iraqi citizens; (7) to end the Kurdish genocide; and (8) to help the Iraqi people create conditions for a transition to representative self-government.”
“On December 14, 2011, President Obama announced the end of the US war in Iraq with the words “We’re leaving behind a sovereign, stable, and self-reliant Iraq, with a representative government that was elected by its people. We’re building a new partnership between our nations.” These accomplishments encouraged President Obama to describe the final withdrawal of US forces as a “moment of success.””
JDH I think it’s a even a little worse than what your charts show. When I think about investment, I prefer to think in terms of the net addition to the capital stock. The GDP numbers include both replacement of depreciated stock and net new investment of capital stock. The BEA tables tell us that 50 years ago the private capital stock depreciated at around 2.0%-2.5% per year. Lately that number has been drifting upward and is now around 4.5% per year. So a given amount of gross investment as a percent of GDP generates less net new capital stock as a percent of GDP than it did 50 years ago.
The capital stock, in general, is undervalued compared to the past, because its more durable and more productive.
It’s only from an accounting standpoint how the capital stock depreciates.
The productive or real value after depreciation is much higher.
Of course, there are exceptions. e.g. some software.
No, the reason depreciation is longer now is that information technology equipment has a much shorter life span than traditional capital equipment.
Actually I think it’s much better than the charts show. The charts in the post show nominal investment as a fraction of nominal GDP, however the relatvie prices of investment goods have been falling for the last 30 years or so (http://faculty.chicagobooth.edu/brent.neiman/research/LabShare.pdf). If you take real private investment (excluding residential) as a percentage of real GDP you find that it’s actually historically relatively high (though below the peaks of the last 2 bubbles).
It’s only really residential investment that is relatively low.
I agree. You should chart real business investment as a share of real GDP.
It tells a very different story.
The difference stems from both falling prices and a shorter life span for IT equipment before it is obsolete.
We are having to run faster to stay at the same place.
Looks mostly Baby Boomer driven. Now we are correcting to “normal”.
Dear Econbrowser,
Thanks for this small note on investment slumps and your interest in Japanese economy.
Unfortunately, the Japanaisation seems to be underway in everywhere, in Europe in particular, but even in the US as well.
Incidentally, Abenomics is bound to fail, and we are unfortunately going back to the old Japanisation with another investment slump.
The second quarter GDP for Japan due to be released on Wednesday this week would show miserable state of the economy.
It seems to me that idea such as the one on investment slump matters a lot in economics as Keynes put it in his last chapter of the General Theory.
Regards,
Tomo Nakamaru
One way to look at the required gap-filling spending of the government is to aim it to maintain cash flows to capital assets, thus to forestall their abandonment in a slump. And by supporting ROI, new capital investment can also be maintained.
Two observations.
On graph 1 “US private fixed investment as fraction of GDP” it is interesting to note that in almost every instance there is an investment decline in anticipation of the recession. In the beginning of the artificial boom, fixed productive investment increases significantly as the monetary “stimulus” deludes producers because of illusory over-consumption. As the artificial boom turns to bust the productive segment then experiences the decline first.
On the residential graph, when nominal interest rates are forced below the natural interest rate, there is over-consumption in interest sensitive segments such as real estate creating an artificial boom (bubble). After the bust consumers who were over-extended on their loans are unable to qualify for new loans so continued low nominal interest rates have limited impact on consumption. Government efforts to “stimulate demand,” via monetary expansion and lower interest rates, do nothing to heal the credit of consumers, at best lowering requirements makes the credit problem worse. Without solvent consumers any monetary “stimulus” flows to non-productive financial instruments and companies: hedge funds, money markets, monetary reserves, and brokers.
Essentially, government policies are simply perpetuating the causes of the crisis and preventing recovery.
BTW, nice graphs and a good topic. Thanks for inclusing Japan.
As a pure aside, I cannot over-emphasize how big the risks to the oil supply are just now.
sounds like an excellent argument for greater emphasis on renewable energy sector!
Baffs –
Let me size the numbers involved.
In a decent month, the US generates about 170 trillion btu’s of power from wind. This is the equivalent of about 3 million barrels per month; that’s about as much shale oil as we produce in a day.
By the end of the decade, shale oil is the US is forecast to generate 6 million barrels per day.
That is, wind today is providing about 1.6% of the energy that shales will in 2020. It is 60 times greater than total US wind production today. And that’s just US shales.
Mea culpa. Trouble with zeros.
142 trn btu’s of wind power per month (2014 average) translates into 27 million barrels, so about 8 days of shale oil production in 2014, and a day and a half of US oil consumption. Actually, that’s an appreciable number. Shale oil will grow faster, I think, but even four or five days equivalent of shale oil production per month would be a notable effort.
steven, wind will grow more than you think. not really fair to compare 2014 wind capacity with 2020 shale predictions. they will not grow in the same manner. but in the long run, you need to remember wind infrastructure produces a perpetual source of energy, while shale wells have a finite lifetime-or so recent data on this blog suggests. i do not advocate replacing oil stock immediately, but as you have pointed out repeatedly oil can be a unpredictable drag on the economy. as a point of policy, it makes no sense to continue policy that makes such an energy source central to our energy security when we are developing other sources. renewables are the future and will eventually overcome the vested interest in fossil fuels. would you rather live in a world run by oil or renewables?
I’d rather live in a world with a higher standard of living.
I am indifferent as to what powers my transportation. It comes down to safety, convenience and cost. Since the 1920s, oil has been the fuel of choice, as it scored high on all of the categories above, but at some point, it is a depleting resource.
Windmills have a finite lifespan. They use up land. Pollute water. Cause health problems. Explode. Are diffuse and require maintenance, require backup (IIRC, Germany had to increase coal production and dump power into the ground so it could be brought online on demand, though our access to nat gas power should prevent this necessity)…
They are nowhere near economical. They’re just a boondogle for GE.
aaron, basically everything you stated is meaningless.
“Windmills have a finite lifespan.” everything has a finite lifespan. you don’t think coal and nat gas plants don’t have a finite lifespan and maintenance requirements? then again with wind i will not run out of fuel source.
“They use up land.” Unless it is displacing a better opportunity, not sure why this is an issue? everything takes land. you think a coal plant and coal mine don’t disrupt land and environment?
“Cause health problems. Explode.”
alarmist rhetoric. they are as safe as any other industrial application. in fact, i have an office within 100 yards of a wind turbine.
“require backup”
everything requires backup. and as we modernize our electric grids (they need it for a variety of reasons) and improve storage capacity, your argument becomes archaic.
aaron, there is not a single shred of accuracy in your insinuating comments.
Article which supports what Steven Kopits has been writing about for a couple of years now:
Oil and gas company debt soars to danger levels to cover shortfall in cash
http://www.telegraph.co.uk/finance/newsbysector/energy/oilandgas/11024845/Oil-and-gas-company-debt-soars-to-danger-levels-to-cover-shortfall-in-cash.html
Interesting piece, thanks Jeffrey. Great quote from Steven!
I have observed upstream companies taking on far greater debt burdens in recent years. All-in expenses pay-out ratios for oil exploration and production companies have also grown noticeably. Presumably due to cheap debt.
As a result, I expect an increase in financial-issue driven M&A activity, and in the longer run, higher real oil prices.
I am intrigued by this notion that productivity has fallen steeply. It suggests where output price growth outstrips growth of all costs, that productivity in a key sector can plummet while per capita real incomes grow. A resource weighted economy like Canada’s can experience increases in per capita real wealth and real income while productivity stagnates or grows very slowly weighed down by negative productivity performance in the resource sector.
In other words, a resource-weighted economy where policy makers are rent maximizers could easily exhibit stagnant or negative productivity growth as a result of collectively rational decisions.
Mr Brown, what would be the results of all of those E&P firms
spent no more monies on cap ex and just pumped goo until
it was depleted?
Would they recovery their investment?
It depends. Some would, and some wouldn’t (and of course assume oil price makes a big difference), but Steven could probably give you a better answer.
In any case, as I have periodically noted, despite the trillions of dollars spent on global upstream expenditures since 2005, actual global crude oil production (45 or lower API gravity crude oil) has probably been at or below the 2005 rate since 2005, while global natural gas production and associated liquids (condensate and natural gas liquids) have so far continued to increase.
Deindustrialization, financialization, feminization, Peak Oil (peak net energetic flows per capita), Seneca effect, Boomer demographic drag effects, too much debt to wages and GDP (debt-deflationary regime), high fixed costs to wages, profits, and gov’t receipts of complex, high-tech infrastructure, and permanent structural fiscal constraints, i.e., “austerity” for the bottom 90%+.
Net annual flows to the financial sector exceeds the growth of nominal value-added output per capita. Growth of debt no longer contributes to growth of real final sales per capita.
The high price of oil and lower-quality, costlier substitutes no longer results in an increase in total liquids per capita since 2005-08.
Total gov’t spending, private medical spending, and debt service combine for an equivalent of 50% of GDP. The gov’t sponsored medical and banking cartels render labor prohibitively costly (including self-employment) to deploy profitably. The economy can’t grow with the costs of gov’t, medical insurance, and debt service costs, but the economy can’t grow without these sectors growing.
Add the marginal effects of Peak Oil on oil consumption as a share of final sales, and real final sales per capita are stuck at 0% since 2007-08.
The professional middle class next 9% after the top 0.1-1% are in deep denial about the structural deterioration of the US economy’s productive capital stock and capacity to sustain living standards, having internalized, and become dependent upon, the parasitic rentier values of the top 0.1-1% and the residual income and financial wealth flows from the rentiers.
The top 0.1-1% are hoarding 40%+ of financial wealth at no velocity and being taxed on any gains they take at less than earned income of the bottom 99%, which is a debilitating regressive disincentive for production and employment while encouraging no-velocity, non-productive financial speculation, hoarding, tax avoidance, increasing wealth and income inequality, and the increasing capacity of the top 0.1-1% to buy laws that maintain the status quo at the expense of productive economic activity and domestic productive capital accumulation.
As an economist, state this publicly and one’s credibility, job, tenure, and worse, and be labeled a neo-Marxist or class warrior loser.
Unfortunate.
Just a hunch, but I suspect policies inspired by papers like this one (with its reliance on scary tales about fiscal deficits and CB balance sheets) aren’t going to help spur investment: http://www.nber.org/papers/w19297