Instead of a 0.2% q/q increase as in the WSJ survey, GDP declined 0.4% [0] [1] It’s pretty bad news, but here are a couple of observations, following up on my previous post on Japan.
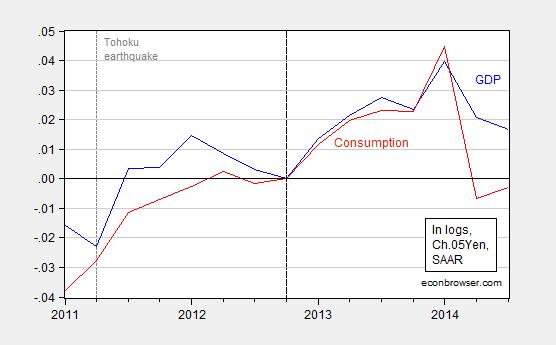
Figure 1: Log GDP (blue) and consumption (red), in Ch.05¥, normalized to 2012Q4=0. Source: Cabinet Office, and author’s calculations.
First, the drop is in output is definitely not a positive development. However, the good news is that the negative news should certainly solidify support for delaying the second part of the consumption tax increase. It should also rein in resistance to the expansionary monetary policy pushed by BoJ Governor Kuroda (well, I’m guessing — I’m not an expert on the intricacies of the BoJ).
What I find interesting is that exports, while not increasing much in the third quarter, have risen since the end of 2012. Assertions that the yen’s depreciation has not had a big impact on exports seem overdone to me (although it might be that one expected more growth in exports).
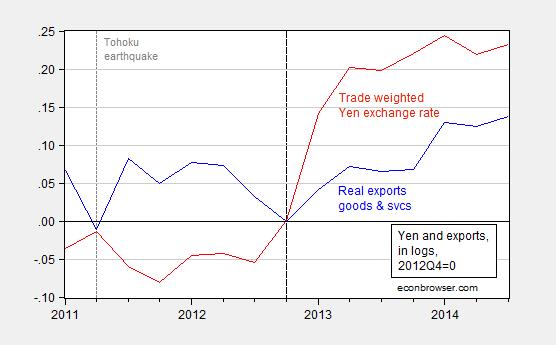
Figure 2: Log exports of goods and services in Ch.05¥ (blue), and log broad-basket trade weighted real yen (red), both normalized to 2012Q4=0. Upward movement in yen exchange rate is a depreciation. Source: Cabinet Office, BIS, and author’s calculations.
Export of goods and services in real terms have risen about 13.8% (log terms) since 2012Q4, while the yen has depreciated by 23.2%, on a trade-weighted, real terms, basis. That’s a ratio in changes of about 60%, not too far off my estimate of 0.66 long run elasticity of goods exports (see this working paper). Whether export behavior is in line with my estimates is not clear, since I have not factored in growth in Japan’s trading partners, which should have also pulled along exports.
Amiti, Itskhoki and Konings argue that the failure of goods exports to respond fully (at least through 2013) is because, based on their empirical work on Belgian firms, large exporters tend to be large importers, so that the yen depreciation has increased exporter marginal costs, thereby offsetting to a substantial degree the expansionary effects. I’m not sure how much that argument applies, as exports have grown measurably with the addition of 3 quarters of data.
One thing working in favor of future trade balance improvement is the recent decline in oil prices (particularly if combined with the restarting of nuclear power plants early next year [2]).
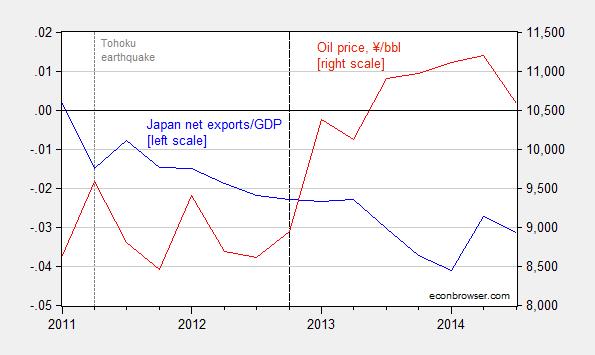
Figure 3: Net exports as a share of GDP (blue, left scale) and oil price in ¥/bbl (red, right scale). Yen oil price calculated as Brent oil price in USD multiplied by JPY/USD exchange rate. Source: Cabinet Office, FRED, and author’s calculations.
A final observation. Advance estimates of GDP are more than other releases “estimates”, so one might wonder how likely a positive re-assessment is. Unfortunately, Japanese GDP estimates have tended to be revised downwards over time (2 years out) [3] (Figure I.4). Thus, with the addition of more information, the drop might be larger in the end. That makes the case for expansionary monetary policy that much stronger.
More on the implications for policy from Jake Schlesinger/WSJ.
Update, 11/19, 10:30PM Pacific: BoJ rebels switch over to back extended easing in FT today.
“However, the good news is that the negative output news should certainly solidify support for delaying the second part of the consumption tax increase. It should also rein in resistance to the expansionary monetary policy pushed by BoJ Governor Kuroda”
I suspect reaching the Krugmanian endgame of persistent large deficits funded by pure monetization will be better for Austrian economists than it will be for the Japanese people.
Compared to the years when Japan operated on a supply side model cutting taxes almost every year (1950s) Japan is a total basket case. I have been really been surprised by two countries in our modern world. First, the French has some of the greatest economists in world history and they choose to follow the teachings of an Englishman (they hate the English, LOL) and a German who moved to England. They should rediscover their French economic greatness.
The second is Japan. The Japanese have a history from the end of WWII well into the 1970s of massive growth. Yet, now the Japanese choose to follow policies that have brought them nothing but problems. And now the enter their third recession!!!
The French and Japanese can be a lesson to us all.
I suggest you compare France with Germany.
While Germany has followed what conservatives would call the ” correct ” policies and France followed “bad” policies there really has been no significant differences in their economic performance.
Spencer wrote: “While Germany has followed what conservatives would call the ” correct ” policies and France followed “bad” policies there really has been no significant differences in their economic performance.”
Germany has a balanced budget and with 0.2% population growth a GDP growth of around 1%, in addition Schäuble can reduce the debt/GDP ratio by 2.5-3% per year, i.e. there are around 2% additional income like reduced interest payments or selling of stuff acquired in 2008/9.
France still has a “growth” that is financed by debts.
In conclusion, you may argue that the German approach to reduce debts in 2013-2018 is stupid, here I would aggree to a certain extend, however, to claim that both economies have the same performance only tells me that you use stupid reference points.
Wow! That’s a big set of intellectual blinders you packing. Spencer points out, quite rightly, that by most measures, France is doing just about as well as Germany. Your answer is to completely beg the question. (I’m relying on you to know the final meaning of “begging the question” here.)
The issue at hand is whether Abe’s program is good policy. Spencer’s comment was in response to Ricardo’s (inevitably) misguided comparison of France and Japan. To claim that Spencer is using a “stupid reference point” because France is using fiscal policy – when fiscal policy is the issue in question – is a classic logical failure by Ulenspiegel.
It is really hard to have a reasonable discussion when people who either don’t have any grasp of the facts (Ricardo regarding French economic performance) or don’t understand how to make a valid argument (Ulenspiegel) keep hor ning in with their nonsense. My guess is, preventing reasonable discussion is their goal.
OK, I am not an economist, only a stupid chemist and the fun part of my work is analysis and discussion of hard spectroscopic data. 🙂
Hence, I have real problems to understand some arguments:
If you use change of GDP as reference then France is of course doing as well as Germany, that is undisputed.
However, this growth is fueld by an increase of debts in France- In contrast, in Germany we see an accumulation of reserves by decreasing debt.
Now you can answer the very interesting questions: Is this for Germany really bad fiscal policy, check the changes of labour force? Would a change to more spending by the federal government be really beneficial for Germany (for neighbours of course!)? What is the projection for the next 5 years? Is France able to reach a sustainable situation?
I simply dispute the out of context use of GDP and your contribution has not improved the situation.
Macroduck,
I am still waiting for an substantioal contribution from your side. Ad hominem does not count.
What are the hard numbers that show an equal performance in Germany and France, besides your uncritical use of GDP?
Since the implementation of the Hartz Reforms, German GDP has growth by 13.5% while France’s has grown by 8.2%.
France’s net debt continues to grow by 1.3% of GDP (although on trend, this will stop in 2015); Germany is reducing its net debt by 3% of GDP per year. Further, German net government debt amounts to 48% of GDP; France’s, 85% of GDP. Germany could stop consolidating today, if it wanted to. France has a good decade of consolidation before it.
My post on the matter is here: http://www.prienga.com/blog/2014/11/23/the-hartv-iv-reforms-germany-vs-france
Ricardo wrote (with my help):
Compared to the years when the United States government used a marginal tax rate above 90% to promote growth with massive infrastructure investments (1950s), the U.S. is a total basket case.
I’ll take Misinformation by Menzie’s Folly (aka Ricardo) for $140, please:
The answer is: Extreme Cherry Picking
What is one of Ricardo’s favorite methods for pretending that his assertion is supported by data?
You are correct!
I would like to take this comment out for sushi, and then, perhaps, a Kurosawa retrospective!
While we’ve seen a bifurcation of the labor market (though that’s universal across the OECD?), open unemployment remains low, housing is improving bit by bit, anbd after a couple decades 1% growth in the context of a falling population adds up. I don’t see much evidence of distortions from very mild deflation, either — lock-in from real estate prices dropping, but that is more population decline and gradual logistics improvements / manufacturing decline that frees up urban tracts, and hence strikes me as independent of CPI deflation. Plus metropolitan real estate prices are up a bit.
At the same time the GDP news is out, the (Japanese-language) press is noting the best labor market for new-school-leavers in a decade. The first GDP release is in any case volatile, and I’ll want to see more details as the drop is not consistent with the other tidbits I see scanning Nikkei and Yomiuri and Toyo Keizai. Teaching China this term and next, while working on auto industry projects so I’ve not been reading the news closely or perusing data of late. A quick scan of the BOJ monthly indicators (Oct — that for Nov should be out any day) has nothing suggestive of recession beyond the expected bounce in consumer durables pre/post the tax increase. Indeed, the rise in “regular” employment is the strongest in a long while, consistent with the reports of how college students are faring. As for the next tax increase, it will be a smaller increment … but I’m still puzzled why such changes aren’t done as a series of 0.5 percentage point semi-annual bumps over 2 years instead of a one-time bump of 2 percentage points.
demographics is destiny
Governance is destiny. Or more precisely, culture is destiny.
If you’re running a Malthusian model (and a demographic line of argumentation is Malthusian), then population expands to the proximate binding constraint. If you have more resources, population will grow.
In practical terms for the US, this will have two meanings. First, expect labor force participation rates to recover notably during 2015. Second, a large wave of illegal immigration will also start in 2015. If the jobs are there, people will figure out how to fill them.
And whom did you hear it from first?
http://www.bloomberg.com/news/2014-11-19/wages-poised-to-rise-as-signs-emerge-of-improved-u-s-job-market.html
The Bloomberg article finds wage growth in areas where hydrocarbon extraction is a big deal. Big deal. It quotes Sandi, who is a decent economist, but also among the most reliable economic optimists. Solid evidence of wage acceleration just isn’t there.
By the way, Blomberg’s news room was among the leaders of the “Uh Oh, inflation” gang in 2011 and 2012. Much of there economic reporting simply took an acceleration of inflation for granted. That Blomberg now anticipates wage acceleration is not all that encouraging.
Wage growth in hydrocarbons has been rampant since 2005, with a brief respite in the recession. We will now see falling wages, in fact, in oil extraction. What do you think the merger of Hallliburton and Baker Hughes tells us?
If wage trends continue (and, of course, they might not), we will see wage inflation by the middle of next year. I have not changed my view.
Spencer,
You are totally wrong. France attempts to lead the economy of the EU but there is no doubt that Germany is in charge. But I think you make a mistake by not going back in time far enough to see how Germany developed its capital base that has supported its economy since. After WWII Germany rejected the US and socialist German advice to engage in Keynesian policies for recovery. Erhard abolished rationing in favor of the market system that led to the following exchange with U.S. General Lucius D. Clay, military governor of the U.S. zone.
Clay: “Herr Erhard, my advisers tell me what you have done is a terrible mistake. What do you say to that?
Ludwig Erhard: “Herr General, pay no attention to them! My advisers tell me the same thing.”
Then later in an exchange with Colonel Oberst on the same issue
Oberst: “How dare you relax our rationing system, when there is a widespread food shortage?”
Erhard: “But, Herr Oberst. I have not relaxed rationing; I have abolished it! Henceforth, the only rationing ticket the people will need will be the deutschemark. And they will work hard to get these deutschemarks, just wait and see.”
Based significantly on the work of Wilhelm Röpke, Erhard did all the “wrong things” by Keynesian standards and led the German people to what has been called the “German Economic Miracle.”
An excerpt from the Library of Economics and Liberty:
“Along with currency reform and decontrol of prices, the government also cut tax rates. A young economist named Walter Heller, who was then with the U.S. Office of Military Government in Germany and was later to be the chairman of President John F. Kennedy’s Council of Economic Advisers, described the reforms in a 1949 article. To “remove the repressive effect of extremely high rates,” wrote Heller, “Military Government Law No. 64 cut a wide swath across the [West] German tax system at the time of the currency reform.” The corporate income tax rate, which had ranged from 35 percent to 65 percent, was made a flat 50 percent. Although the top rate on individual income remained at 95 percent, it applied only to income above the level of DM250,000 annually. In 1946, by contrast, the Allies had taxed all income above 60,000 reichsmarks (which translated into about DM6,000) at 95 percent. For the median-income German in 1950, with an annual income of a little less than DM2,400, the marginal tax rate was 18 percent. That same person, had he earned the reichsmark equivalent in 1948, would have been in an 85 percent tax bracket.
“The effect on the West German economy was electric. [Henry] Wallich wrote: “The spirit of the country changed overnight. The gray, hungry, dead-looking figures wandering about the streets in their everlasting search for food came to life.”
“Shops on Monday, June 21, were filled with goods as people realized that the money they sold them for would be worth much more than the old money. Walter Heller wrote that the reforms “quickly reestablished money as the preferred medium of exchange and monetary incentives as the prime mover of economic activity.”
“Absenteeism also plummeted. In May 1948 workers had stayed away from their jobs for an average of 9.5 hours per week, partly because the money they worked for was not worth much and partly because they were out foraging or bartering for money. By October average absenteeism was down to 4.2 hours per week. In June 1948 the bizonal index of industrial production was at only 51 percent of its 1936 level; by December the index had risen to 78 percent. In other words, industrial production had increased by more than 50 percent.
“Output continued to grow by leaps and bounds after 1948. By 1958 industrial production was more than four times its annual rate for the six months in 1948 preceding currency reform. Industrial production per capita was more than three times as high. East Germany’s communist economy, by contrast, stagnated.”
Superficial analysis leads to bad conclusions.
“In 1958, an 81% marginal tax rate applied to income of $140,000 and the 91% rate at $400,000 for married couples, which would correspond to income levels about eight times higher today.” [My emphasis]
“In the same year, roughly 10,000 of the nation’s 45.6 million tax filers had income subject to a rate of 81% or higher.”
An FAA proposal from Eli Duardo of CATO:
Incentive Pay for Congress: http://www.cato.org/publications/cato-online-forum/incentive-pay-congress
This is a pretty feeble defense of incentive pay, timid and lacking in deeper theoretical justification, but at least someone is writing about it.
Duardo’s of Mercatus; he was writing on Cato’s online forum.
I’d be a little less peeved about this if I had not submitted a proposal on the topic to Mercatus a few months back.
My take’s here: http://www.prienga.com/blog/2014/11/20/shell-and-exxons-most-important-rd-initiative
“Governance is destiny. Or more precisely, culture is destiny.”
Wrong. No amount of culture or goverance can make a population of 50% old people sustainably produce large amounts of GDP.
Please. In the 1950s, men in the US retired on average at the age of 69 when life expectancy was 63. (The last six years were a really tough.) Men now retire around the age of 62 with a life expectancy of 77. Oh, poor us!
Let’s stop whining and get back to work.
The key cultural attribute associated with success, I think, is internalizing responsibility for one’s own situation. In those cultures where people whine about being constrained by other people’s actions or lack thereof–those are the societies that struggle to get ahead.
Correction: life expectancy for men in 1950 was 66; in 2007, it was 75.
steve, you need to remember you have a cushy job where you sit at a desk under controlled climate most of the day. it is easy to think all the world is that way, and we should continue to work into our twilight years. good for you, you were one of the lucky ones. but there are plenty of hard working people who did not enjoy the benefits you did throughout life. they participated in manual labor, often times in the harsh outdoors. there must be a reasonable limit to their working lives, since they do not sit at a desk in the comfort of climate control. just asking you to keep in perspective the entire spectrum of the working class.
I understand that, Baffs, and I do sympathize with what you’re saying.
At the same time, the average retirement age for men was 69 in the 1950s, when the share of manual wages jobs was much higher than it is today. In principle, it should be much easier to work until 69 today than it was in 1950 for most people. But I do understand what you’re saying. Working in manual construction, for example, at the age of 69 would be pretty rough.
steve, you are falling for survival bias. as you stated, life expectancy was 66 and average retirement age was 69 in the 1950’s (taking your numbers as accurate-i did not validate, sorry). most men keeled over before they ever retired. just like today we have longer life expectancy, but that is mostly a result of limited early childhood deaths. many folks still do not make it out of their 60’s.
facsinating Steve, but this thread is about Japan. Now prove your point by starting a business and only recruit your employees from the nursing home. Thanks buddy!
If you’re going to argue that a nation that has an average age of 55, certus perabus, is going to outproduce the nation with the average age of 35, I think we can just end our conversation now.
Anon –
Japan is a very difficult nation to interpret.
Given that unemployment rose on 1.5% in the Great Recession there, one has to suspect that there is substantial hidden unemployment in Japan. Are there reserves in Japanese employment, in terms of productivity? I suspect there are and that they may be substantial.
But let’s not forget that Japan has been running an average 6.5% government budget deficit for twenty years. Twenty years! You really think a country can do that with no macro ramifications? The last time the US had really impressive growth–under Clinton–the budget was coming into balance and government spending was falling. But you’re arguing, gee, look at endless, massive Japanese deficits–clearly they’re neutral for growth! Personally, I don’t think they are.
So, demographics are an issue. They certainly are in Japan. But there are other issues, too, and they may be much more important.
We could also argue about Europe. Take Italy or France. Italy has 23 fewer people of working age employed that does neighboring Switzerland. 23! You could power a decade of growth just off getting those people back to work! And that’s all labor market policies, as Germany has shown. http://www.prienga.com/blog/2014/10/31/employment-to-population-ratio-detail
So what’s the objective function of government? If you’re from the left, it’s about maximizing current consumption through distribution subject to the politically minimum acceptable GDP growth rate. Everything is about lowering expectations for economic growth. Thus, all the conversations are about exploring our impotence, about why we can’t do anything about anything without either running massive deficits or juicing from the Fed. The truth is, when you start digging in the numbers, you find plenty of decision variables and examples of how other countries have prospered using different policy approaches.
If you want a high degree of dependency in a society, you pay people to be dependent! If you don’t pay them to be dependent, guess what, they’ll work. So let’s start there. If we fix that, demographics is the least of our problems.
Steven Kopits: “1950s, men in the US retired on average at the age of 69 when life expectancy was 63. (The last six years were a really tough.) Men now retire around the age of 62 with a life expectancy of 77.”
Once again Steven demonstrates his innumeracy. Recently it was his inability to read a simple line graph. This time it is his poor grasp of statistics. His numbers are completely nonsensical.
Steven is confusing life expectancy at birth with life expectancy at retirement age. The large increase in life expectancy at birth is due to the reduction in infant mortality. It has nothing to do with retirement age. Simply because children now survive whooping cough as a 1-year-old is not an argument that everyone needs to work longer.
The real issue is the life expectancy at retirement age, 65. That has increased by only 5 years in the last 5 decades. Further, for the 50% in the lower income bracket, that number has increased by only 2 years in the last 5 decades.
It is really embarrassing that someone who presumably makes his living with numbers has such a poor grasp of the subject. I suspect that is it not because he is stupid. I suspect is is because his political agenda causes him to be careless.
You’re confusing innumeracy with laziness. I was too lazy to look up the right graph.
So, I take your point. We live five years longer and retire seven years earlier.
Now, everybody back to work.
Steven Kopits There are some problems with your post. First, it looks like you used retirement ages based on Social Security data. You should know that those numbers are biased upwards for the 1950s for several reasons: (a) the minimum retirement age was 65 back then; (b) a much smaller percentage of the male labor force participated in Social Security; (c) many people retired under private pension plans and those folks are censored from the SS data. Also, there’s some survivor bias in the SS data because only those who lived were able to retire, and those who are less healthy or had more demanding jobs tended to die before retiring. Those who did reach 65 tended to be the healthier stock with the least demanding jobs. Survivor bias. It also matters a lot whether you use the mean or the median retirement ages because the curve is so skewed. There is less difference between now and then if you look at the median ages. You also get slightly different numbers if you use the BLS labor participation rates to derive the implied retirement ages. BLS relies upon CPS data to estimate the implied retirement. All that said, it is true that people are retiring earlier today than they did 65 years ago. That should be a good thing to be celebrated. The bad news is that the gains in conditional life expectancy have been mainly by those in the upper income brackets. The conditional life expectancy for those towards the bottom of the economic ladder have not improved all that much….some, but nothing like what we see with high income folks.
The rest of what you said just confuses aggregate demand and supply issues. Japan certainly has structural economic problems on the supply side; but to the extent that those are binding problems today we would expect to see inflation. We don’t see inflation. Instead we see deflation and disinflation. That should tell you that the problem for the last 20 years has been weak aggregate demand, not a steeply vertical supply curve. The fact that Japan has been running big fiscal deficits does not mean they are borrowing money in order to live beyond their means. Japan is not eating its seed corn. Over the last several decades Japan has been running strings of current account surpluses and then strings of current account deficits. But most of the government borrowing is being financed by the Japanese themselves. Government deficits provide the safe financial assets that the Japanese are demanding. Absent private sector investment demand, just where do you expect the Japanese to park their savings? Under the mattress or futon? The time to worry about Japan’s structural problems is when the Japanese economy is straining to increase output because of strong demand.
NO, NO, NO.
In the 1950s whether or not you had a private pension did not matter, you got social security regardless of you private pension.
Retirement was suppose to be a three legged stool — private pensions, social security and personal savings.
spencer I think you misunderstood my post. Yes, you got SS regardless of whether or not you had a pension, IF and ONLY IF you first qualified for Social Security. According the BLS only 60% of the labor force qualified for Social Security. Today it’s virtually universal. So when Steven Kopits relies upon Social Security data for mean retirement ages, he is excluding 40% of the workforce for 1950. Those people did retire, but they just had to fall back on resources other than Social Security.
Spencer
You are exactly right, in the 50’s, it was a three legged stool. But that was before the one leg, the SS leg, gobbled up the other two legs by increasing taxation, starving out the ability of the other two legs to function effectively.
Ed
i thing both of them are bad http://www.topbagsaaa.com/
Even more than in the U.S., Japan’s growth depends on a strategic marketing and sales stimulation of consumer buying, rather than classic monetary and fiscal efforts, which are ineffectual given the Japanese consumer’s 20% of gross income savings rate. Japanese consumers possess plenty of demand firepower to generate upside “final demand” GDP growth and in turn final demand drives the rest of GDFP. For example, the approximately 25 million Japanese two-person (often two-earner) households on the average saves about $972 per month out of a gross income of $4760 (2013 data) from Japans statistical yearbook. Additionally, Japanese households own about $14 trillion in financial assets (plus real estate assets). Using 2013 average monthly GDP “final demand” of $89.5 billion2013 “final demand” as base data, the needed year one 3% increment from “base” equals $7.5 billion per month, 1, $15.1 billion in year 2, $23 billion in year 3, etc. Attaining the third year objective (9% increase over base period) means inducing each of 50,000,000 households to spend an average of $624 additional each per month. Japan has used two generic tools to induce higher consumer spending, one being negative, the shock of a 7% sales tax, and the other being couponing. From a marketing and sales perspective, implementing the phase 1 7% national sales tax increase squandered the opportunity to create the steadier inducement for buying that would come with a quarter-by-quarter or even month-by-month rollout. Indeed, the entire complex effort to creating hard to predict “inflate on” could have been replaced by fixed tax increments. Also, Japan had a moderately successful but onetime experiment with couponing in 1999 that generated about 620 billion yen (about $5.6 billion) of final demand for “nondurables,” but with no follow through. See “Did Japan’s shopping program increase spending?” by Chaing-TaIeh (the answer was yes) in the Journal of Public Economics. The Japanese couponing experiment in 1999 barely touched the surface of modern couponing with respect to technology utilization and coupon program design – e.g., “Groupon” opportunities were certainly not then accessible. It also foucused on goods” even though the majority of growth opportunities are in services. A more recent independently developed proposal for use of “couponing” in the U.S. is found at http://www.economicplanforamerica. From an “enterprise” perspective (Japan as an economic enterprise, the U.S. as an economic enterprise, China, etc.) growth depends on the consumer and, in Japan and the U.S. and some portions of China, the people and households who we count on for growth do not “need” money, they need the “stimulation” that comes from marketing and sales inducements to consume. The principal “reform” that Japan and China need that the U.S. does not is to increase consumption not only in absolute terms, but as share of GDP. When the “market” economy became dominant, it brought the consumer and marketing and sales to the fore, so one needs to think of economic growth as a marketing and sales opportunity.
Steven Kopits
November 21, 2014 at 1:15 pm
You’re confusing innumeracy with laziness. I was too lazy to look up the right graph.
So, I take your point. We live five years longer and retire seven years earlier.
Now, everybody back to work.”
No you don’t quite get it. The percentage of the population that is OLD is dramatically different. I hope this helps.