The external sector weighs in, and thinking about the length of the recovery.
First note the contribution of exports and imports to growth (in an accounting sense), in percentage points.
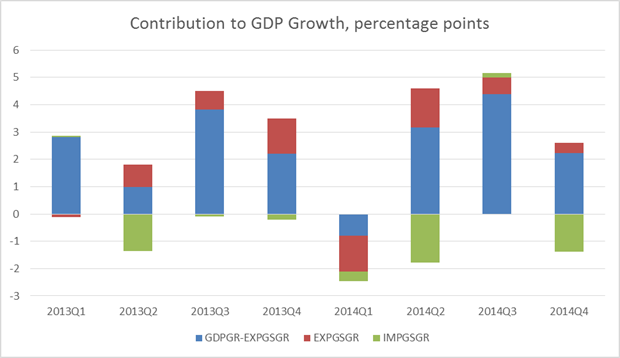
Figure 1: Contributions to real GDP growth, in percentage points of imports (green), exports (red), and all else (blue), all SAAR. Source: BEA 2014Q4 advance release, and author’s calculations.
Instead of having an essentially net zero impact in the third quarter, import growth contributed -1.4 percentage points (annualized). To the extent that the higher growth in imports represents greater consumption in anticipation of a sustained recovery, the news is good. The slowdown in export growth is not helpful, on the other hand. The evolution of real exports and imports is shown in Figure 2.
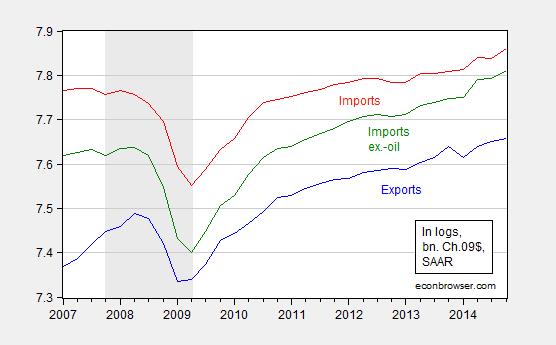
Figure 2: Log real exports (blue), imports (red), and imports ex.-oil (green), all SAAR, bn. Ch.09$. Source: BEA 2014Q4 advance release, and author’s calculations.
Some of this is due to an appreciated dollar; I read a lot about the impact of the stronger dollar, but it’s important to keep in context the appreciation thus far.
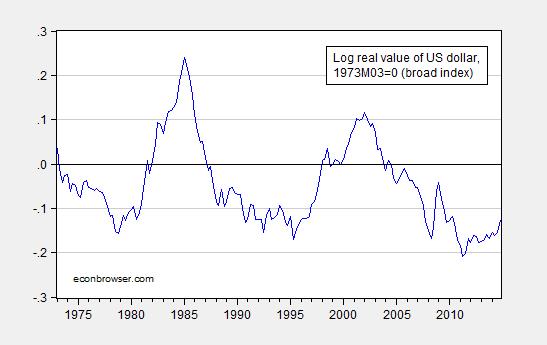
Figure 3: Log real value of the US dollar, against a broad basket of currencies, 1973M03=0. Note 2014Q4 observation is average of October and November. Source: Federal Reserve Board via FRED, author’s calculations.
So, in the absence of a continued substantial appreciation, one shouldn’t worry about the recovery being derailed on this account alone — unless US goods have become much more substitutable for foreign in the past fifteen odd years. That could be the case. (More here).
On the other hand, Deutsche Bank, in its forecasts released today, argues the dollar is only halfway through its appreciation from the July 2011 trough (FX Forecasts and Valuations, January 30, 2015).
Hence, I do think that the Fed should take into account external developments. To the extent that expansionary monetary policy in the Eurozone and Japan put upward pressure on the dollar’s value, it doesn’t seem problematic to counter that effect by going slow on tightening monetary policy. This is particularly true given the absence of inflationary pressure in headline inflation, and modest growth in labor compensation as indicated in todays employment costs release.
The other observation I have on the GDP release pertains to the length of the recovery. The last recession ended, by the NBER’s reckoning, in June 2009. That means that by the end of 2014 (assuming a recession had not already begun), the recovery has now lasted 66 months. To place this in perspective, I show the length of the current recovery in a graph from an article in the Economist nearly two years ago.
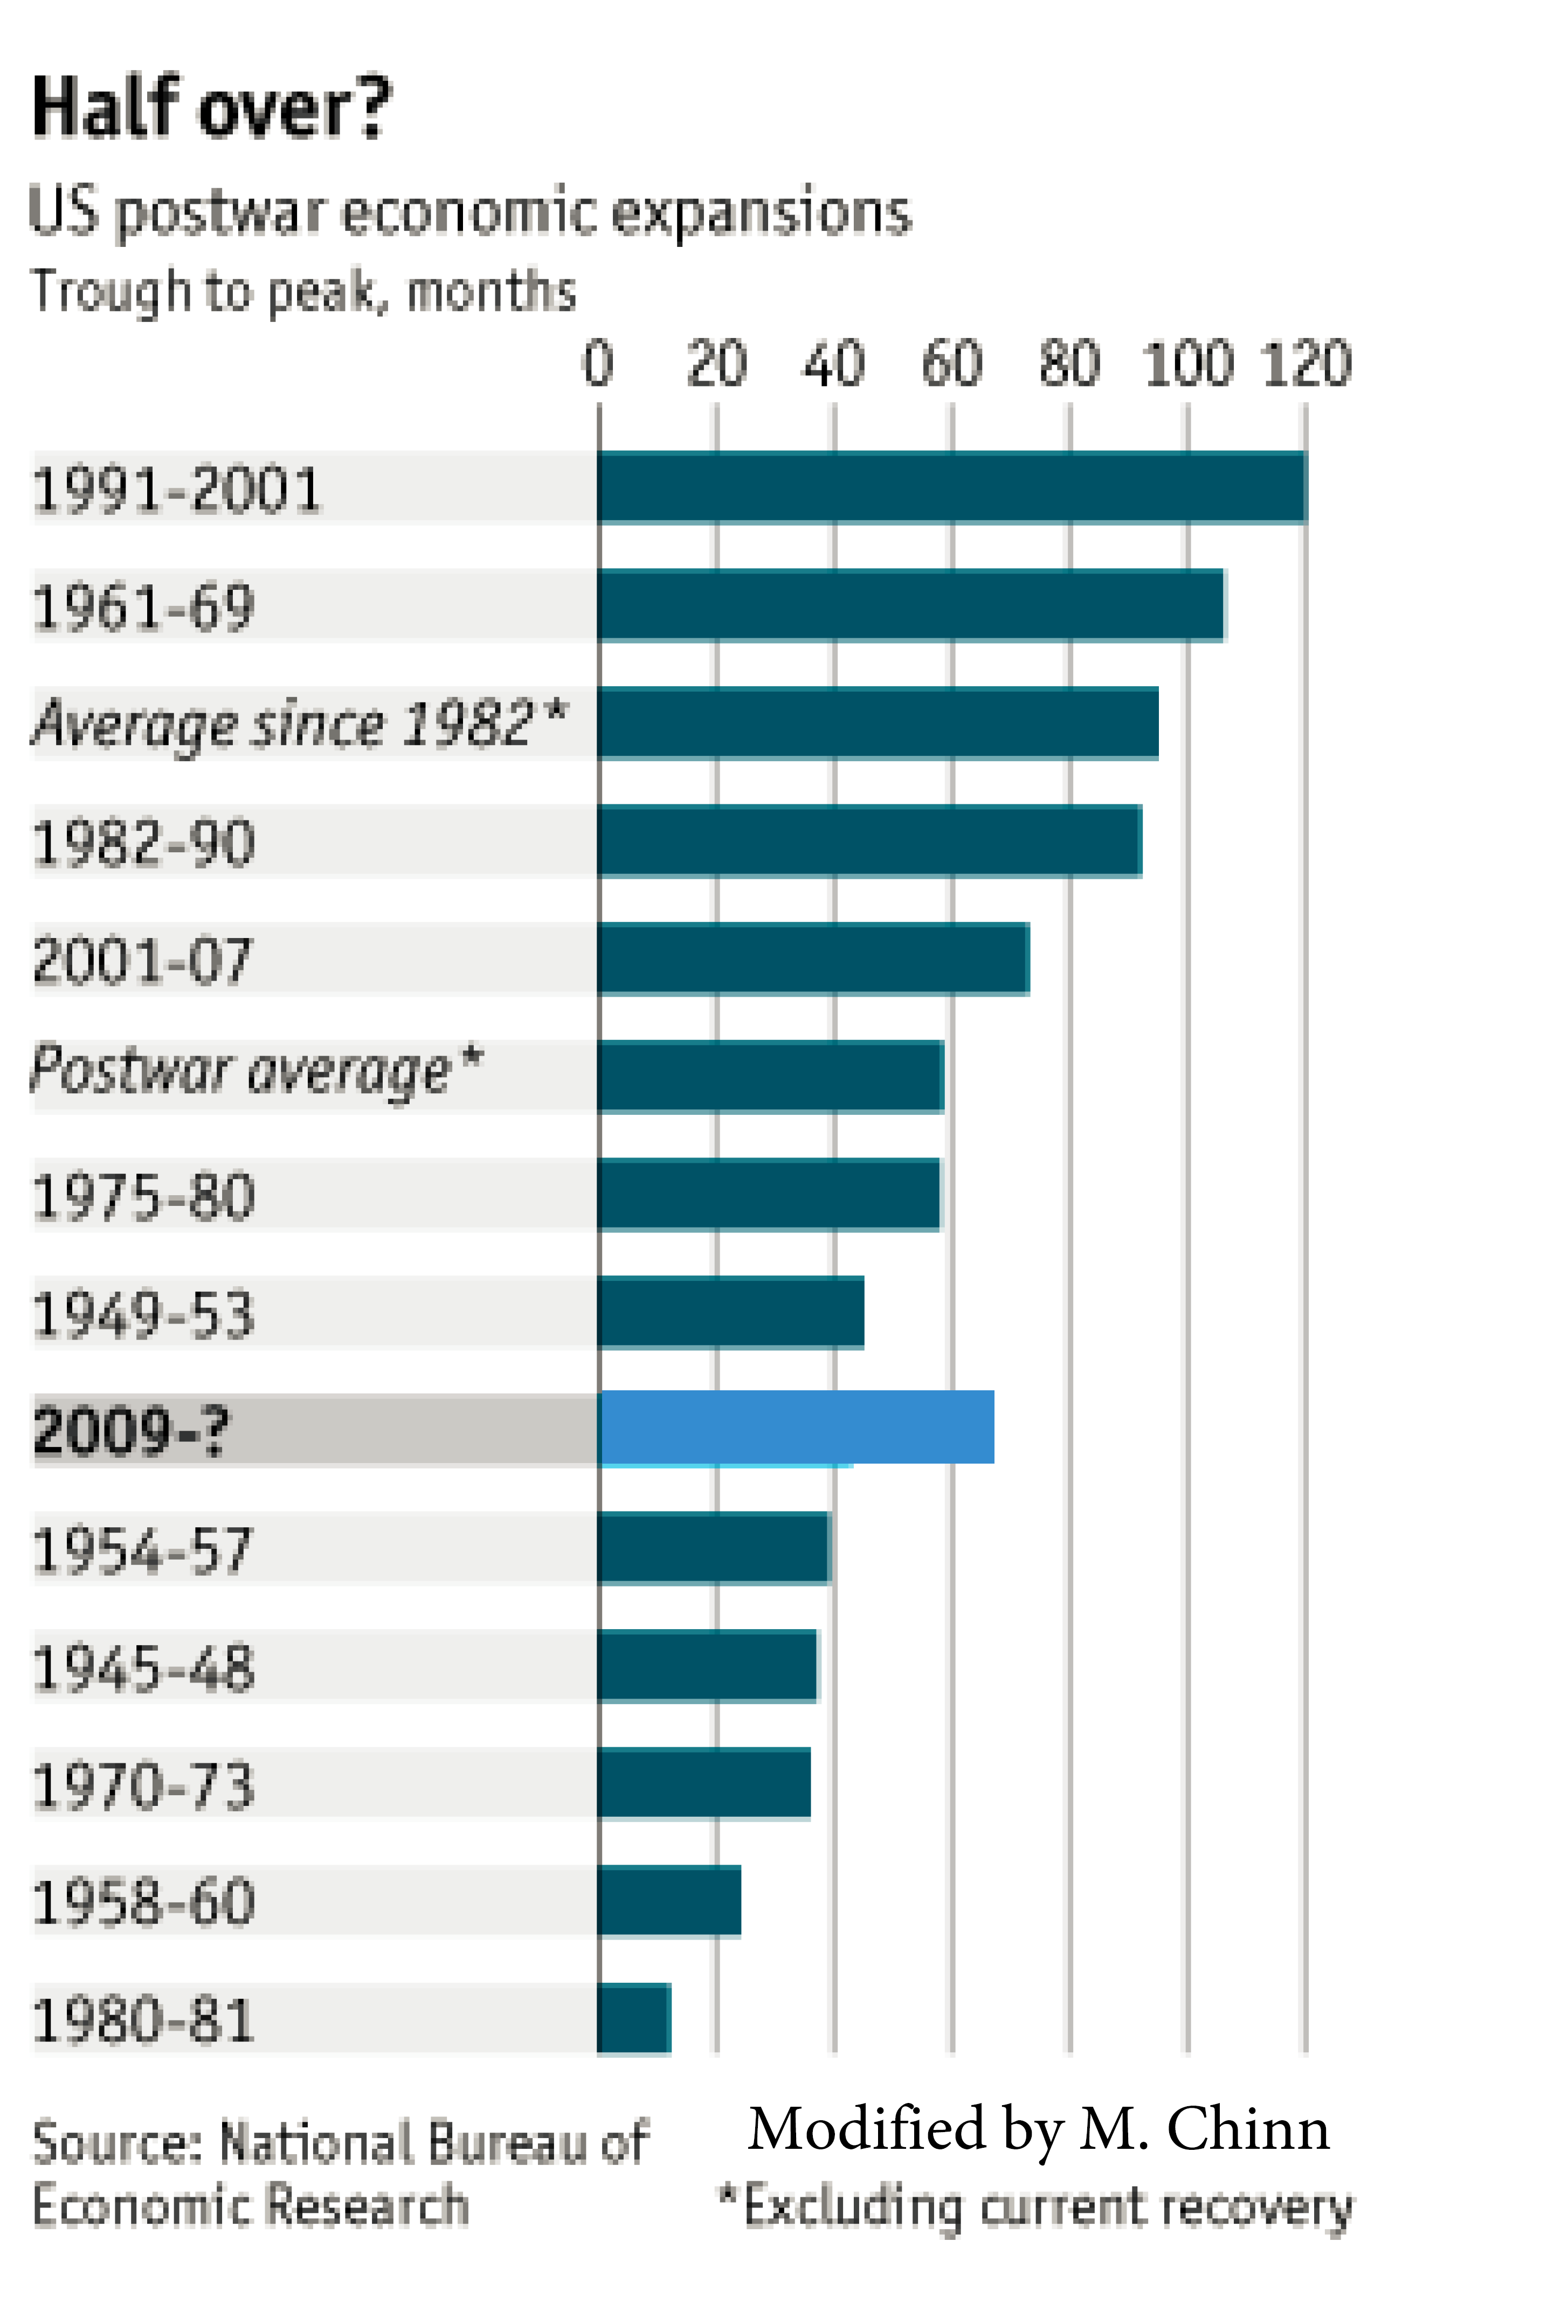
Figure 4: Graph, adapted from “Business Cycles: Running out of Time?” Economist (January 2013).
What the (updated) graph shows is that by the standards of post-1982 recoveries, this recovery has not yet matched the duration of an average recovery. Hence, some (but by no means all) of the anxieties expressed in the Economist article have been allayed.
Now, this is a somewhat mechanistic way of thinking about recovery duration. One should also think about shocks from abroad (Euro area, China), but without knowing if and when such shocks might strike, then one can think about what usually ends a recovery — and there it often seems to be a tightening of monetary policy. That’s yet another reason to worry about over-eagerness in tightening, especially as the dollar appreciates.
Fortunately, for now, the yield curve is not signaling a recession in the next year [1].
For more on the release, see CR, and Furman/CEA.
I don’t like the GDP because it measures spending not production but it is just about the only thing we have today. What is the current recovery’s average GDP compared to other recoveries. It simply makes no sense to compare the length of a recovery that crawls along the bottom held up only by government spending and exports-imports versus a robust recovery that is actually building wealth. Citizens do not feel like we are in a recovery because their neighbors may not be classified as unemployed but they are not working.
GDP is domestic output.
Janet Yellen – January 2009
“Typically, recessions occur when monetary policy is tightened to subdue the inflationary pressures that emerge during a boom. This time, the cause was the eruption of a severe financial crisis.”
My comment: However, the recession began in December 2007, when the economy peaked.
Restrictive monetary policy likely caused the recession initially (e.g. Bernanke trying to prove he wasn’t an “inflation dove”). The Fed Funds Rate was too high for too long.
Yet, the Fed deserves a lot of credit for easing the money supply starting in September 2007, while oil prices continued to surge to $150 a barrel by mid-2008, and Bush deserves a lot of credit for the tax cut in early 2008, to give the Fed time catching-up, after falling behind the curve, and putting the economy on the path to another mild recession, until Lehman failed in September 2008, which caused the economy to fall off a cliff.
Much better economic policies out of Washington would’ve resulted in a much stronger recovery.
The Fed could’ve began a tightening cycle in 2010.
“until Lehman failed in September 2008”
peak, what lead to the demise of lehman? why did they fail?
Lehman collapsed because they couldn’t borrow overnight.
Mike: And why was Lehman unable to borrow short term?
Lehman failed, because it took too much risk to make too much money during the housing boom and then lost too much money during the housing bust.
“Lehman’s demise made it the largest victim of the U.S. subprime mortgage-induced financial crisis that swept through global financial markets in 2008. Lehman’s collapse was a seminal event that greatly intensified the 2008 crisis and contributed to the erosion of close to $10 trillion in market capitalization from global equity markets in October 2008.
Lehman’s high degree of leverage – the ratio of total assets to shareholders equity – was 31 in 2007, and its huge portfolio of mortgage securities made it increasingly vulnerable to deteriorating market conditions.
Cheap money…found easy prey in restless bankers – and restless borrowers who had no income, no job and no assets.
According to 2007 news reports, financial firms and hedge funds owned more than $1 trillion in securities backed by these now-failing subprime mortgages – enough to start a global financial tsunami if more subprime borrowers started defaulting.”
Menzie,
According to the post-mortem, performed by Jenner and Block, Lehman collapsed due to poor managerial decisions, excessive risk and failure of regulators to anticipate and mitigate the outcome.
Mike: Well, I’d like to put it into economic terms; Lehman leveraged up in part due to the failure of regulators (SEC) to require higher capital ratios. In other words, illiquidity was likely due to perceived insolvency. On whose watch did the leveraging occur?
Q4 GDP Per Capita Drops to 1.9%
January 30, 2015
“…the Advance Estimate for Q4 2014 real GDP came in at 2.6 percent down from 5.0 percent in Q3. Real GDP per capita was lower at 1.9 percent, a decline from 4.2 percent per capita in Q3.
Updated Chart:
http://www.advisorperspectives.com/dshort/charts/indicators/GDP-per-capita-overview.html?Real-GDP-per-capita-since-1960-log.gif
One economist, basically, sees the domestic economy as an engine that normally fires on four cylinders:
1. Inventories.
2. Employment gains.
3. Consumer spending growth.
4. Residential construction.
The relatively weak cylinder is residential construction.
Charts:
http://www.census.gov/briefrm/esbr/www/esbr020.html
http://research.stlouisfed.org/fred2/series/HOUST
No, GDP does measure production, not consumption. But it does it indirectly. It measures consumption and adjust that for trade and inventories to indirectly estimate production. By measuring only final demand it avoids the difficulty of avoiding double counting– from iron ore to steel to autos.
Over the last 20 quarters — 2010 to 2014 –trade made a positive contribution in only eight quarters. Given the strength of the dollar and stronger growth in the US then abroad one should expect trade to be a negative for growth as we go forward. Cumulatively, since 210 the net contribution of trade has been negative.
Mc Bride is right, relax. and good night.
“Fortunately, for now, the yield curve is not signaling a recession in the next year [1].”
And the yield curve WILL NOT signal a recession during a debt-deflationary regime of the Long Wave, which we have been in since 2008, and Japan has experienced since 1998-2001.
The Fed WILL NOT raise rates in a debt-deflationary regime. The 10-year yield will presage the secular trend rate of nominal GDP below 2% in the years ahead, implying the US 10-year yield at 1% or below.
The difference this time around is the hyper-financialization of the economy, unprecedented central bank intervention to purposefully bail out TBTE banks, prop up equity prices and thus avoid a debt-deflationary contraction (for now), and to fund fiscal deficits via crediting primary dealer banks’ balance sheets with whatever liquidity is necessary, irrespective of merit or the destination of the liquidity.
But the purposeful reserve printing by the central bank and pumping of asset bubbles with labor’s share of GDP at a record low is resulting in worsening wealth and income inequality from hoarding of overvalued equity assets as a share of wages and GDP, causing money velocity to continue to decline, and a prohibitive rentier claim by the top 0.001-0.1% to 1% on wages, profits, and gov’t receipts for social goods effectively in perpetuity, i.e., total annual net flows to the financial sector and its owners equaling or exceeding total GDP output forever.
The mathematical reality is that the central banks and TBTE banks can only postpone the debt-deflationary contraction and clearing of the decks against wages and GDP, so to speak, of the Long Wave debt-deflationary Trough, not prevent it. When the collapse does occur from one or more predictable precipitants, larger this time than than the 2008-10 contraction given the netted derivatives leverage to bank capital, the institutions that grew in legitimacy, influence, and power since the 1910s-30s and 1970s will be challenged to the point of being discredited, resulting in a mass-social loss of faith in the affiliated institutions, including the Fed, fractional reserve banking, TBTE banks, i.e., gov’t-sponsored, impossibly leveraged hedge funds, neo-Keynesian/neo-classical/neo-liberal economics, economists, Wall St., equities as “investments”, the tax code, and the legitimacy of the rentier Power Elite to rule over the bottom 99.9%.
The vacuum left by the loss of faith will provide the opportunity for the warrior caste to assert its organization, authority, and mass-social confidence during a time of deepening crisis. History and human nature suggests that the warriors will first be co-opted by the rentier-financier, parasitic acquisitor caste and their apologists and enablers, who will in time be recognized and acknowledged as non-productive, parasitic, extractive costs to the masses and society’s larger objectives, and then be exposed and overthrown by the warrior caste, for better or worse.
Make friends with the ambitious members of the imperial military officer corps, scientists, engineers, technicians, programmers, gear heads, architects, techno-savvy artists, systems thinkers, ecologists, biophysical economists, etc., but not economists, banksters doing G-d’s work, CEOs, lawyers, hedge fund managers, and establishment mass-media influentials.
Thanks for the analysis, one of all too few taking to account the external importance of persistent low rates.
My only quibble is that he Fed must keep interest rates at zero not just while the dollar is appreciating, but, the world being Keynesian, where the dollar “rules the roost,” until European recovery is well under way also.
So much time is wasted overanalyzing q-on-q data. It’s noisy. Look at the quarter on same quarter of previous year. The trend has not changed much.
True Tom- GDP growth has largely been between 2.5-3% year-over-year for since the end of 2011. That’s not bad at all. I agree that increased imports could be a bit of a drag, but I figure that’ll be offset by lower inflation due to lower oil/gas prices.