Today, we are fortunate to present a guest contribution written by Laurent Ferrara (Banque de France, Head of the International Macro Division) and Clément Marsilli (Banque de France, Economist at the International Macro Division). The findings, interpretations, and conclusions expressed in this article are entirely those of the authors. They do not necessarily represent the views of the Banque de France.
The International Monetary Fund (IMF) provides in its bi-annual World Economic Outlook (WEO) report estimates of world GDP growth that are considered by experts in the field as benchmark figures when aiming at monitoring the global economy. In fact two wide exercises are carried out by the IMF each year in April and October, while two updates, which are light exercises, are released in January and July. All the WEO reports contain the annual world GDP growth for the current year (referred to as nowcast) and for the next year (referred to as forecast).
The latest update of the IMF WEO report has been released on the 20th of January 2015 and can be downloaded from the IMF web site. The salient fact of this report is that global GDP growth in 2015-16 has been revised downwards by -0.3pp both years, from 3.8% to 3.5% in 2015 and from 4.0% to 3.7% in 2016. Those revisions are mainly due to weaker than expected prospects in China, Russia, the euro area and Japan. It is noteworthy that the US is the only major economy to be revised upwards. Facing a huge oil price drop (more than 50% since June 2014) oil exporting countries have also been largely revised downwards.
Because of the downward revision for the two upcoming years, many comments have underlined the pessimistic view of the IMF as regards the global economy. However, a global economic growth of 3.5% this year is not especially low. For example, the World Bank is less positive than the IMF and anticipates a global economic growth at 3.0% in 2015 (see the forecast table). In fact, over the recent years, it turns out that the IMF was rather over-optimistic as regards their forecasts of global economic growth. Some of the reasons lying behind this bias are well described in the Chapter 1 of October 2014 WEO (see Box 1.2 p. 39).
It must be pointed out that nowcasting global economic growth is a huge challenge for economists. The main issue with those IMF-WEO nowcasts is that they reflect annual growth rate and are released on a quarterly basis, while obviously economists have at disposal a large set of data on the world economy available on a higher frequency (monthly, weekly or daily). Against this background, when aiming at nowcasting global growth on a high frequency basis (e.g. monthly), one faces two main issues: (i) a data-rich environment and (ii) a discrepancy between annual GDP figures, on the one hand, and monthly information, on the other hand.
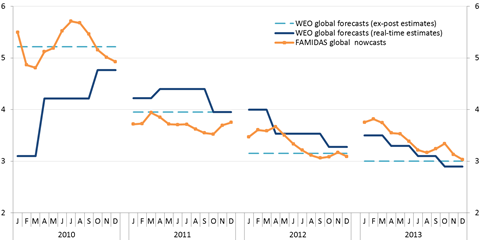
In a recent Banque de France working paper we propose a new tool to address those issues and hence to evaluate contemporaneous global GDP growth in real time. Our methodology combines the Mixed Data Sampling (MIDAS) technology, which enables the use of high frequency data to forecast a variable sampled at a lower frequency (see here or here), with the factorial analysis as a reduction dimension technique (see here or here). Therefore the Factor-Augmented MIDAS modeling is twofold. In a first step, we aggregate a large monthly database including 37 countries and various sectors of the global economy into a small numbers of factors that summarizes the information. Then, in a second step we nowcast the annual world GDP growth rate using the monthly factors within the MIDAS framework. Our approach focuses on nowcasting the GDP growth figure of the current year from eleven months ahead, corresponding to January, up to the zero horizon, i.e. December. We evaluate our approach in an empirical exercise based on global output nowcasts of the IMF-WEO over the post-crisis period from January 2010 to December 2013. Our global growth monthly estimates of the current year are compared with those stemming from the successive releases of IMF-WEO reports (see Figure 1).
Figure 1: Comparisons of ex-post GDP growth estimates (dotted light blue) with real-time IMF-WEO nowcasts (dark blue) and nowcasts stemming from our Factor-Augmented MIDAS model (orange) from 2010 to 2013.
The results presented in Figure 1 show that the Factor-Augmented MIDAS approach provides reliable and timely nowcasts of the world GDP annual growth, especially at the beginning of each year when few information about the current year is available. The monthly update of the nowcasts constitutes a pertinent indicator of the world economic activity and efficiently tracks, on a high frequency basis, the global growth.
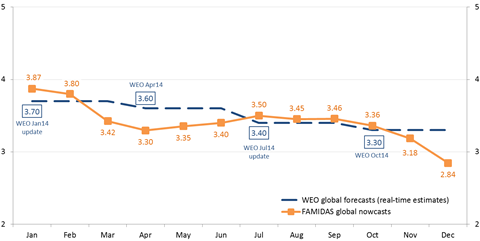
When looking at 2014 (see Figure 2), it turns out that our global growth index provides a good match over the year, with a decline at 3.3% in April, due to the weak data flow for the global economy in the first quarter of the year, mainly related to unusual weather conditions, especially in the US. It is striking to observe that the flow of data at the end of the year (November and December) implies a decrease in global growth nowcasts, due to a sequence of poor economic data in many parts of the world.
Figure 2: Monthly evolution of IMF-WEO real-time nowcasts of global GDP growth for 2014 and of our Factor-Augmented MIDAS model.
Last, the first estimates of global growth for 2015 that we get from our nowcasting model point to a slower growth than expected by the IMF WEO update of January. Indeed the estimates (computed using data available beginning of March) are of 2.8% for January and 3.0% for February. Those estimates are strongly influenced by the flow of weak economic data that we received over the last weeks but the estimate is likely to pick-up with upcoming data expected from Europe. However, we cannot exclude at this stage that the global economic growth in 2015 may be lower than 3.5% as expected by the IMF, in spite of the shot in the arm due to low oil prices and a booming US economy.
This post written by Laurent Ferrara and Clément Marsilli.


In 2013, who could’ve predicted that in 2014, oil prices would fall sharply, there would be sanctions on Russia, a much stronger U.S. Jobs recovery would take place, etc.?
It is noteworthy that the US is the only major economy to be revised upwards.
It is noteworthy to see where the US growth has been occurring. http://www.bea.gov/iTable/iTable.cfm?ReqID=51&step=1#reqid=51&step=51&isuri=1&5114=q&5102=5 Just one line on this table (15). And look where it has not been increasing (7).
Can you say “House of Cards”?
Bruce Hall: Well, we are almost — but not quite — back to the share of 7.7% recorded in 2005Q4, according to your source. So, I think I know what time period is better characterized by “House of Cards”.
Touché.
Longer time periods often shed additional light, which in this case shows a rather distinctive shift from manufacturing to supplier of raw materials. http://www.bea.gov/iTable/iTable.cfm?ReqID=51&step=1#reqid=51&step=51&isuri=1&5114=a&5102=5
… and a very slow normalization of the work force http://www.advisorperspectives.com/dshort/charts/employment/Full-Time-vs-Part-time-16-plus-since-2007.gif
… which may be suppressed further as the health care insurance industry enjoys its continued ascendancy (presuming the SCOTUS does not determine certain subsidies illegal) http://www.cbo.gov/sites/default/files/cbofiles/attachments/45010-breakout-AppendixC.pdf
… which may be why there is a perception that the recovery is not as strong as might actually be.
Now let’s look at line 15 relative to Congress in 2010. http://www.motherjones.com/politics/2010/09/congress-corporate-sponsors
Just a coincidence?
Odd how finance and insurance companies benefited from “new deal” legislation then.
I watch the CRB:Index of Raw Industrial Materials prices as it has about a 0.9 correlation with world industrial production.
But that data is available daily.
It also has a very good record as a leading indicator of oil prices — a couple of months lead.
Spencer, good observation. Note also that the long cyclical (Juglar) CRB has broken below the uptrend line since the early 1990s, suggesting a Juglar-cycle decline that could last into decade’s end or the early 2020s.
I would also invite you and other readers to look at US real per capita disposable income less household debt service and “health care” (“illth care”) spending, which provides a useful insight into why the price of oil has crashed since summer ’14, retail sales, mfg. orders, revenues and profits, and the cyclical change rate of the ECRI WLI have decelerated or declined, and why IP is likely to decelerate below 3% YoY, i.e., the historical recessionary “stall speed”, hereafter.
The primary inference is that US households’ income after the cost of rendering unto Caesar, the “rentier tax” to the rentier top 0.001-1%, and “illth care” costs received by no more than 5-10% of the population is no longer sufficient to permit growth of real GDP per capita.
Moreover, the lack of growth might not avoid real per capita, after-tax contraction of household income and a resumption of the increase in the fiscal deficit, which thus implies that the talk of the Fed raising the reserve rate is just that: talk, i.e., “forward giddiness”.
Thus, I anticipate that the Fed will NOT raise the reserve rate hereafter, and that the Fed will be directed by the TBTE banks to resume QEternity/QEverywhere in the perpetual attempt to prevent contraction of M3 and nominal GDP per capita.
http://research.stlouisfed.org/fred2/graph/fredgraph.png?g=14eI
I forgot to include a related chart pertinent in support of the foregoing point.