U.S. retail gasoline prices last week averaged over $2.80 a gallon, thirty cents higher than a month ago. The preliminary University of Michigan index of consumer sentiment for May was 88.6, down 7 points from the month before. Are these two developments related?
The consumer sentiment index is plotted in black in the graph below with units on the left scale. The negative of the gasoline price in real terms (deflated using the CPI) is shown in blue, with units on the right scale. I have plotted the negative of gasoline prices to help highlight the negative relation between the two series– when gasoline prices go up (a fall in the blue line), consumer sentiment goes down (a fall in the black line). Consumer sentiment had been improving steadily as gas prices fell (or the blue line rose) last autumn. Since gas prices came back up, sentiment has tumbled.
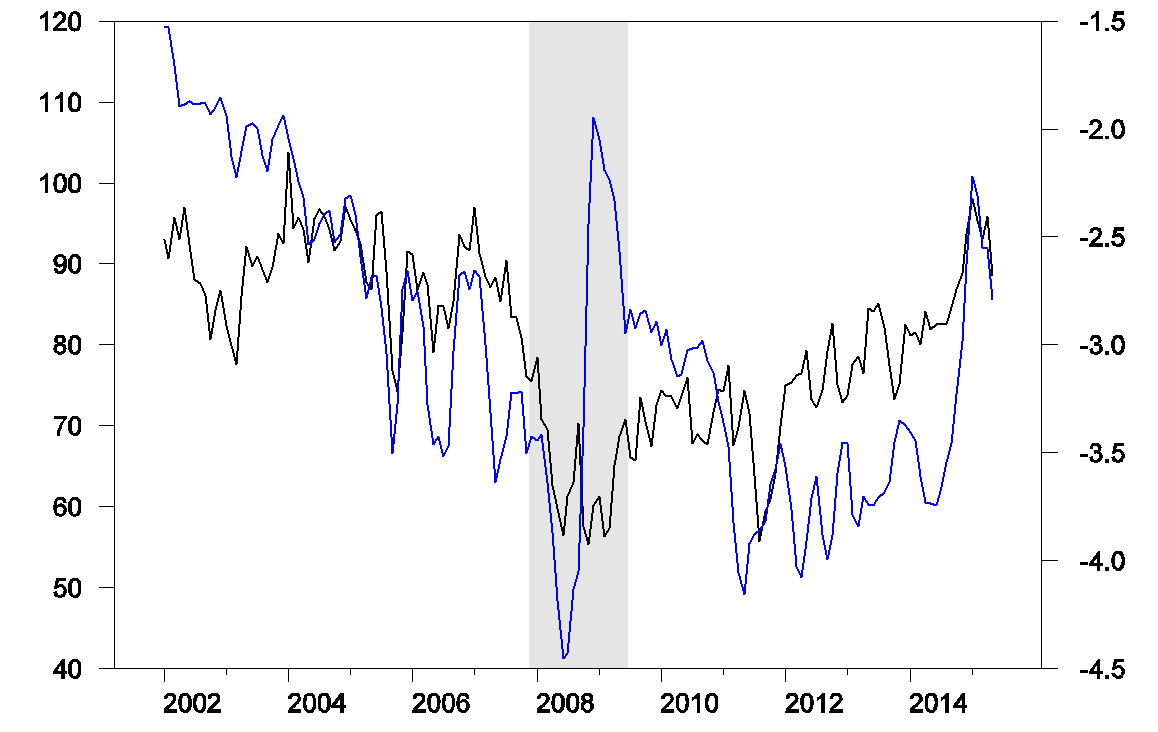
Black: University of Michigan consumer sentiment, 1978:M1-2015:M5 (May 2015 is preliminary estimate, scale is on left). Blue: negative one times the average real U.S. retail price of gasoline, all formulations, in April 2015 dollars per gallon as calculated by deflating by the CPI (May 2015 is preliminary estimate, scale is on right).
One quick way to describe the relation between these series is with a regression of each month’s change in consumer sentiment on that month’s change in the real price of gasoline. Results of that regression are reported below, with t-statistics in parentheses. If the monthly price of gasoline were to jump by $1.00/gallon, the regression would predict about a 5-point decline in consumer sentiment.

Although the coefficient is highly statistically significant, this is a much smaller response than had been found in earlier studies such as Edelstein and Kilian (2007). The relation appears to be significantly weaker in the more recent data than was seen in the older data. For example, if we estimate the regression using only data over 1978:M2-2007:M7 (the sample period used by Edelstein and Kilian), the coefficient is -12.0 instead of -4.9. Based on the data prior to 2008, we would expect about a 12-point drop in consumer sentiment if gasoline prices rose by a dollar.
Referring back to the figure above, we can see what seems to have happened. The first time gasoline prices reached $3.00 a gallon in September 2005 (or $3.50 a gallon in 2015 dollars), consumers appeared to be shocked. When it happened again the following summer, the decline in consumer sentiment was much more muted. And when the threshold was crossed a third time the following year there seems to be barely any response. It was only when prices went on to new highs (to over $4.00/gallon in 2008) that it seems to have again caught consumers’ attention. Nonetheless, when gasoline prices plunged as the recession worsened, it brought little cheer– consumers by then had bigger things to worry about. It is only in the data over the last year that the two series are back to tracking each other as closely as they had seemed to a decade ago.
If we use the full-sample coefficient estimate of -5, the 30 cents/gallon increase since April would have been expected to be associated with a 1.5-point drop in consumer sentiment. Even if we used the coefficient of -12 from the earlier data, we would still have only expected to see a 3.6-point drop in consumer sentiment, only about half of what was actually observed.
My conclusion is that rising gasoline prices surely contributed to the recent decline in consumer sentiment. But I suspect that other factors are more important.
Professor Hamilton,
Is there a heteroskedasticity issue in the data?
We’re still in a deep depression, where GDP growth improves for a while, then deteriorates for a while, etc. with no end in sight.
http://www.advisorperspectives.com/dshort/
Right, Peak: “secular stagnation” or a “slow-motion depression” resulting from Peak Oil (peak “exergy” and falling net energy per capita from unprofitable energy cost of energy extraction); population overshoot; resource depletion (arable land, water, forests, fisheries, wetlands, etc.) per capita; climate change at the margin; peak gov’t spending per capita and multiplier to GDP; peak Boomer demographic drag effects worldwide (falling LFPR); extreme wealth and income inequality from deindustrialization, financialization (all annual output now pledged to rentier flows to the financial sector and its top 0.001-1% owners), and regressive taxes on earned income in exchange for favorable tax treatment of rentier-speculative unearned income (interest, dividends, capital gains, pass-through income, stock option compensation, bonuses, etc.) resulting in a record low for wages to GDP, which in turn causes decelerating productivity; a political system in which we have “no representation without taxation” (the top 1-10% paying 40-70% of all income taxes) and the best gov’t all the money of the top 0.001-1% can buy; and “Limits to Growth”.
The foregoing describes a system incapable of growing in real terms per capita for the bottom 90%+; rather, the imperative by the ruling Power Elite top 0.001% and the oligarchic next 0.999% is to maintain BAU at all costs . . . to the bottom 90-99%.
In addition to financialization absorbing all growth of labor product, profits, and gov’t receipts in perpetuity, we have social media (cannibalizing existing sectors without a net increase in revenues, employment, and purchasing power), health care, and education combining for an equivalent of 54% of GDP, ensuring that productivity decelerates, private investment lags, capital formation remains at a 20- to 25-year low, and post-2007 real final sales per capita trends at ~0% indefinitely hereafter.
And now we have the emergent conditions in which intelligent systems, robotics, biometrics, nano-electronic sensors, telepresence, bioinformatics, and Big Data analytics operating 24/7, at the speed of light, and in the dark are converging and integrating to the point at which virtually none of us can hope to compete for service sector resources, employment, compensation, and purchasing power with the newly emerging sub-species of “humachine” capabilities.
We now have effectively technological advances and innovations to last a lifetime or two; however, our social, economic, financial, and political systems are far behind in innovating in order to successfully adapt to the emergent intelligent-systems, Schumpeterian, techno-economic paradigm now achieving takeoff while avoiding simultaneous collapse of the mass-consumer economy and its associated institutions.
BC, massive idle resources (e.g. labor and capital) are completely unnecessary for this long. We need a comprehensive strategy to put labor and capital to work.
For example, getting rid of tax credits, raising the national minimum wage to $15 an hour, and lowering middle class taxes will reduce government spending, create an incentive to work, and promote small business start-ups and expansions.
Moreover, we need to reduce and remove or suspend some of the $2 trillion a year of federal regulations (rather than adding more regulations), until the output gap closes, which will raise government tax revenue substantially.
We’ll need the tax revenue, including for the Baby-Boomer retirement (the last of the Baby-Boomers, born between 1946-64, will reach 65 in 2029).
According to the following chart, U.S. per capita real GDP is about $6,000 a year below trend (although, it’s overstated, because there has been some destruction of potential output):
http://www.advisorperspectives.com/dshort/charts/indicators/GDP-per-capita-overview.html?GDP-per-capita-since-1960-with-regression.gif
Also, I may add, I predicted in the mid-2000s, there would be strong economic growth in the 2010s, because high household debt will cause workers 55 and older to postpone retirement, and work longer and harder, to pay-down debt, adding to economic growth.
However, I didn’t expect so much and so many anti-growth policies, and the 16 to 54 labor force to work so much less.
A good article by someone you know: https://econbrowser.com/archives/2009/06/gasoline_prices_5
“Credit and employment challenges have weighed far more heavily than gas prices over the last 9 months, and are presumably far more important than gas prices for determining what happens over the next few months as well.”
Since those factors have ameliorated significantly, perhaps the dip in CC is just “noise”. After all, the price of gasoline is still $1 per gallon less than last year and the increase always follows the EPA-mandated 20-odd “summer blends” that make refining less efficient and more expensive. (I still find that odd given the significant improvement in engine/fueling technology virtually eliminates the need for such draconian anti-pollution measures).
What interests me is how the increase in consumer sentiment related to falling gasoline prices proves the lie that price decreases is a sign of economic decline. It also reveals the lie that people demand rising prices so that assets appreciate. Consumers are much more savvy than given credit.
The reason I say that these myths are lies is because they are based on the underlying Keynesian demand theory that holds government spending as correcting mistakes by consumers and producers. The Keynesian demand theory holds consumer spending up as the most important aspect of a growing economy even if it is paying someone to dig holes and then fill them back in.
Imagine an economy where all commodities are declining in value but the currency remains stable in purchasing power. That is when consumer sentiment will be at its highest. Take a look at the late 19th Century and the great strides in prosperity with falling prices and stable money.
Gasoline prices correlate closely with consumer sentiment. From the consumer’s point of view, the price of gasoline is a pretty good barometer of the household’s comfort level. Ricardo, these should not be confused with asset prices. Most all adults in the US have automobiles; a small number hold meaningful financial assets, and the correlation between gasoline prices and sentiment goes back as far as the historical record (to the early 1980s if I recall correctly).
Cleary, oil prices are not everything, but Europe is doing much better, and China’s oil demand is, as Energy Aspects might say, “stellar”. The question is rather why the US seems to have lost some momentum. Weather, a strong dollar, and a weakening oil sector all seem to have played a role. The oil sector is bottoming now: the horizontal oil directed rig count was actually up last week for the first time this year. A strong dollar hurts the US, but makes it again an engine of growth globally. Our deficit is someone else’s surplus.
Saudi Arabia, partners turn down Chinese requests for extra oil:
http://www.reuters.com/article/2015/05/20/us-saudi-china-oil-idUSKBN0O512I20150520
Re: China (and India, et al):
What has happened is clear. The $64 Trillion question is what happens over the next 15 years or so.
Following is a chart showing normalized liquids consumption (2002 = 100%) for China, India, (2005) Top 33 Net Exporters and the US from 2002 to 2012, versus annual Brent crude oil prices. The same trends continued in 2013, when Brent averaged $109 (China, India & exporters’ consumption up, US consumption remained below 2002 level, but the US has recently has shown an uptick):
http://i1095.photobucket.com/albums/i475/westexas/Slide14_zpsb2fe0f1a.jpg
The following chart shows the GNE/CNI Ratio from 2002 to 2012 (the ratio of Global Net Exports of oil to Chindia’s Net Imports of oil). There have been some data revisions, but the decline in the ratio continued in 2013. At a GNE/CNI Ratio of 1.0, China & India would theoretically consume 100% of GNE:
http://i1095.photobucket.com/albums/i475/westexas/Slide20_zps26112103.jpg
ANE (Available Net Exports) = GNE (Global Net Exports) less CNI (Chindia’s Net Imports).
ANE fell from 41 MMBPD in 2005 to 34 MMBPD in 2013 (total petroleum liquids + other liquids, EIA).
Here’s the problem: Given an ongoing–and inevitable–decline in GNE, unless the Chindia region cuts their net oil imports at the same rate as, or at a faster rate than, the rate of decline in GNE, it’s a mathematical certainty that the rate of decline in ANE will exceed the rate of decline in GNE and that the rate of decline in ANE will accelerate with time.
Note that the 2005 to 2013 rate of change in GNE was -0.8%/year, versus a -2.3%/year rate of change in ANE. In other words, from 2005 to 2013, ANE fell at about three times the rate of decline in GNE.
Two Early 2015 Forecasts for Global Oil Supply & Demand, and for Global Oil Prices
Steven Kopits’ outlook for global supply & demand suggested a rising price environment, while the title of the Bloomberg article is self-explanatory (and Ed Morse in this time frame was suggesting an extended period of time with oil prices in the low 20’s).
Assuming that Brent averages between $63 and $65 for May, the rate of increase in monthly Brent crude oil prices from January, 2015 to May, 2015 will have been between 80% to 90%/year on an annualized basis.
Steven Kopits’ 1/20/15 outlook for global supply & demand:
Supply Minus Demand, Explained:
http://www.prienga.com/blog/2015/1/20/supply-minus-demand-explained
Bloomberg (2/16/15): Get Ready for $10 Oil
http://www.bloombergview.com/articles/2015-02-16/oil-prices-likely-to-fall-as-supplies-rise-demand-falls
Shorter Steven Kopits: If oil prices are high, it is a drag on the economy. If oil prices are low, it is a drag on the economy.
If the only tool you have is a hammer, every problem looks like a nail.
FWIW, the 4 qtr. average seasonally adjusted annualized rate (SAAR) of the YoY change of real final sales per capita as of Q1-Q2 has decelerated below the historical “stall speed” prior to recessions.
Moreover, the sum of real per capita after-tax profits and disposable personal income and total gov’t receipts has similarly decelerated to a rate from a peak that historically was followed by the average 4-qtr. average of real final sales being ~0%, i.e., recessionary, for 4-6 qtrs. thereafter.
Then subtract from real final sales per capita the accelerating rate of so-called “health care” spending as a share of GDP and PCE, and the SAAR 4-qtr. average is slower still.
A caveat here is that the historical “stall speed” that has averaged ~1% real per capita since after WW II might now be significantly slower given the dramatic deceleration of the average rate since 2007 at ~0%.
Finally, with the dramatic deceleration of real final sales per capita to ~0% since 2007, the US economy is much more vulnerable to any number of shocks, including weather, drought, natural disasters, labor actions, energy, and geopolitics. In fact, consumer prices have accelerated YTD in recent months to 2.3-3% annualized, which is above the post-2007 trend of ~1.75% for core CPI, suggesting that the seasonal acceleration of consumer price inflation will drag on growth of real final sales against more challenging YoY comparisons going into the summer-fall, reducing demand and implying a deceleration of CPI later in the year.
Therefore, the plunge in the price of oil since last summer-fall is consistent with the US and world economies decelerating to “stall speed” and perhaps the onset of recession (or recession-like conditions) beginning in Q4. That implies ~0% probability that the Fed will hike rates, whereas they will more likely resume QEternity later this year to fund the increasing deficit/GDP.
Any chance of getting a retrospective on the price drop and on your “hundred dollars here to stay” comments of last summer? Seems like it is merited, especially given all the publicity, the Kemp Kopits columns, etc.
If anything, it seems like there is an economic insight that hundred is relatively unsustainable as US shale was not about to roll over at 100 (not a temp phenom, not a bubble) and was growing at up to 1.5 MM bpd. For instance, listen to this discussion around 26 minutes:
http://www.c-span.org/video/?325957-1/discussion-future-us-fracking