Or “Kansas macro crash…and burn”
Patrick Marvin argues that Kansas is doing fine, and the tax cuts just need a bit more time to kick in to spur the economy. My reading of the data and estimates suggest otherwise.
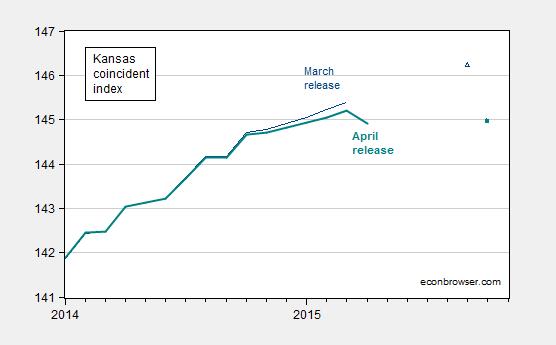
Figure 1: Coincident index for Kansas, March release (dark blue), April release (bold teal). Dark blue triangle (solid teal box) denote corresponding forecasts from March and April releases of leading indices. Source: Philadelphia Fed (coincident), Philadelphia Fed (leading), and author’s calculations.
There has been some debate regarding the pace of economic growth in Kansas over the past four years. In order to compare the outcome with what might be expected, I construct a counterfactual, based upon the historical correlation of Kansas economic activity with US economic activity over the 1979-2015 period. I use as a proxy for economic activity the Philadelphia Fed’s coincident indices, which apply the Stock-Watson approach to extracting a state factor from multiple time series (of possibly differing frequencies).
The log of the coincident series for Kansas and the US do not reject the I(1) null at conventional levels. At the same time, they appear to be cointegrated according to standard test (Johansen, constant, no trend, 3 lags of first differences, at 10% msl).
Hence, I estimate a single-equation error correction model, assuming US economic activity is weakly exogenous for Kansas, over the 1986M01-2010M12. Let ks be the log coincident index for Kansas, and us be the log coincident index for the US. Δ is the first difference operator. The resulting estimates are:
Δkst = –0.001 – 0.0047kst-1 + 0.0049ust-1 + first, second and third lags of first differences
Adj-R2=0.74, SER = 0.0017, N = 380. Significance at 10% msl denoted by bold face.
Data/output update: data (XLS) Code/output (PDF).
Observation 1: This is a pretty high coefficient of variation. Statistically, the m/m growth rate in Kansas economic activity is well explained.
Observation 2: The cointegrating relationship between Kansas output and US is about 1.03.
Observation 3: Estimating the equation over the entire 1990M01-2015M03 does not yield similar coefficients.
I use the equation estimated over 1979-2010 to dynamically forecast out of sample over the 2011M01-2015M03 period, taking as given the ex post realization of the US coincident index. (Technically this is a ex post historical simulation.)
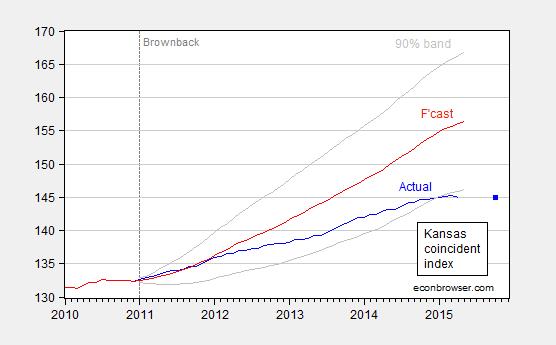
Figure 2: Coincident index for Kansas (blue), ECM forecast (red), and 90% confidence band (gray). Observation for October (blue square) is implied by April leading index. For forecast, see text. Source: Philadelphia Fed (April releases) and author’s calculations.
This outcome suggests that Kansas has been underperforming since 2012M01 relative to a counterfactual based on historical correlations in place over the 1979-2010 period. As of April 2015, actual activity is 7.4% (log terms) below what it should be.
Update, 6/5: Bruce Bartlett weighs in.
Update, 6/6:Kansas furloughs 40% of state employees (h/t Bruce Bartlett).
It’s a shame that spokespeople for the Philadelphia Fed have said that it’s wrong to use its state coincident indices data to compare performance between states and also report that its system doesn’t provide good measurements for states that have a lot of agriculture or mining.
[There’s a reason why we haven’t revisited the topic – why produce analyses whose validity is so questionable?]
Ironman: I agree that to the extent one shouldn’t use GSP to compare state performance, one shouldn’t use coincident indicators. But everybody does it. (I must confess I don’t understand the Fed’s disclaimer.)
Now, to your assertion about Kansas not being well measured by the coincident indices because of its high proportion of mining and agriculture. Well, Kansas value added in mining and logging and agriculture is 6.5% in 2013. The US share is 4.3%; it doesn’t seem like a big difference. (I think your critique applies to someplace like Iowa, where the share is 10%).
Note this document indicates the correlation of GSP and coincident indices for KS at 0.55-0.70, relatively high.
Ironman: By the way, I am thankful you haven’t insisted on using nominal magnitudes, as you have in the past.
There is no need to insist upon it – it is the only form of data that captures events as experienced by real people in real time in the terms they originally recorded it, which makes it extraordinarily valuable. If nominal data is not provided or adequately referenced in an analysis, it’s a failure on the part of the presenter and a valid reason to reject any conclusions that they may have drawn from whatever data they did present out of hand.
Professor Chinn,
As a learning tool, would you consider posting your file, especially if it is an EViews file.
Thanks.
AS: I’ve added two links just below the regression output, but here are the relevant links:
data (XLS)
Code/output (PDF).
Every recovery is different, and this is a very unusual “recovery.”
What is “wi”?
I think you mean “ks”, but you are doing related work about Wisconsin.
This, of course, is just a blog post. But when I see typos in the math of published articles (which is amazingly frequent) I update to “highly likely” my belief that there are bugs in the econometrics. Ergo, +1 with oomph on the suggestion you post your code.
Michael: Apologies for the typo. I’ve fixed, and I’ve added two links just below the regression output, but here are the relevant links:
data (XLS)
Code/output (PDF).
You can cross check my results now (actually you could before since the data were available online, but now it’s even easier).
Has anyone else noticed that Menzie cherry picks the data he uses depending on what he wants to show? With Wisconsin he always talks about employment while with Kansas he talks of tax revenue and GDP.
The only thing I’ve noticed is a steady stream of denial.
And it isn’t coming from Menzie.
Ricardo: That’s it. When you out and out lie over and over again about what I have written, then it’s time to set the record straight.
Post on employment in Kansas. Your comment on this post here. Hence, you cannot claim you missed this post.
Post on GDP in Wisconsin. Your comment on this post here. Hence, you cannot claim you missed this post.
Menzie,
You crack me up. You mentioned unemployment in a post almost a year ago called “Economic Portents – Kansas” where you primarily discuss GDP and personal income, but you now call the post a “post on employment.” Okay, I surrender; I admit that you wrote the word unemployment in a past post.
Kansas unemployment has been in the full employment range (3.5% to 4.5%) for more than a year and you complain that it is stagnant. Oh, that the rest of the US was stagnant below 4.5% unemployment!
Unemployment has been declining ever since Brownback was elected governor, but when the tax cuts were introduced unemployment began an even more significant decline and this despite that fact that there were significant cuts in government employment (another positive that will appear negative in government statistics). But you are correct; now that Kansas has reached full employment, unemployment has stagnated.
But in your September 2012 post, what do you concentrate on? In your slight mention of employment in Kansas you focus on a decline in manufacturing employment – that in an agricultural state (LOL!) And as Steve Kopits has noted there has been a decline in oil production as a reaction to falling oil prices. I bet Kansas doesn’t produce a lot of Japanese license plates either.
Cherry picking may not be your primary vocation but it does appear to be one of them.
Menzie wrote: “Ricardo: That’s it. When you out and out lie over and over again about what I have written, then it’s time to set the record straight.”
Corrections some time after the fact and in the comments of unrelated blog posts don’t undo the damage. Ricardo sabotages your blog, making it less valuable to the rest of us. If it were my blog…well, it isn’t.
I live in Kansas. What I’m seeing every day is exactly what Prof. Chinn’s data analysis shows. It’s been a disaster. And we haven’t come anywhere close to bottom. To try to get the budget to balance, the Legislature is considering either spending cuts as much as $460 million or raising the sales tax from 6.15 percent to almost 7 percent, or some combination of spending cuts and a sales tax increase. Anybody who says that will lead to prosperity is seriously deranged.
What will lead to prosperity Tom?
Professor Chinn,
What dates are you using for the Johansen test? Are you using 1979-2015 or 1986-2010, or some other period? I am having trouble finding a cointegrating relationship for the log data. I am not questioning your results, just trying to tie-in to your analysis.
Professor Chinn,
Thanks. Still having trouble. You posted the log differences for the KS and USA indices. Would you mind posting the log values for KS and USA? I have checked my log values several times and my Johansen test is not agreeing with yours. I am using Eviews 9, which should be the same as Eviews 8. I selected number 2 on the Johansen test input screen, and used the 1 3 lag option, so should give same output. Maybe I need new glasses.
AS: I entered log(coinks_apr15) log(coinus_apr15) into the dialog box. Try that.
That worked. I will compare your index numbers to the numbers I downloaded. I thought I had verified that they were the same.
It would seem intuitive that tax cuts will not necessarily generate new revenue or jobs in any near term situation. The amount of tax cuts per person/couple is, for the most part, fairly small. One might ask if it is so small as to be negligible in household budgets. Then one might ask if the tax saving might simply be treated as that by the person/couple… savings… or used for debt payment which would hardly be a near-term stimulant for business, but might be positive for the economic health of the residents.
It would also seem intuitive that tax cuts not accompanied by concomitant spending cuts would lead to budget problems for the state for the near term.
All this would appear to be a non-redistribution of wealth from taxpayers/producers to the state/state-funded individuals/groups/corporations. Which takes us back to whether or not crony capitalism is a good or bad thing.
Bruce Hall: If you had been following the reports, you would know that the State government forecasters/budgeters had allowed for a revenue decline. The decline in revenue far exceeded that predicted. That is the issue, which you are struggling hard to avoid.
Menzie,
I’m not “struggling” with anything happening in Kansas. If Kansas has a budget shortfall, they have two choices: raise taxes again or cut more spending. All I’m suggesting is that there is not an “on” switch for government revenue when a tax cut happens unlike an “on” switch for government when a tax increase occurs. That’s because a cut is unfocus with regard to the benefits. It doesn’t mean the benefits fail to accrue. To the contrary, they are benefits to the tax payers that are largely invisible to data gatherers.
If I fail to tax 1% of your $100K income 😉 then you have $1,000 dollars over 12 months with which to reduce your debt, keep some additional emergency cash on hand in your 3,000 lb. safe, or put into your kids 529 fund. I’m not sure that any of that makes it into the Data Collection czar’s supercomputers, but it does benefit you or your family. Not everything is about how I can get the government to spend my money on things I wouldn’t consider.
The decline that Kansas missed was because they assumed that very few business entities would change from C corporations, to S corporations or LLCs and LLPs filing as partnerships (and actually you don’t need to do anything as drastic as that, there are a host of techniques to route revenues to pass-through entities); they also didn’t assume that individual owners, and top executives would restructure their compensation so that it came in the form of business pass-through income instead of earned income or dividend income. Since these are relatively easy changes to make, it astonishes me that anyone would miss it unless they had a reason not to. So suddenly the number of exempt entities doubles over their estimates, and the state has a huge deficit…to quote Claude Rains: ” I’m shocked, shocked to find gambling here in Casablanca.”
Too many people are conned by those who criticize the Laffer curve. No serous supply side theorist ever said that all tax cuts would not lead to an initial decline in tax revenue; as a matter of fact it was just the opposite. What supply side theorists say is that a tax cut that leads to an increase in production greater than the interest on the lost tax revenue is a net gain to the economy just as a loan that leads to greater income than the interest payment is a net gain. Sadly, too many economists know nothing about business and so do not understand this concept.
Professor Chinn,
Any thoughts on the opinion piece comparing North Carolina with Kansas by Steven Moore in the 6/4/2015 edition of the WSJ? It seems to this non-expert that using the same method to forecast NC as used to forecast KS, NC is ahead of a dynamic forecast. I am interested in your comments and forecast (again as a learning tool).
AS: Since you have access to the same Philadelphia Fed coincident indicators I do, you can easily try what Stephen Moore clearly did not want to try. In my case, I selected 1990-2010 as a sample period (you can see over this period US and NC indices track; also I can get a usable ECM) to estimate a ECM with 3 lags of first differences. The long run elasticity of NC wrt US is about 0.96. If you do a dynamic forecast, you will find that actual is less than forecast by 2.6%. On the other hand, it remains well within 90% forecast interval, so this deviation could have occurred by chance.
In other words, the piece confirms for me that Mr. Moore will cite anything, sometimes even “incorrectly”, in order to prove a point.
Professor Chinn,
Thanks. I think I must have used an incorrect ECM period of time for my estimates. I appreciate the response.
Professor Chinn,
I had to use the period 2000 to 2010 in order for the residuals on the cointegration equation to be stationary (could be wrong, still learning). I then find that the actual index is about 5.3% less than forecast.