From NOAA:
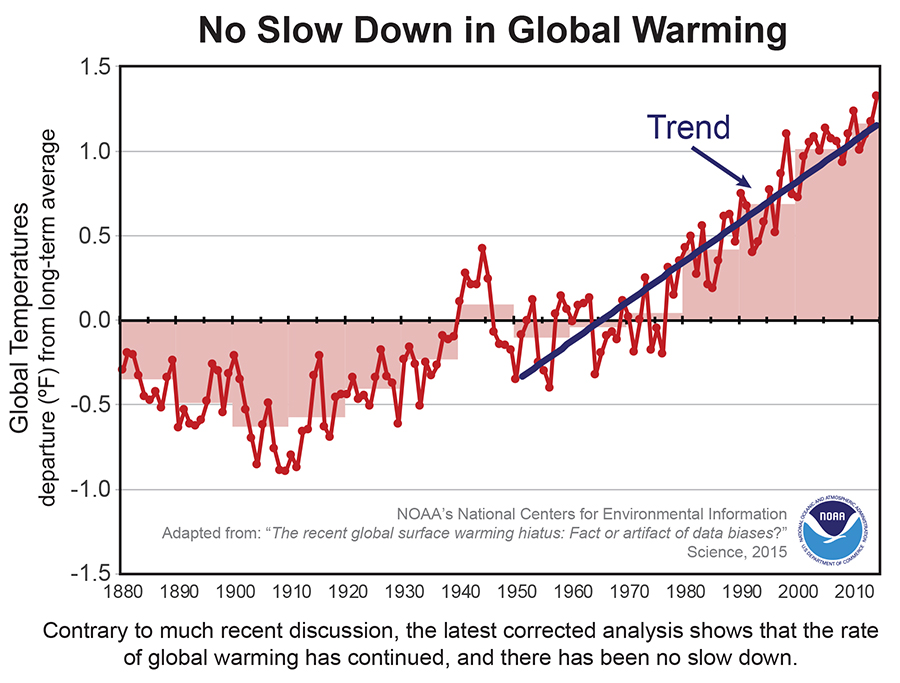
“Adding in the last two years of global surface temperature data and other improvements in the quality of the observed record provide evidence that contradict the notion of a hiatus in recent global warming trends,” said Thomas R. Karl, L.H.D., Director, NOAA’s National Centers for Environmental Information. “Our new analysis suggests that the apparent hiatus may have been largely the result of limitations in past datasets, and that the rate of warming over the first 15 years of this century has, in fact, been as fast or faster than that seen over the last half of the 20th century.”
The report continues:
Since the release of the IPCC report, NOAA scientists have made significant improvements in the calculation of trends and now use a global surface temperature record that includes the most recent two years of data, 2013 and 2014–the hottest year on record. [Emphasis added]
See my previous post on 2014, and many comments disputing the assertion that 2014 is the hottest year measured.
Link to Science article, here.
Well, 2014 won’t keep that record for long. But I am sure the usual trolls will appear and argue that 150 years of atmospheric geophysics and chemistry are a left-wing Communist conspiracy by grant greedy scientists. Hard to be optimistic when at least 40% of the country, including much of its business and wealth elite seem determine to retreat back to the 10th century (I am afraid I have high a opinion of the intellectual creativity of 12th – 15th centuries to embarrass them by comparing them with a conservative elite exemplified by an Associate Justice of the Supreme Court who has will himself to believe Young Earth Creationism, which is not even a doctrine of the faith he claims to follow). http://thinkprogress.org/justice/2015/06/05/3666618/justice-scalia-blows-creationist-dog-whistle-graduation-speech-catholic-high-school/
Can anyone else tell that a big conference is coming? In the past few weeks we had a study that claimed that we were possibly due for a 2-3 decade period of cooling: http://www.nature.com/nature/journal/v521/n7553/full/521428a.html Before the Googlers try to debunk the peer reviewed science DailyKos has already made an attempt: http://www.dailykos.com/story/2015/06/01/1389537/–Fatally-flawed-cooling-claims calling it Fatally-flawed. Why? From the article: “It’s all rather complicated, but the controversy comes down to the fact that the paper uses linear detrending to come to its conclusion. As Sou details, there are a number of papers in the scientific literature explaining why that is not a proper way to separate natural variability from external forces (like pollution).”
If that is a fatal flaw, then what do we have with the graphic Menzie showed above?
In detail this NOAA attempt is indeed fatally flawed in several serious ways. This article from Dr Judith Curry, a climatologist, summarizes several reactions: http://judithcurry.com/2015/06/04/has-noaa-busted-the-pause-in-global-warming/
For me the most fatal of the flaws is the adjustment downward of the best ocean measurement data, the Argo buoys, to better match the far more problematic earliest ocean measurements. That defies logic unless your mission is to remove the hiatus. Which, by the way, is why the Argo data was adjusted upward soon after they started reporting to better match the anticipated model data.
Read the reviews to get a feel for just fatally flawed is this NOAA release.
NOAA has been cited for the past several years with irrationally adjusting the raw data. This confirms how badly the NOAA adjustment process is, and confirms the bias selection in those adjustments.
Let me also add that the blind acceptance of these types of studies is now an indication of the growing desperation of the climate community. Most of which is caused by Ole Mom Nature and her hiatus throwing this huge monkey wrench into the AGW hypothesis.
BTW, can anyone explain how this NOAA attempt supports AGW? How does AGW warm the oceans and more importantly how much? If just shy of 100% of the warming of oceans is caused by the Sun, particularly the short waves. How much does the long wave IR warm it?
“irrationally adjusting the raw data”
Oh, good, I love it when people with no understanding of the issues involved in processing large datasets, and the statistical processes involved, repeat some guff they read on a blog somewhere. Tell me, how would you go about removing instrument biases, heat island effects, tobs changes, station moves and other effects?
Maybe you’d blind test your methods on synthetic datasts with known properties, to see how they perform? Oh no, wait, that’s been done and the methods worked fine.
Sam Taylor asks: “…how would you go about removing instrument biases, heat island effects, tobs changes, station moves and other effects?” All are good examples of some of the adjustments made daily on the whole dataset, but, those is not the issues in this Report. Discuss this report. They have been reported in my reference: http://judithcurry.com/2015/06/04/has-noaa-busted-the-pause-in-global-warming/
To answer your question re: how to go about removing … the basic answer is how many scientists are there working on the various issues? Each could have a different approach, but that’s not happening. What we find is there is almost no variation. What are those odds? Furthermore, when we do see selection of methods they always bias toward the AGW hypothesis. What are those odds?
Bit of a cracked teapot debate here,
The casual clicker from Kos onward eventually arrives at a delicious post by Bob Tisdale, http://wattsupwiththat.com/2015/05/29/new-paper-confirms-the-drivers-of-and-processes-behind-the-atlantic-multidecadal-oscillation/
There, the third figure reports sea surface anomalies 1970 – 2014. Notice the strong decline 1870-1900, and the very modest decline 1940-1975. Leaving aside “trends,” with much more anthropogenic forcing in the latter period, what might that suggest for the path of the “oscillation” 2000 ~ 2035, except a very modest incline?
Still, the wrath around this post is quite extraordinary
I mean that favorably to Professor Chin, of course, who has had enough interesting times in his own state!
Ron C,another explanation for the strong decline is the phasing of the AMO and PDO instead of: “with much more anthropogenic forcing” explaining the next oscillation. But, as always, your mileage may vary with your own beliefs.
Just out of curiosity Prof Chinn – are there any elements of the broad soft left agenda that you don’t support?
Are you anti-cell phone, for example? Anti-fracking? Pro-free college? Are vaccinations a grey area? Castration of Wall Street bankers?
Anyway, we can take pleasure in the fact that the US is probably once again the largest producer of oil and gas. Eat your heart out, Bill McKibben!
C. Thomson: I don’t know – depends on your definition of broad soft left. For instance, I’m not too keen on allowing implementation of anti-miscegenation measures in North Carolina — are you? I believe in the net benefits of trade liberalization; is that broad left? I’m in favor of a cyclically adjusted budget balance near zero — I think some on the right think that anathema, and all that matters is the tax rate. And you know what — these are all things I’ve stated my position on (well, except for anti-miscegenation laws — I thought that was settled five decades ago, but I think I might be wrong on that count at least in some people’s minds).
The miscegenation bit just seems to reflect watching MSNBC – surely soft left – free trade is a question mark – and believing in a cyclically adjusted budget balance is like a belief in any variant of the New Jerusalem – certainly soft left in some sense cuz disconnected with US political reality.
Reality is always the tough hurdle for both gomer Republicans and pious trad liberals…
C. Thomson: Gee, and I thought a pro-trade liberalization agenda and a belief in balanced cyclically adjusted budget were the hallmarks of a technocratic approach to policymaking – Silly me!
Fascinating Menzie. I’d love to hear about how you’d go about getting us to a cyclically adjusted budget balance. Obviously in the midst of this great expansion (6 years in!) you’d support massive surpluses to save for the next recession we’re sort of due for.
Since you’re smart enough to know we can’t tax our way out of our budget problems, I’d love to hear about which sacred cows you’d gut.
Anonymous: FY2015 estimated cyclically adjusted budget balance as share of potential GDP is -2.5%. I think we could with a higher progressive tax rate, and cuts of the nature I outlined in my 2005 Council on Foreign Relations special report get a long ways toward medium term balance, if not actually hit it. It would help to avoid occasional wars of choice, e.g. Iraq 2003.
Cute.
For anyone who might know or have insight:
It is my understanding that climate change may cause the tails of the distribution of severe weather events to become fatter. In other words, introducing additional volatility to the observed trends. Am I off-base in my thinking? Are there any papers/reports that have looked at this?
Cheers!
The scientific lit is full of post hoc explanations for the hiatus; a phenomenon that apparently isn’t a “thing” anymore, according to one data set.
This harms more than helps the AGW cohort.
The funniest, and indeed saddest, part of the whole “pause” nonsense is watching so many people confuse noise for signal.
It’s quite amusing really, but one can do it oneself. Generate a linear function, add some noise with a sufficiently high magnitude and a pause appears, as if by magic!
150 years of data, if accurate (NOAA has been wrong before), is like one second in a year.
Obviously, some people believe government is too small to control the weather 🙂
Dear Menzie,
This is something I wrote about in my November 2008 USAEE Dialogue article, “Global Warming: Data and Some Thoughts About the Role of Economics”. You want to be careful about starting from the trough of one of the little cycles in 1950, and then projecting up. This is subject to accusations of cherry-picking; the claim would be even sharper if you start from the other low point in 1958. If you look at the data carefully, you will see a sharp jump in the mid-1970s, and then the observations never come back down. If you fit through the middle of the little mini-cycles, which OLS will do for you if you are careful, you will get a robust but slower trend, not the sort of erratic cycles you can make some argument for until the 1960s. My own feeling is that you get heteroscedasticity as well, which is fairly obvious up until 2008, but somewhat debatable after that. So yes, of course you are right, but you want to be careful.
Julian
P.S. Updating the article is something of a nuisance. The National Climate Data Center (NCDC), under NOAA, has changed the U.S. data because of changes in population densities and locations. Everything has to be fed back in again, instead of just adding a few more data points. You must have heard about people going berserk with Eviews 9, too. One thing at a time.
Julian Silk: Thanks for the insight. I guess next post on the subject, I will download the data and do a battery of unit root tests, as in this post.
Menzie:
It’s possible that this Karl paper is correct, but also very possible that it is not. See for instance:
http://judithcurry.com/2015/06/04/has-noaa-busted-the-pause-in-global-warming/
In particular, “This short paper in Science is not adequate to explain and explore the very large changes that have been made to the NOAA data set.”
I would urge you to look at all data compilations with a thoughtful eye. Whether they favor a narrative you like or the reverse. (I say the same to denialists routinely.) Just a word of caution.
A1: I agree — never make a conclusion based on just one paper or a few. One would want lots (which we have in favor of the AGW hypothesis).
You’re shifting from discussion of one paper to an overall narrative.
FWIW, I agree there is a general take in this direction.
However, it is fruitful to look at where it is stronger, weaker. And not to just cite little tidbits that go your way (I say this to denialists also). Note that trying to label one particular storm as AGW caused is pretty dumb (even AGWers will tell you that). Looking at the trend is more meaningful (and even this, if you refer to storms, is one of the weaker areas for an AGW effect). A stronger area is to look at Arctic warming and alpine glacier melting.
A1: Everything is probabilistic, and as far as I know, most agreed that the likelihood of a Sandy is higher with global climate change than w/o. So, wouldn’t you agree it’s a good idea to tabulate that cost, if one is to tabulate growing season length impacts (which Steven Kopits adduces to global climate change)?
But I agree, one paper doesn’t decide a matter. But you will note that on Econbrowser, I don’t always go through an entire literature survey before discussing a new paper.
If you read up on storms versus global warming, it’s much weaker than you would think. Going with “everyone says Sandy came from global warming” is just showing poor awareness. An individual weather event (including a notable one) is much more of a stochastic phenomenon than an indicator of a trend influencer. Heck, how about the year (last or a couple ago) where there wasn’t a single hurricane that hit the US? And note, I rightfully tell the denialists that they are cherrypicking when the tout that.
Again, glacier loss is a much clearer indicator than storms. US hitting hurricanes for instance have had no clear trend of increase over the last 100 years. Even theoretically, it is not clear if higher temps should cause more storms or if the lower delta-T (since higher lattitudes warm more from GW) reduces them.
A1: How many once in a century hurricanes have we had of late? Well, I take your point about infrequent occurrences vs. glacial loss as an indicator. My previous post on economic impact here.
Consider:
http://www.aoml.noaa.gov/hrd/Landsea/gw_hurricanes/fig33.jpg
‘…more once in a century hurricanes.’
Read the Landsea presentation. (same site as the graph I linked to.) There is no trend of large hurricanes hitting the US more.
http://www.aoml.noaa.gov/hrd/Landsea/gw_hurricanes/
P.s. Using infrequent once in a century events as an indicator is pretty crappy for doing probing analysis. What, if you have 2 or 3, you declare a trend or the converse? What if it doesn’t go your way, would you take it as anti AGW? You shouldn’t. It’s just a crappy metric. Why not look at lower level events that occur more often. IOW, don’t base the AGW proof on number of records broken for temp, base it on the whole trend of all temps. I would think irrespective of AGW or left/right or whatever, that this would be intuitive to you. for instance you can’t judge sports performance on a variable that is really rare itself, like hole in ones. Better off to look at all the golf strokes.
A1: I think I agreed. We’ll wait (and wait and wait) and see, but here is NOAA’s assessment. Two bullet points:
Well the models have been wrong every time before, so no reason to worry they are right this time.
So let’s test the value of going back to that idyllic world of 1960.
In 1960, the growing season at Madison City (using UW-Madison data) was measured as 120 days. More recently, the season has been 155 days (with a long term average of 145 days).
How much is it worth to you to reduce the growing season in Wisconsin by 35 days? By 10 days?
http://www.aos.wisc.edu/~sco/clim-history/stations/msn/MSN-AP-grwingseadays.gif
And before you say, “But what about all those really hot days?”
Well, they’re on the decline.
http://www.aos.wisc.edu/~sco/clim-history/stations/msn/MSN-AP-90degdays-ann.gif
Steven Kopits: What was the cost to the economy of Sandy?
Nope. Here’s Northern Hemisphere accumulated cyclone energy.
Trading at the bottom of the range.
http://models.weatherbell.com/global_running_ace.png
Here’s the global web page:
http://models.weatherbell.com/tropical.php
We’re low globally as well.
Indeed, we are currently holding the record length of time without a US land fall more a major hurricane. (It’s not a streak that will last.)
http://www.washingtonpost.com/blogs/capital-weather-gang/wp/2014/05/30/atlantic-hurricane-season-begins-sunday-will-record-streak-without-major-hurricane-end/
Menzie, where’s the evidence that Sandy was enhanced by climate. Anecdotal point data is not climate! But, it is weather!
Smuckers ask a good question: “…extreme weather events … introducing additional volatility to the observed trends. ” The trends for frequency of these events are diminishing. The trend for intensity may/may not be increasing. A recent study said increasing intensity but was ambivalent about amount of change. So if they are increasing in frequency and intensity, in accordance with the AGW hypothesis, where does that leave the hypothesis? If we can not remove the hiatus from the data records, where does that leave the hypothesis? If the models’ projectiuons are diverging from the data, where does that leave the hypothesis? If only the NOAA data shows the increase and all other datasets, except GISS which also starts with the NOAA data, where does that leave the NOAA data? If the NOAA data ignores and adjusts the better datasets, Argo and satellite, what does that say of the value of the NOAA adjustments.
Those were just a handful of the issues associated with this paper. Only those desperate or blindly believing in the AGW hypothesis have accepted this paper — to date. I ask again how does this paper support the AGW hypothesis?
don’t forget Katrina, Rita and Ike! if global warming increases the likelihood of large storms, and there is still much research to be done before this is a foregone conclusion, you get an example of the type of costs climate change will impose on the future. while we do not know the likelihood of occurrence, we certainly have a much better feel for the cost of such events. and the cost is undeniable.
Let me link this for you again, Baffs.
http://www.washingtonpost.com/blogs/capital-weather-gang/wp/2014/05/30/atlantic-hurricane-season-begins-sunday-will-record-streak-without-major-hurricane-end/
The expensive part of hurricanes is due to people living in high densities on the coast. That’s only going to get worse.
steve, there is a difference between hurricanes striking the us coastline and the total number of hurricanes in general. a drought in landfalls is a biased look at the data. we have had some strong storms form, fortunately their path did not strike us mainland.
statistically it will probably take some time to show a change in hurricane performance. as i noted in another post, there is still much work to be done to confidently link hurricanes to global warming. but we do have direct evidence of the cost of strong hurricanes. that in itself should make you worried regarding a possible correlation in strength and global warming.
and i agree, continued high density along coastlines is a problem. i lived in a couple of the most vulnerable locations years ago. this problem is well understood in my mind. we have poor incentives and regulations which unfortunately encourage people to locate in vulnerable spots.
actually the landfall slant may be less biased. We did not have the monitoring of the mid ocean pre 1950 that we do now. Have to look at data series like this with some thoughtfulness. Same can apply in market research, polling, etc.
a1, a category 5 hurricane exists in the middle of the atlantic in 1900, do you know about it? perhaps, but only if a ship was caught in its crosshairs. not sure if it would survive the event. that cat 5 storm goes unreported. less likely to happen with a landfall hurricane. point is, there are always fewer landfall hurricanes than total hurricanes. assuming similar landfall and total hurricane strength distribution may not be a good assumption.
Steven,
I’ve said it before I’ll say it again, stick to the oil analysis, you’re good at that and tend not to embarrass yourself. The “longer growing season” argument doesn’t stand up in the latest research:
http://journals.plos.org/plosbiology/article?id=10.1371/journal.pbio.1002166
Try to keep up.
I was using University of Wisconsin – Madison data.
It goes without saying that the effects of a warmer world would be distributed, with both winners and potential losers. Wisconsin in an unambiguous winner, unless you’re partial to longer, colder winters.
Houston could be a loser, save that it’s population is growing a lot faster than Wisconsin’s. And it really is hot down there. And yet, people still flock to the state.
Here is a paper that says the pause was a just position to hold until the addition of the last two years and revising the dataset. Of course the paper does not state it that way but it is easily concluded from the statement at the head of the post.
“Adding in the last two years of global surface temperature data and other improvements in the quality of the observed record provide evidence that contradict the notion of a hiatus in recent global warming trends,” said Thomas R. Karl, L.H.D., Director, NOAA’s National Centers for Environmental Information. “Our new analysis suggests that the apparent hiatus may have been largely the result of limitations in past datasets, and that the rate of warming over the first 15 years of this century has, in fact, been as fast or faster than that seen over the last half of the 20th century.”
Now, you might have asked, “Don’t you think the clustering of the last few months’ data on the UAH temp page suggest that the hiatus may ending?” And I would have answered, “Could be.”
The presumption is that the warming trend seen since 1880 is likely to continue at the pace of 0.1 deg C per decade. We’re overdue for a step up.
I would add, by the way, that the NOAA analysis above is just ridiculous. It does not correspond to any of the temp data sets with which I am familiar, and I know most of them. Indeed, if you look at the Wisconsin growing season graph, you can see the hiatus clearly there as well.
http://www.drroyspencer.com/wp-content/uploads/UAH_LT_1979_thru_January_2015_v5.png
http://wattsupwiththat.com/2015/06/04/noaas-new-paper-is-there-no-global-warming-hiatus-after-all/
https://stevengoddard.wordpress.com/2014/06/23/noaanasa-dramatically-altered-us-temperatures-after-the-year-2000/
“Those who control the present, control the past and those who control the past control the future.”
― George Orwell, 1984
evidence suggests that ocean heat content is rising-and has been throughout the “hiatus”. sea level rise, also throughout the “hiatus”, has also continued. temperature data sets which continue to rise, rather than show a “hiatus”, are more consistent with the other observables at this point in time. one may have an issue with the “revised” data set, but one should remember the original data set was also of a “revised” nature as well. perhaps the original calculations were missing something? why are they so sacred? they were the best estimate of the data at the time, but certainly not infallible as we improve our understanding. heat content, sea level and surface temperature all trending in the same direction indicates all the measurables are capturing a situation where no “hiatus” has existed. the existing data does not appear to suggest a “hiatus” in global warming occurred in the very recent past, contrary to the claims of some on this blog.
Baffled, do you understand the concept of outlier? NOAA in today’s data world is an outlier. Please find the answers in the literature for the flaws I indicated earlier:
“For me the most fatal of the flaws is the adjustment downward of the best ocean measurement data, the Argo buoys, to better match the far more problematic earliest ocean measurements. That defies logic unless your mission is to remove the hiatus. Which, by the way, is why the Argo data was adjusted upward soon after they started reporting to better match the anticipated model data.
Read the reviews to get a feel for just fatally flawed is this NOAA release. ” Here are a few from the early reviews: http://judithcurry.com/2015/06/04/has-noaa-busted-the-pause-in-global-warming/
corev, you still need to reconcile increasing ocean heat content and rising sea levels with surface temp data. viewed in this context, surface temp data that shows a hiatus is the outlier. both the recent data set and the previous data set were massaged numbers. you are simply assuming the first attempted massage was correct and the follow on massage was wrong. however, the other measurable appears to be consistent with no hiatus. simply looking at the data available. there is no hiatus in sea levels or ocean heat content.
Baffled, you are absolutely correct: ” there is no hiatus in sea levels or ocean heat content.” Just as there is no consistent color between bananas, apples and kiwis. They are all fruits so they should all have the same color even if grown in different world locales. That comparison is just as accurate as your hiatus argument using different climate factors. You then made this statement: “viewed in this context, surface temp data that shows a hiatus is the outlier.” Which is as accurate as in the context of bananas, apples and kiwis colors red is an outlier.
I’m just trying to show you that reconciling unlike but generally similarly categorized items makes little sense.
corev, you do not want to acknowledge that sea level, ocean heat content and global surface temps are related. there are two ways to raise global water levels, raise their heat content or add more water. increasing surface temp is one way to add to ocean heat content. the currently observed data is consistent with this understanding. increasing ocean heat content and sea levels could exist without increasing surface temps, but you need a much more complicated model to capture that behavior. such a model is probably not the most likely to be correct.
Baffled, did I not make the point that the fruits were related, but so are your climate factors. One is reconciled as fruits and the other as climate factors. Now what? OHC is is a part of a centuries/millenia long resolutions driven by ocean current cycles. Sea levels consist of even longer cycles driven mostly by the glaciations. Surface temperatures changes are far shorter variables: AMO, PDO, ENSO, solar, all of these are overlayed upon longer term Bond Event and Milankovitch cycles.
These are all well known and widely accepted climate cycles. How do your Sea Level, Ocean Heat Content and Surface Temperatures reconcile to these accepted climate cycles? Once you’ve done that reconciliation let’s look at the real issue AGW and determine how that reconciles.
I ask that last question, because the NOAA dataset covers both the Surface Temps and is totally unable to reconcile their relationship to AGW.
corev
“Baffled, did I not make the point that the fruits were related, but so are your climate factors. ”
you fail to understand the colors of the fruits are independent variables-they are not related. the factors I identified (as well as other factors), such as ocean heat content, sea level and surface temperatures, are not independent variables. we may not know the exact magnitude of the influence of one on the other, but the basic physics indicates these variables are related to one another. see the chain rule in calculus to understand how to link what appear to be different variables. you can choose to deny this difference, but you would be choosing ignorance.
colors of the fruits are independent variables? And you want us to believe that we know this via calculus and genetics/evolution? What color are they when green (both an age descriptor and color)?
You then went on to admit: ” but the basic physics indicates these variables are related to one another.” I never said they were not related. I even identified that relationship — climate factors.
But you seem to want me to do basic science to answer your question: “we may not know the exact magnitude of the influence of one on the other,…”(reconcile) when the consensus scientists are not clear as you admitted.
This article was about the NOAA Report, just what is it you want to talk about? I identified some problems with it as has others.
corev, the colors of the fruits are independent of one another. whether the banana is yellow, or red, or pink, it has absolutely no influence on the color of the lime. independent. one cannot make the same claim with respect to surface temps, ocean heat content, and sea levels. these items are correlated with one another-they are not independent. arguing otherwise is nonsense.
Baffled, you seem to argue well with yourself. ” one cannot make the same claim with respect to surface temps, ocean heat content, and sea levels. these items are correlated with one another-they are not independent.” I’ll repeat —
” I never said they were not related. I even identified that relationship — climate factors.” Where did you get the impression: “arguing otherwise is nonsense.”
If you prefer to ignore the influences of genetics & evolution in selecting fruit colors to make claims of their ?independence? OK. I’m just not that sure.
Menzie,
What was your curiosity with regards to my thoughts on this NOAA study?
one didn’t need the NOAA article to know there was no pause
nottrampis, you do realize the basic problem with his analysis is he doesn’t look at the period hiatus period which is currently ~18 years 5 months using the satellite data. You do realize that using GISS is almost the same as using NOAA, and both are now outliers. What dates did he use? Dr McKitrick in his paper, started from the end and worked backward to find the length and amount for the hiatus. Do you understand that the hiatus is defined by using an OLS analysis, and that using nearly everything but OLS is mathturbation (his word).
you obviously didn’t read his article by your comments.
I’ve read it several times. For some it takes that many times to figure out what are the tricks. I made several points about his article, dispute them?
corev, “You do realize that using GISS is almost the same as using NOAA, and both are now outliers. ”
how many “wrong” data sets need to exist before you no longer consider them “outliers”?
Baffled asks a good question: “how many “wrong” data sets need to exist before you no longer consider them “outliers”?” The number is unimportant if they are converging.
The two satellite datasets are converging. The NOAA/GISS surface datasets are diverging from the satellite data and now the NOAA dataset is diverging from even the other surface datasets. Since GISS starts from the already adjusted NOAA data. Adds its own adjustments and should then also be divergent.
http://www.livescience.com/48943-quiet-2014-hurricane-season-ends.html
And I am not trying to generalize this to any anti AGW comments. Just pointing out that kerfluttering about Sandy cause it was in the Noo York Times and all…not statistically relevant.
More to the economic impact of a warming climate:
http://web.stanford.edu/~moore/HealthBenefitsofWarmer.html
http://www.norden.org/en/news-and-events/articles/the-primary-industries-must-reap-the-benefits-of-a-warmer-climate
… and many more.
Oh, but opposing views…. Yes, Sigfried, there is great uncertainty. Could things be worse or better? Yes. There is an unfounded presumption that our present climate ranges are optimal.
Let’s hear from the leading economists. Better or worse? Basis?
Considering that homo sapiens is a tropical species that has used tools to adapt his environment to his survival needs, it would seem that a warmer climate, longer growing seasons, and less need for fossil fuels might all be good things. Oh, the polar bears thing. Well, they will just mate with brown bears and all will be well. Adapt is the watchword.
Just to correct some errors…and there are plenty of them:
(1) Most global warming models do not predict more hurricanes; they predict fewer hurricanes but more intense hurricanes.
(2) There are plenty of years in which the number of hurricanes that land on US soil is fairly small while the total number of hurricanes is well above average. The world is larger than just the US.
(3) Steven Kopits is confused about growing days. Agronomists look at growing hours, not days. Most crops (viz., corn, soybeans, cotton, rice) have a fairly narrow temperature range. For most crops the optimal temperature is in the mid to high 80s. Corn and soybeans quit growing when daytime temperatures hit around 90 degrees, and the drop off in plant growth is nonlinear. There’s a lot of literature on this. I would be happy to provide him with links.
(4) If you don’t believe the NOAA data, then try believing seed catalogs. Compare the zones from 40 years ago to the zones today. Or observe how animals are coming out of hibernation sooner than they did 40 years ago. Or observe how Vermont’s maple syrup industry is disappearing because the sugar maple trees have migrated north into Canada. It’s pretty hard to explain these facts while denying that the Earth is getting warmer.
(5) CoRev doesn’t know a thing about time series analysis. Zilch. Nada. Zero. Anyone who understands how to do time series analysis correctly knows perfectly well that there has not been any “hiatus”. There has been a slowing in the rate of temperature growth, but not a flattening out. And his comment about OLS is just stupid. But then again, look at his source. It’s the same guy who deluded himself into thinking he had demolished the hockey stock theory, but then got his brains beat out by teams of real experts who pointed out how he botched his principal components analysis and that if he’d done it correctly he would have found that the hockey stick theory still holds. Not that CoRev would even understand how to do a principal components analysis.
(6) Smuckers asked if there are any papers that look at fat tails. The answer is yes. Marty Weitzman of Harvard has written quite a lot about fat tails. Weitzman correctly argues that in almost any risk/loss analysis you should look at the tails, not the center of the distribution. That’s why insurance companies look at Q-Q plots rather than P-P plots when fitting empirical data to theoretical distributions.
2slugs at his amicable best. Always self assured and almost always wrong on climate issues.
CoRev,
I never said I was an expert on climate science. I’m a long ways from that. I do know that CO2 will warm the atmosphere. The unknown isn’t whether CO2 warms the atmosphere (that’s something that can be shown in labs and is predicted by quantum mechanics). The question is the extent to which the Earth can dampen and absorb that warming effect. But I’m not an expert on climate science, which is why I do acknowledge that there is a broad consensus among people who are experts; an that consensus argues that the climate is warming and that humans are largely responsible for that warming. They might be wrong, but if you’re a betting man you’d probably want to heed what credentialed experts say rather than some TV weatherman with a high school diploma and a website. OTOH, I do know a fair amount about time series analysis and how to evaluate risk and loss functions when there is great (Knightian) uncertainty, and Weitzman has it exactly right. With thin tailed distributions, such as a normal distribution, the odds of a seven standard deviation occurring are impossible. But with a fat tailed distribution seven standard deviation outcomes are not especially rare. Only a complete fool talks about the middle of the distribution when the tails are fat.
And oh by the way, you’re not an expert on climate science either. And you’re definitely not an expert in time series analysis.
Bruce Hall: You’re showing your “US only” bias. There’s plenty of empirical evidence that shows warmer temperatures will kill more people. In fact, there’s a recent NBER paper that estimates the increased likelihood of death with each one degree temperature increase. If you live in Minnesota then global warming might sound attractive. But if you live near the equator you’ll die much younger thanks to greedy geezers in the US driving their gas guzzling RVs down the interstate. Also, both agricultural and non-agricultural productivity falls as temperatures rise above a fairly narrow temperature band. If you think global warming at the tails simply means wearing a lighter jacket and enjoying a few more days of golf and BBQs, then you really don’t have a clue. If you live in the lower third of this country and if we get warming at the .05 tail, then the typical summer day for your grandchildren will be hotter than it is in Saudi Arabia today.
2slugs, let me add nuance to your understanding re: “I do know that CO2 will warm the atmosphere. The question is the extent to which the Earth can dampen and absorb that warming effect.” Where did anyone question the physics of the Green House Effect (GHE) warming? But, your question is wrong. The Earth clearly dampens and absorbs the GHE warming. The real question is how much of the warming is due to the GHE? Following that question is: How much of that GHE effect is from anthropogenic Green house Gases? And finally, what are the effects of this GHE warming?
Where you think scientists agree on: “the climate is warming and that humans are largely responsible for that warming.” is actually not true. If science has not answered the first 2 above questions, how does it follow that scientists have a consensus on warming and its causes? If you doubt that position look at the flaws in the consensus studies, and find the answers to the 2 above questions in the literature.
Your understanding of AGW is fatally flawed in that it requires the answers to all the 3 questions I posed above to be significant. If we do not have the answers to the questions, then the concerns are based on faith and belief alone. The climate change models have been consistently wrong. The science as early as Arrhenius and continuing to today has been consistently predicted higher than actual temperatures indicating the scientists have over emphasized the GHE from the beginning.
Is there a GHE? Of course there is, but how important is it to dampen and absorb the” warming effect”? (Warming effect is your term & using “effect” implies the GHE. If I am wrong on your meaning, please clarify.) Warming is almost complete from solar energy. Particularly in the visible range wave lengths. Not the Infra Red. The oceans/seas are number 1 dampener and absorber of this energy causing the planet to warm. The big difference is that their ability to effect temperatures exists for far, far longer periods than GHGs. GHG warming exists for sub-second time periods when it absorbs and releases a photon vibrating in the IR wave lengths. Some of that release is back to the surface causing a delay in the cooling/warming. There is not ?trapping? for any length of time.
The oceans/seas also absorb the solar energy. The biggest difference form the atmosphere is that they actually hold and carry that energy for long, long periods of time. Once stored the ocean currents can carry that heat pole to pole, but they take centuries to carry that stored (primarily visible light) energy back to the surface. That is the simple explanation of the primary storing and the primary dampening processes on the planet. If you do not understand the oceans/seas then you do not understand the climate. Emphasizing the atmospheric GHGs is the wrong place.
This article is about the latest NOAA report and the effect of its adjustments. I mentioned just a few of the flaws in it, why not discuss them? It should be obvious that the oceans are critical to measure temperature change. The most recent science has attempted to explain the hiatus with some growing emphasis on the oceans and seas. Does NOAA add to the knowledge or confuse their effect?
2slugs, I often use this graph to explain how the emphasis on ACO2 (not just CO2) is misplaced: http://woodfortrees.org/plot/rss/from:1980/scale:50/plot/esrl-co2/from:1980/offset:-335/plot/rss/from:1996.6/scale:50/trend/plot/esrl-co2/from:1996.6/to/offset:-335/trend/plot/uah/from:1996.6/scale:50/plot/uah/from:1996.6/scale:50/trend
Furthermore, since you pointed out statistics as an issue, this article may add some fodder for you to discuss: https://chiefio.wordpress.com/2015/06/12/trend-vs-range-vs-causality-in-temperatures/#comments
“Where did anyone question the physics of the Green House Effect (GHE) warming? ”
the entire denier movement arose from questioning this effect. it has evolved over time, as the evidence became undeniable. but in the beginning, the green house effect was denied rather vigorously in many political circles.
corev, i agree with you regarding the oceans as a major influence on the energy storage of the planet. but recent data suggests the oceans, including deeper levels, are increasing in temperature (thus increasing in energy content). we appear to be having a net increase in energy content of this rock we call earth. what is causing this increase in energy content? either the sun is inputting more energy into the system, or we are changing the insulation system (atmosphere) in a way that keeps more energy in the system. if that change is natural, fine. but if that change is man made, then we ought to seriously consider what we are doing today and how it will affect tomorrow.
Baffled, much of the recent science has been aimed at explaining the hiatus, and has nearly completely listed NATURAL variability to be a major factor. Natural = Nature.
Your perception of the early arguments are wrong. The arguments are and always have been based upon how much and what was the influence of mankind on climate. IOW AGW was the issue not the GHE. We all agree that mankind has some local influences, land use, UHI, and aerosol pollution, even ACO2, etc are just a few of the accepted influences. But as always the science has failed to estimate HOW MUCH difference they made.
I am forever amazed at how AGW “believers” can ignore the obvious that the total influence is over a very small number, ~0.8Ctemperture increase in the past nearly 1 1/2 centuries, but want to make this increase totally man made. What is even more amazing is AGW “believers” willfully ignoring the benefits we have seen in the warming climate regime. That documented history! Not speculative science modeled to project/predict possible futures.
Then we see the willful denial of the hiatus, also documented in the data, with NOAA now adjusting/changing the source data to disappear the hiatus, it becomes a serious issue if there is actually any meritorious science in the AGW climate arena.
2Slug, I only cited studies that provided a more generalized view… not just U.S. weather data based. There is no doubt that change means “different from now”. I’m not sure what the “plenty of empirical evidence” is to which you refer except anecdotal linking of a particular weather event to someone’s view that it is tied somehow to a one or two degree change in temperature, globally, that has occurred in the past two centuries. There is historical evidence that during the Roman Empire and again in the middle ages, temperatures were warmer and humans thrived as a result. Geologically, there is evidence that during warmer periods the Sahara was a large savanna and during colder periods the Amazon was not the tropical jungle that is the darling of environmentalists.
Again the point: There is an unfounded presumption that our present climate ranges are optimal.
I thought that the following was interesting:
Five G7 nations increased their coal use over a five-year period, research shows
Britain, Germany, Italy, Japan and France burned more coal between 2009 and 2013 and demanded poor countries slash their carbon emissions
http://www.theguardian.com/environment/2015/jun/08/five-g7-nations-increased-their-coal-use-over-a-five-year-period-research-shows
noaa.gov is biased and has a political agenda. Don’t fool your readers.
But unpredictable chaotic systems are an interesting topic, keep on doing Menzie. Greetings from Benoit Mandelbrot.
Remember when back in 2000 AL Gore predicted that the ocean levels would rise to cover most coastal cities? HAHAHA