The Bureau of Economic Analysis announced today that U.S. real GDP grew at a 2.3% annual rate in the second quarter. You can’t describe the new data as favorable, but I’m still hopeful about what comes next.
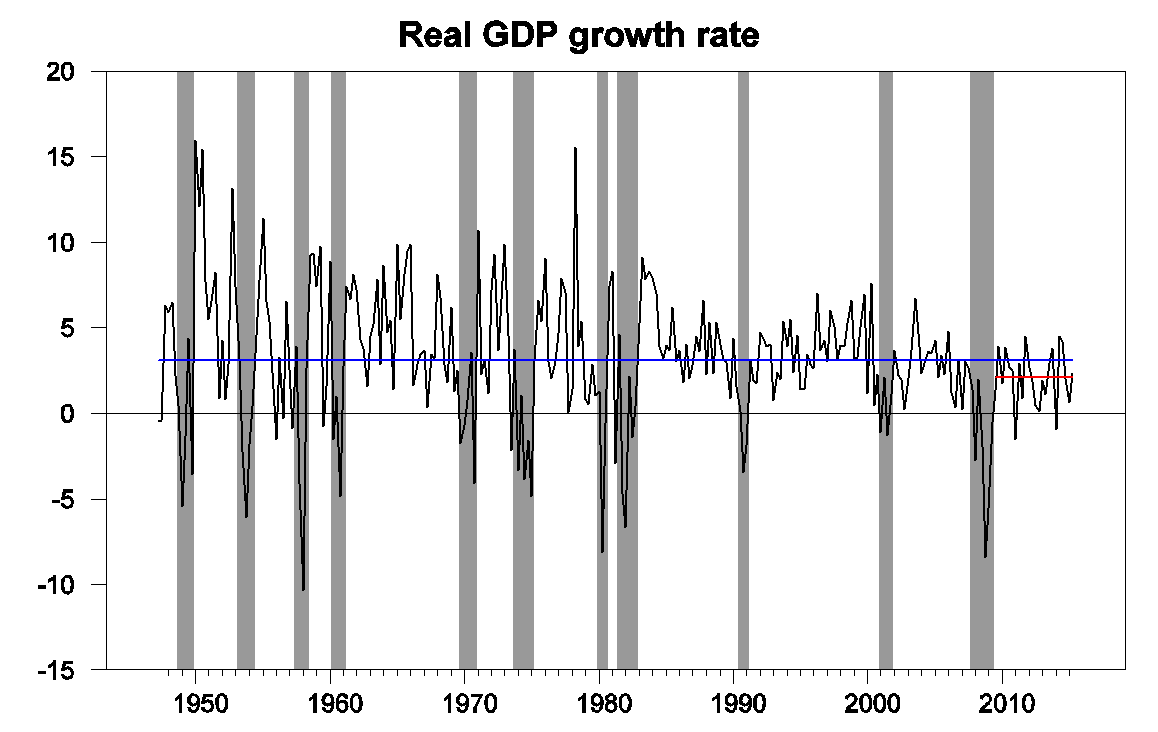
U.S. real GDP growth at an annual rate, 1947:Q2-2015:Q2, historical average rate (3.1%), and average since 2009:Q3 (2.1%).
GDP growth since the end of the Great Recession in 2009:Q2 has averaged 2.1% per year, a full percentage point below the average over the entire 1947-2015 period. And that 3.1% includes both recessions and expansions. Moreover, the benchmark revision of the last three years of data that accompanied today’s report didn’t help. Although the new data revise the weak numbers for the first quarters of 2015 and 2014 up a bit, the BEA now estimates that annual GDP growth averaged 1.9% (logarithmically) over 2012:Q1-2015:Q1, down 0.3% from the 2.2% that had initially been reported for that period. Jason Furman attributes much of the downward revision to “a new methodology for calculating the price of financial services spending and revisions to source data on services.” In any case, the bottom line is that the post-2009 expansion, which we already knew was very weak by historical standards, now appears to have been even weaker.
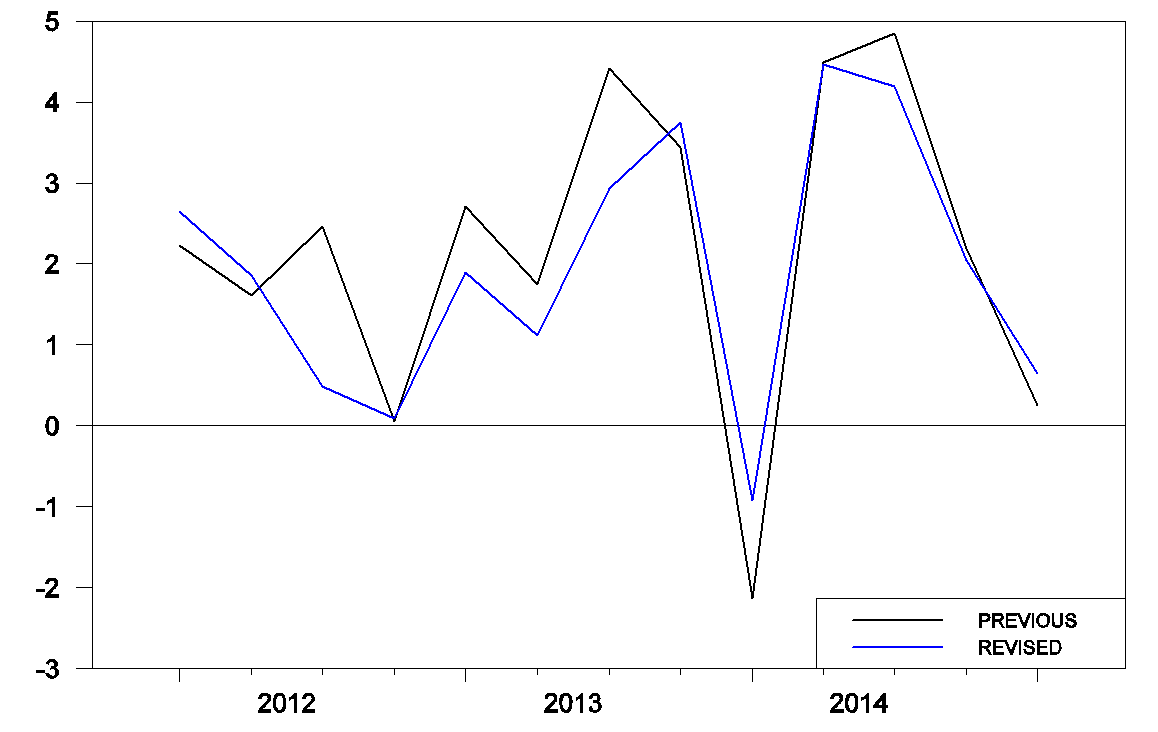
Real GDP growth at an annual rate as reported on April 29 and July 30.
The recent weakness has brought the Econbrowser Recession Indicator Index up to 13.3%. The index has now shown a modest spike up with each of the last three weak winters. The index uses today’s data release to form a picture of where the economy stood as of the end of 2015:Q1.
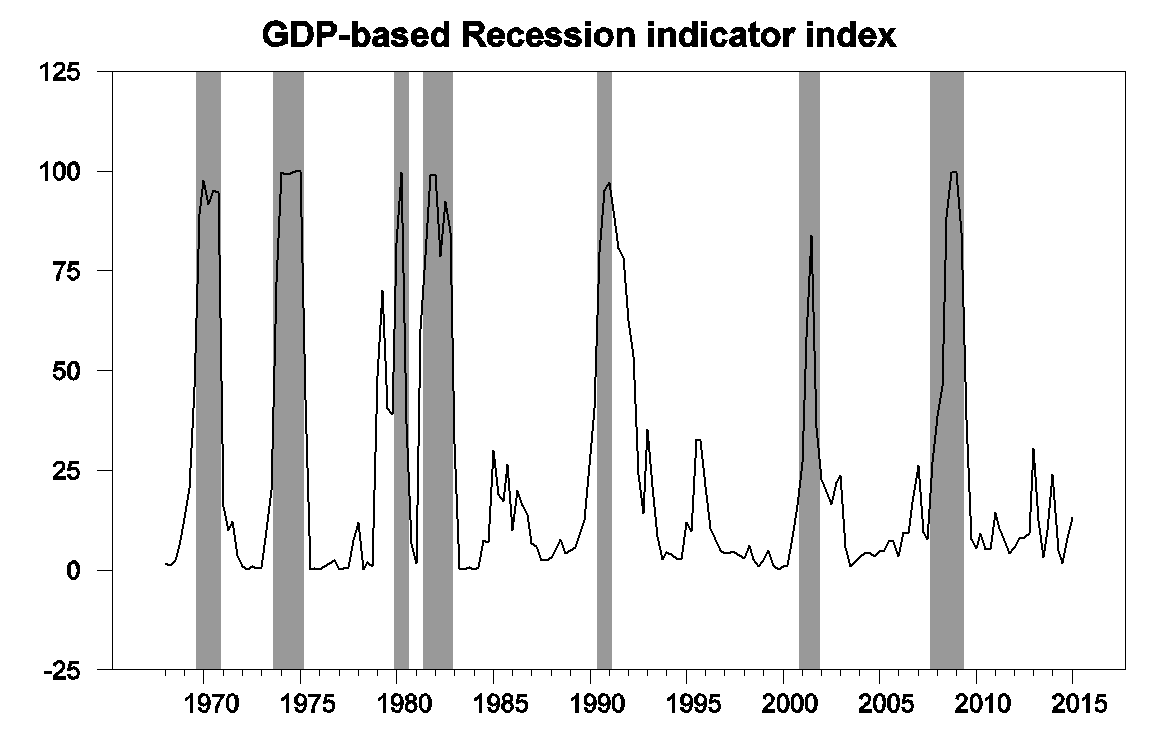
GDP-based recession indicator index. The plotted value for each date is based solely on information as it would have been publicly available and reported as of one quarter after the indicated date, with 2015:Q1 the last date shown on the graph. Shaded regions represent the NBER’s dates for recessions, which dates were not used in any way in constructing the index, and which were sometimes not reported until two years after the date.
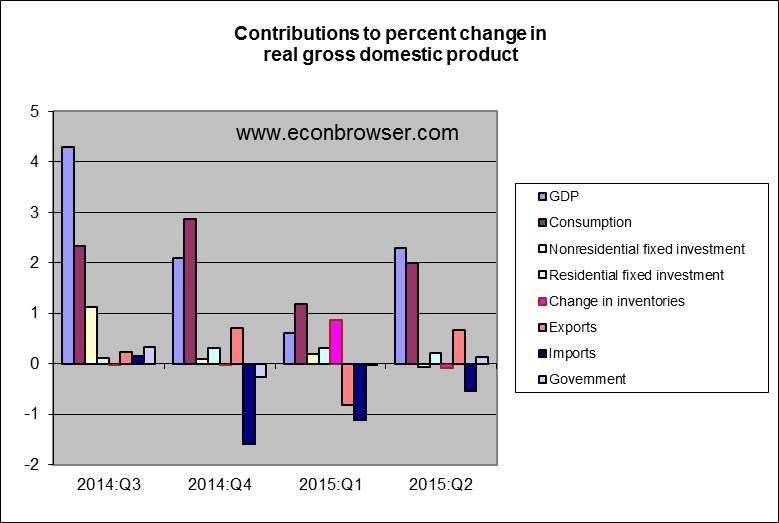
In terms of the drivers of the 2.3% Q2 growth, there’s really only one story– consumer spending. While exports made a technical contribution to the change from Q1, this was only a partial rebound from the exceptionally low Q1 exports, which had been temporarily reduced as a result of Q1 work disruptions at west coast ports.
It’s interesting to speculate on the role of oil prices in the recent GDP numbers. The fall in oil prices since last summer was of course a boon for oil consumers and a bane for oil producers. Usually consumers respond pretty quickly to windfalls in spending power, whereas oil producers take significantly longer to cut back their investments. But this time the consumer response was more subdued, while the lead times for adjusting modern fracking drilling are much shorter than for conventional oil. Lower investment in the oil patch may be having an effect on the GDP aggregates.
So where are the grounds for optimism in any of this? I continue to believe that the next two graphs are very important to keep track of, which show expenditures on motor vehicles and parts and residential construction as percentages of GDP. These are two of the most important cyclical variables, accounting for a disproportionate share of the growth during booms and disproportionate share of the loss during busts. Both remain quite low today relative to their historical averages. When they return closer to historical levels (and I believe they will), that will give some boost to GDP growth. We haven’t seen it so far because the overhang from the burst of the housing bubble and associated debt problems was so big, it’s taken this long to work out from under it.
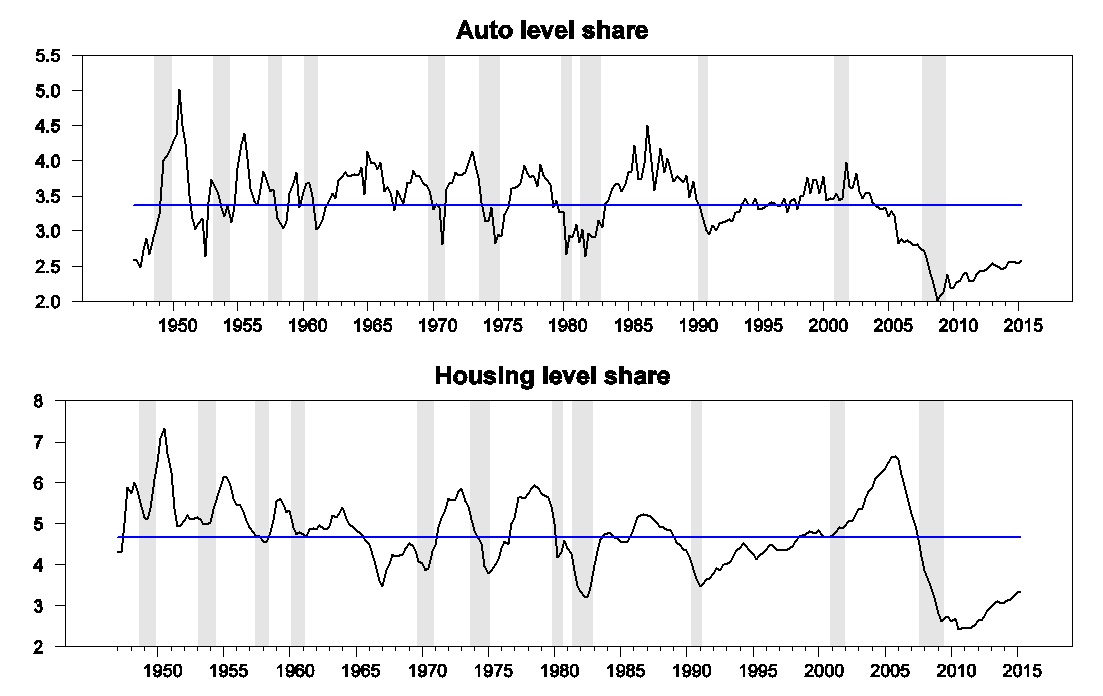
Contributions to the level of GDP, 1947:Q1 to 2015:Q2. Top panel: nominal spending on motor vehicles and parts as a percentage of nominal GDP. Bottom panel: residential fixed investment as a percentage of nominal GDP. Blue lines represent historical averages. Data source: BEA Table 1.5.5.
And once housing rebounds, the added income and sales will help bring other investment up with it. As Bill McBride has long been emphasizing:
In the graph, red is residential [investment], green is equipment and software, and blue is investment in non-residential structures. So the usual pattern– both into and out of recessions is– red, green, blue.
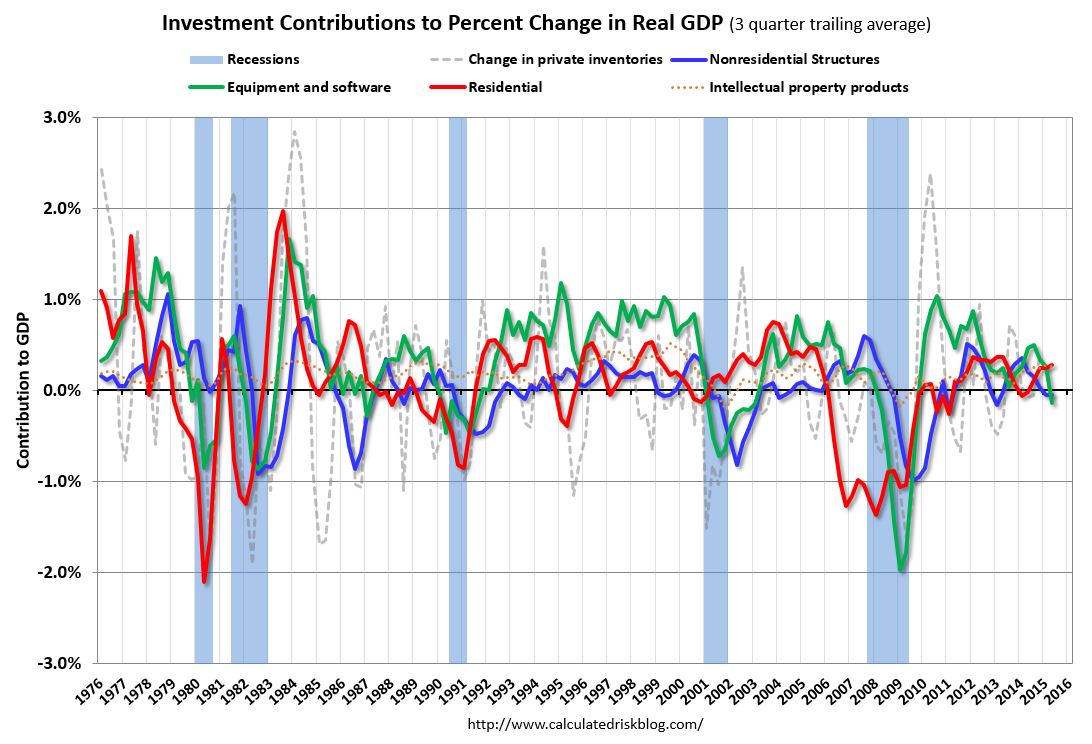
Source: Calculated Risk.
None of this is to claim that the U.S. can expect to average 3.1% growth again on a long-term basis. With slower growth of the working-age population, that won’t happen. But we nevertheless should expect a positive cyclical contribution when housing regains its traction.
I guess we’ll just have to wait a little longer.
Professor Hamilton,
You mention that we should not expect the GDP to average 3.1% growth again on a long-term basis. What long-term growth % do you expect, perhaps 2% to 2.5%?
The federal government has cut the deficit 75% since FY2009. That idiocy explains completely the slowest recovery since WWII.
Keynes would be appalled at our ignorance but I lay the blame at the feet of ideological economists whose misplaced paranoia about inflation
has led us down the wrong path for 6 years. We can’t even pass a highway bill through Congress!
LOL Paul you’re a very good troll. You almost got me.
Yes, of course! Everyone knows that Congress just passed a fully funded 6 year highway bill that fully addresses our 63,000 defective bridges among all the other obvious needs — NOT. Congress is only interested in balancing the budget or at least reducing the deficit so that the common folk will use their common sense and re-elect them.
I see no reason for any big upturn in housing or autos from here, and a lot of the slower growth owing to demographics. So the US outlook is still for more like this.
Real Estate is already upturning and has been for awhile. So has auto’s. Lets note that “share” does not mean actual production.
Precisely. There already was a strong rebound in autos and residential underway while growth was c 2%. Those sectors are not going to accelerate from here, They’re going to slow from here, at some point. Autos is volatile so very hard to read in the short term, but may have already slowed since 3q14.
Where does “historical average rate (3.1%)” come from?
Saudi Arabia is pumping 10+ MM bpd and doing it 8 years after this post, where you speculated on SA production difficulties.
https://econbrowser.com/archives/2007/02/saudi_oil_produ_1
Since then Olivier Blanchard, a sort of prestigious economist, has made the reasonable argument that if the realization that OPEC would NOT prop up the price, caused it to drop…that some component of the previous high price regime was based on an estimation that they would (after all they had during the recession).
http://blog-imfdirect.imf.org/2014/12/22/seven-questions-about-the-recent-oil-price-slump/
“The steady increase in global oil production could be seen as “the dog that didn’t bark.” In other words, oil prices had stayed relatively high in spite of the upward trajectory in global oil production due to the perception at the time of OPEC’s induced floor price. ”
Remember that oil price is forward looking. So that the believed future efficacy of the cartel will have a raising effect on current price (and the converse).
My issue is not even so much to say that for sure OPEC was behind the price AND definitely not to stay every twist of the worm has them as the 100% cause. It’s just that you don’t take them as a serious factor and aren’t open enough to thinking about cartel pricing versus scarcity rents. One thing that being open to at least considering some aspects of cartel pricing, is that you see the value of a new entrant.
At this point, for instance, it’s a pretty broad view that US LTO had a big role in cracking the cartel and driving prices down (in some ways similar to 1986…not a repeat, but at least a rhyme.) And realizing how that happened makes the people who wanted to drill ANWR and VACAPES vindicated. They had the right instinct. Even if they didn’t know that it would come out of shale (and not kerogen shale! ;-)) instead of Alaska and offshore. They were right to say drill, baby, drill, when they wanted lower prices. And Obama was wrong to say you can’t drill your way to lower prices. You sure as heck CAN!
I have personally seen little pseudocartels break down based on enabling a new supplier, just in simple things like supply chains for manufacturing. Microeconomics and behaviors of firms is very much something you see in the business world. So…don’t discount the value of marginal barrels or even more importantly of wedges from new suppliers in changing the cooperation (implicit and complicit) of colluders. You can also check out the generic drug industry for all kinds of examples of this.
http://citeseerx.ist.psu.edu/viewdoc/download?doi=10.1.1.183.5554&rep=rep1&type=pdf
Nony’s is is the correct analysis, in my opinion.
OPEC has no incentive to increase production if non-OPEC players are unable to do so. In such an event, it will follow a price-based strategy.
If a non-OPEC player is able to increase production substantially, as US shale has done, then OPEC is forced essentially into a volume strategy, that is, they must pump more if they want more revenue. Thus, US shale producers both broke the OPEC cartel and, I would argue, saved the global economy.
I would emphasize, however, that there is little economic explanation for Saudi Arabia to have increased oil production by 1 mbpd in the middle of a supply glut. The ‘market share’ argument is specious, as Saudi market share is near 25 year highs and has spent most of the last quarter decade at levels similar to those of last summer, ie, when the Saudis were pumping 9.6 mbpd.
Rather, the compelling argument is that the Saudis wished to maintain maximum pressure on the Iranians to sign the nuclear deal on the best possible terms (a hope which, I would argue, was dashed). I believe that in the US we fail to appreciate the psychological and security importance of restraining Iran. from the Saudi perspective. So, imagine you had an avowed enemy, armed with nuclear missiles, with the stated intention of destroying you and only 90 miles away. Think about that for just a second, and you’ll recognize it as the Cuban Missile Crisis. I think that’s the right was to think about the Saudi attitude towards Iranian nuclear plans. It’s an existential question.
In this light, the Saudi attempt to drive down prices prior to the signing of the Iran deal was entirely comprehensible.
On the other hand, with the deal (such as it is) signed, are low prices now in Saudi Arabia’s interest? I would argue no. And this would lead me to believe that the Saudis may cut production substantially more come September than they have announced. Just as the rhetoric was ‘maintaining market share’ on the way up, so will be ‘the markets are well supplied’ on the way down.
Shake your manly hand, Steve.
Check out my comments also in the Measuring Unemployment post below. In particular, the linked video (at minutes 22-28) has a nice statement of viewpoint on pre and post crash LTO economics. (And it sure wasn’t unprofitable–not on an NPV basis–at $100 or about to run out of resource.)
On SA, I think they are feeling their way out and watching what will happen with competing OPEC suppliers and with US LTO. I think they would be open to trying to raise price again with volume restrictions, but want to make sure that rest of OPEC and probably Russia go along. US production is something they can’t really control and they, along with the market in general, is still curious to see what the real full cost supply curve is like. To see if prices can rise regardless of shale (e.g. if demand growth is high enough, if restraint by other producers is sufficient.) It is at least a very possible outcome that we are looking more at some ceiling though (~65?). It definitely looks very different from hundred dollars here to stay.
P.s. John Kemp has a great twitter feed and daily email list. Recommend it if you aren’t already on it. He’s my favorite oil journalist. Not just a horse race reporter but more of an analyst.
I think Iran’s oil is too important to the economy during an election year for anything else to even be an afterthought.
or laugh at the BEA. GDP growth ls already 3.1%. It was 4%+ in the mid-00’s. Maybe we should question the way. I have little respect for them, but this “downward” revision is lol. My company outright rejects them now. We broke all ties.
How about a audit of the BEA?
Growth rates being discussed are adjusted for inflation, but not for population growth, i.e. they aren’t per capita.
Which always surprises me – the conventional avoidance of plugging in changes in population growth as a factor.
By the way the current (last 12 months) population growth rate is down to .73% – in fact the last 5 years have average population growth we haven’t seen since the 1930’s.
So, as a example: take 3.1% growth less the 1.25% population growth and you have 1.85% per capita as the modern long-term average.
Compared to 2.1% – .78% (last 7 years population growth average) = 1.32%
Still a slowdown, but not quite as profound.
finally, let’s not forget, that over the long haul economic growth for everyone will dwindle to nothing – that pesky, intractable problem about exponential rates.
Nice
In this “creative-destruction” process, there’s too much destruction and too little creation.
Two important factors are the student debt boom and anti-small business tax & regulatory policies.
All big businesses start as small businesses and it has become harder to start and grow a business.
In “The Impact of Student Loan Debt on Small Business Formation by Brent W. Ambrose, Larry Cordell, and Shuwei Ma:”
“Small businesses are the backbone of the U.S. economy and account for approximately one-half of the private-sector economy and 99% of all businesses. To start a small business, individuals need access to capital. Given the importance of an entrepreneur’s personal debt capacity in financing a startup business, student loan debt, which is difficult to discharge via bankruptcy, can have lasting effects and may have an impact on the ability of future small business owners to raise capital.
The authors find a significant and economically meaningful negative correlation between changes in student loan debt and net business formation for the smallest group of small businesses, those employing one to four employees. This is important since these small businesses depend heavily on personal debt to finance new business formation. Based on the authors’ model, an increase of one standard deviation in student debt reduced the number of businesses with one to four employees by 14% on average between 2000 and 2010. The effect on larger firm formation decreased with firm size, which the authors interpret to mean that these firms have greater access to outside capital.”
Business startups hit a 30-year low
May 18th 2014
http://www.kansascity.com/news/business/article366997/Business-startups-hit-a-30-year-low.html
peak,
“Two important factors are the student debt boom and anti-small business tax & regulatory policies.”
i don’t think these are equal factors. student debt boom is probably the bigger problem. the tax and regulatory policy argument is probably a smaller factor. i would imagine lack of capital (caused by debt) is a bigger obstacle than regulations for most small businesses. i have rarely heard a good entrepreneur say he could not get his business started because jumping through the hoops was too difficult-that has usually been reserved for the poor entrepreneur. lacking access to capital has been a complaint of both good and poor entrepreneurs.
so your article begs the question, what do we do about student debt issues to better encourage entrepreneurs to grow?
Baffling, I agree, lack of capital for small businesses is a major problem.
Nonetheless, the anti-small business tax & regulatory environment has progressively worsened, particularly over the past few years.
The money, time, and effort to comply with more and more regulations are more costly to small businesses than large businesses.
And, taxes have become more progressive, from lower to middle income taxpayers, which doesn’t facilitate business start-ups.
It’s a vicious cycle. As it becomes harder to start and grow a business, it causes more people to become dependent on government and fewer businesses, which causes fewer people to start and grow a business.
Here’s a report: https://www.sba.gov/sites/default/files/The%20Impact%20of%20Regulatory%20Costs%20on%20Small%20Firms%20(Full)_0.pdf
Baffling, we needed to make the economy the top priority.
With appropriate tax and regulatory reforms, this depression, which added over $5 trillion of federal debt, would’ve been avoided and the economy would’ve been able to absorb a $15 an hour national minimum wage, to raise the labor force participation rate, create more taxpayers, and reduce spending on the unemployed.
The tax cuts were too small and too slow, because the up to $800 billion a year trade deficits, before the recession, represented Americans buying foreign goods and foreigners buying U.S. Treasury bonds. Not enough of those dollars were refunded to consumers to pay-down debt and allow the spending to go on.
Instead of piling on more regulations on an overregulated economy, which stifles rather than stimulates growth, we needed to remove and reduce some of the $2 trillion a year of federal regulations. When the economy actually recovers, then taxes can be raised with new regulations to slow the expansion to a sustainable rate.
Therefore, federal deficits would’ve been much smaller and the government could’ve replaced some student loans with student grants, for example.
Looking at the Auto share graph and I reflect that I am driving a 2008 model year car because I have put off buying a new car. Part of it is confidence in the build quality (my previous car was just sold to a 3rd owner at 215,000 miles.) The other part is the cost of a new car. Somewhere along the line, I remember reading that the average age of the autos on the road is at an all time high.
Question for the group: Have you put off purchasing a new car? And if this is a valid trend,will the auto share ever go back to the historical average?
Who is going to buy all these homes? Young people working at starbucks and buried in student loan debt?
HUD
https://research.stlouisfed.org/fred2/graph/fredgraph.png?g=1xXA
https://research.stlouisfed.org/fred2/graph/fredgraph.png?g=1xXD
as “SecondLook” already pointed out, looking at it “per capita” is key
And long term.
Using the data source: http://www.measuringworth.org/usgdp/
I plotted on http://de.slideshare.net/genauer/sampler-2-of-imf-2014-weo-data-plots page 8, (300 years UK page 9)
the full US history of population, GDP per capita, and the deflator.
It was the civil war which accelerated the real growth form 1 to 2%, inflation like in the 1970ties did not help nor harm, and the difference of total GDP growth between now and the post war decades is in the population growth
In Germany we do not believe in the popular American leftie myth that government running up deficits helps long term growth.
We tried those “Beschäftigungsprogramme” in the 1970ties
“The Truth About Germany’s Post-Reform Deficits
Berlin’s pro-growth efforts in the early 2000s saved money rather than require extra spending.”
http://www.wsj.com/articles/the-truth-about-germanys-post-reform-deficits-1415215448
From Otmar Issing, former chief economist of the ECB, Nov 5th, 2014
The IMF data showing that:
http://de.slideshare.net/genauer/gd-pper-capita-in-ppp-us-versus-euroarea-germany
please take also a look at the dismal performance of the UK, compared to the rest, with some “austerity in name only” with both 5% current account deficit and government deficit.
The same holds for the Sweden example, recuperating from a strong dose of socialism , after 1989, while reducing debt.
http://de.slideshare.net/genauer/imf-2014-weo-data-sampler-3-kompatibilittsmodus , page2, begin back relative to the US and the world just 10 years later, but with Government debt strongly reduced to just 50% GDP in 2002, down from 70 just 6 years earlier, 36% in 2012 and not increased like the US exploding now to 105%
These IMF data are in stark contrast to wild claims by some Philip Lane (highest Irish RePeC score) made in his “Geneva Report” paid by George Soros.
Just a schematic drawing for something with data readily available, why?
(side remark: That graph also shows that Russia recovered from the moment on, they kicked out all American “advisors”, like Anders Aslund from the Peterson Institute, and https://en.wikipedia.org/wiki/Andrei_Shleifer
“In 1997 USAID canceled most of its funding for the Harvard Institute for International Development (HIID) after investigations showed that top HIID officials Andre Schleifer and Johnathan Hay had used their positions and insider information to profit from investments in the Russian securities markets. Among other things, the Institute for a Law Based Economy (ILBE) was used to assist Schleifer’s wife, who operated a hedge fund which speculated in Russian bonds [15]”
Long term sustainable growth depends on structural improvement, like Germany, Sweden, Russia have shown, and not short term monetary gimmicks
Now I would like to see some RECENT (like post 1970) evidence / examples from the leftie / Keynesian crowd for fdebt financed bubbles being good in the long run
Two observations:
1. You mention that “lower investment in the oil patch may be having an effect on the GDP aggregates”. Indeed, this jumps off the page when you look at NIPA Table 5.3.2 (“contributions to percent change in real private fixed investment by type”), where the contribution from “mining exploration, shafts, and wells” was -2.75% in 2015Q1 and -4.15% in 2015Q2. Considering that aggregate real growth in private fixed investment was 3.3% in 2015Q1 and 0.8% in 2015Q2, these are massive contributions; without the fall in drilling, we would have had roughly 5% aggregate investment growth in each quarter, more or less continuing the rate of growth in 2014!
Since private fixed investment is about one-sixth of aggregate GDP, you can divide these figures by six to get the contribution of this one line to aggregate GDP growth, obtaining roughly -0.45% in 2015Q1 and -0.70% in 2015Q2. Not decisive, but a pretty big deal – almost offsetting the (positive) real growth contribution of durable and nondurable goods PCE combined!
2. You mention that you think that motor vehicles and parts, and residential investment, will return to their long-run average shares of GDP. I don’t know about the former, but I think there’s reason to be doubtful of the latter. Recall that residential fixed assets are equal to about 105% of GDP, a figure that is close to the long-run average; residential depreciation is something like 2.4% of GDP. To stabilize at the 105% figure, assuming that depreciation stays constant, gross residential investment as a fraction of GDP must be:
105%*(real GDP growth rate – residential relative price growth rate) + 2.4%
If we continue to experience 2.1% aggregate real growth on average, and we assume a 0.8% rate for relative price increase of residential structures (for the last several decades the trend has been somewhere between +0.6% and +1.0%, depending on when exactly you start), then this becomes about 3.75% of GDP, almost an entire percentage point below the long-term average displayed in your chart, and not too far above the 3.3% of GDP we have now.
Of course, this calculation would be changed – maybe dramatically – by a faster growth rate or a slower rate of relative price appreciation, but I doubt either of those. The long-term growth slowdown is partly driven by demographic fundamentals, and the long-term relative price appreciation of residential structures is driven by comparatively anemic productivity growth in the construction industry.
This logic does not apply to the auto industry, since there net investment is a much smaller share of gross investment (depreciation is much more rapid), so a slowdown in trend growth doesn’t change the steady-state level of auto investment very much. I see no particular reason to think that the motor vehicle share won’t eventually recover to its long-term level, but then again I’m somewhat shocked and mystified that it’s still so low, so I’m not sure that I know what’s going on.
the future is bright.
Brent just dipped under $50 and WTI is nibbling at $45.
http://www.wsj.com/articles/nymex-september-oil-futures-hit-4-month-low-at-46-81-bbl-1438567753
[And it’s not just a near term glut and a deeper contango structure as CLZ6 (DEC2016 WTI) has dropped a couple bucks also and is now in the 52s. The market thinks the medium term price expectation is low.]
I think the subtitle of the article, “Record U.S. production has led to international competition to produce more, cut prices, fight for customers ” expresses a fundamental microeconomic concept. One that I argued should at least be CONSIDERED more thoroughly last summer.
And yes, of course, there are many other complexities like forward looking nature. Also demand. [But even here, actual volume has not decreased as in 2009, just the perception of future increases in volume from China.] But the fundamental analytical frame of disaggregating markets by segmenting production and consumption and then considering the effect of changes to supply and/or demand and how that shifts the price equilibrium are very helpful.
Crude getting slammed a bit more today. Down to 43.75 and nearing lows for the year for month ahead.
If you just look at the actual SEP15 contract (CLU5), it is actually the lowest ever. Was about $95 last summer at its peak. Since then, it dropped precipitously, but even at the lows of JAN and MAR last year was around $50, showing a view that the market would work off a glut. Didn’t happen.
http://www.marketwatch.com/investing/future/CLu5/charts?symb=CLU5&countrycode=US&time=9&startdate=1%2F4%2F1999&enddate=8%2F7%2F2015&freq=1&compidx=none&compind=none&comptemptext=Enter+Symbol%28s%29&comp=none&uf=7168&ma=1&maval=50&lf=1&lf2=4&lf3=0&type=2&size=2&style=1013
On a further out time scale, the DEC2019 contract is also at its lowest, at just over $60. A contango sure, but still a massively different view now than last summer. Then the contract sold for $88 at its peak. Since then the contract dropped to $66 in JAN and $64 in MAR.
So current view is a dramatic reduction of almost $30 in terms of the long term assessment of pricing. It’s hard to pin that all on demand either as macro issues (the “cycle”) are more temporary and easier to predict near term than far out. It seems like a large part of the difference is likely due to less scarcity premium (peak oil or peak oil “lite”) or less OPEC influence (the threat of it, even) on the market.
http://www.marketwatch.com/investing/future/CLZ9/charts?symb=CLZ9&countrycode=US&time=9&startdate=1%2F4%2F1999&enddate=8%2F7%2F2015&freq=1&compidx=none&compind=none&comptemptext=Enter+Symbol%28s%29&comp=none&uf=7168&ma=1&maval=50&lf=1&lf2=4&lf3=0&type=2&size=2&style=1013
The shale revolution, growing at 4.5 MM bpd in about five years seems like the likely cause of the new view, along with the threat of continued production growth if prices try to rise back to ‘hundred here to stay’. Or even the continued evolution and improvement of the extraction of LTO. (Look at what has happened to US nat gas.)
So instead of dismissing LTO, it should be recognized as one of the biggest changes in the energy landscape. And then really it should be dived into to understand it, to pick it apart, to consider scenarios for it. A much deeper examination than dismissal because of individual well declines (really a sound bite…that decline is well known and what is relevant is field performance, not wells) or claims on profitability at $100. [Similarly, these were very surfacey, with a non NPV modeling aspect, with people not understanding that 30% growth necessarily means capex will outspend cash (after all capex is for future returns, that is a basic aspect of project financing), or with mistakes like people including interest payments in cost and then charging a WACC on top of that…read Copeland Valuation for the basics on why this is wrong, it’s not even debatable, it’s a math/logic error to include interest cost as en expense and then insert it in the discount rate also.]
Also while shale gas is not the same as oil, it does have some interesting suggestions for parallel lessons. One thing is that price has remained low and supply actually increased dramatically. This despite many more years of comments about how it was a bubble, needed high price, individual wells had high decline, etc. In fact, if you see it hanging in in production, and you do accept the decline curves (and I do), then it shows it is possible to “keep drilling” as a business model. IOW, oil and gas production should not be slammed because it is not an infinite annuity. Instead it should be considered with classical project financing considerations on a forward looking basis and with the asset itself. Similarly it’s pretty irrelevant if some players overpaid landowners for acreage during the boom, if CHK is shakey, etc. All that is sunk cost. (And continued volume of production several years out, along with agreed decline curves shows it is not a dotcom bubble.)
These will be important things to keep in mind if we see the market balance with some overextended shale oil players going bankrupt. That is natural capitalism and the important thing is to see what production can be sustained at what price. Not the players or their past decisions.