How important would an economic downturn in China be for the United States?
Paul Krugman reviews some of the reasons why the United States perhaps shouldn’t worry too much:
China’s economy, while big, is still a small fraction of the global economy– about 15 percent at market exchange rates…. Chinese imports from the rest of the world are less than 3 percent of the ROW’s GDP. Suppose China experiences a 5 percent slump in its own GDP; given an income elasticity of 2, which is reasonable, this would mean a 10 percent fall in imports– but that’s a shock to the rest of the world of just 0.3 percent of GDP. Not nothing, but not that big a deal.
I’ve long believed that to understand business cycles we need to consider not just net flows but also gross interdependencies. A downturn in China will affect some businesses much more than others. If specialized labor and capital do not easily move to other sectors, that can end up having significant multiplier effects.
For example, while China may only account for 15% of world GDP, it has been a huge factor in commodity markets over the last decade. According to EIA data China accounted for 55% of the increase in global petroleum consumption between 2005 and 2013. IMF economists Arezki and Matsumoto note that China now accounts for about half of global consumption of iron ore, aluminum, copper, and nickel.
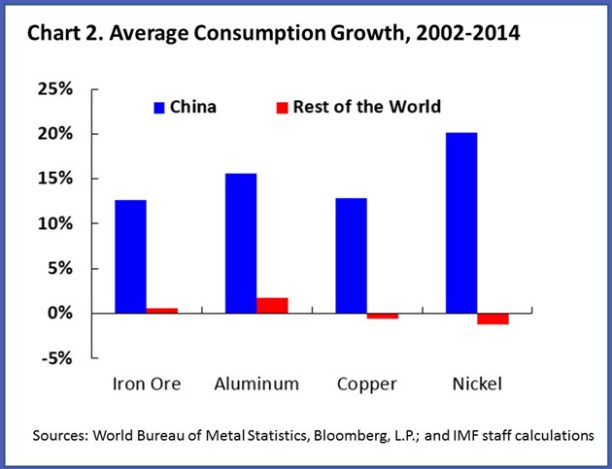
Source: IMF Direct.
U.S. exports of goods and services to China in 2014 were $167 billion, only about 1% of U.S. GDP. But U.S. investment in mining structures (explorations, shafts, and wells) amounted to $146B at an annual rate in 2014:Q4. By the second quarter of this year that number was down to $89B, largely a result of cutbacks in the U.S. oil patch. This means that in the absence of offsetting gains elsewhere, this development alone has already subtracted about 0.3% from U.S. GDP.
Of course, lower commodity prices will force layoffs for oil companies and miners but leave more money in the hands of consumers. However, additional spending from that channel has been more modest than many of us were anticipating.
Another concern comes from financial linkages. A Chinese downturn will unquestionably be a big hit for certain financial institutions. Exactly who those will be and what it means for the rest of us, I don’t know. As Warren Buffett observed, “you only find out who is swimming naked when the tide goes out.”
The bottom line is that an economic slowdown in China already is a very big deal for some U.S. workers and businesses. I don’t know what the ultimate implications for the U.S. of a significant recession in China would be.
But things I don’t know cause me to worry.
“The bottom line is that an economic slowdown in China already is a very big deal for some U.S. workers and businesses. I don’t know what the ultimate implications for the U.S. of a significant recession in China would be. But things I don’t know cause me to worry. ”
I read this and thought if I change a couple of words I could incite the climate change deniers.
The bottom line is that a global temperature rise could be a very big deal for some U.S. workers and businesses. I don’t know what the ultimate implications for the world of a significant rise in temperatures would be. But things I don’t know cause me to worry.
Sorry to high jack the post but I couldn’t help myself.
China’s import volumes of crude oil were up 9.8% y-o-y in 8m15, so the effect you’re describing hasn’t happened yet.
I think the US oil production decline is mostly a domestic cycle, following earlier overinvestment, which was to some extent driven by wrong hopes that the Saudis would accommodate higher US output by cutting theirs. The global knock-on effects are mainly among oil producers, many of which didn’t pass on the oil price drop to their domestic consumers, and many of which have reacted to falling oil prices by increasing their net energy exports.
But the general tone of caution about China I agree with. The main effect from China globally has been to reduce prices of building materials and metals, especially iron ore.
Tom, WRT to China’s oil imports, take a look at China’s oil production, consumption, imports as a share of consumption, net imports of oil, the extent to which China is storing/hoarding oil as a share of consumption, and electricity consumption, and the aggregate suggests that the Chinese economy is growing at a fraction of the reported 7% real rate.
I agree China’s growth in 1h15 appears about doubly overstated. But it’s a mixed picture. The electronics industry as of latest data still doing well as US and European demand are up. Heavy industry and construction very poorly. Consumer sectors middling. When looking at imports, be very careful to distinguish between values and volumes. China gets big direct benefits from the collapse of the oil price, at the same time as indirect costs eg to its exports to oil producers.
Tom: The main effect from China has been to wreak havoc on EM economies. Simultaneous with the reversal of the US dollar carry trade, this has caused an increasing number of EMs to tilt toward recession. EMs (ex China) have the largest ppt contribution to global growth this recovery. When the locomotive slows, the train slows. EM currencies are plunging. To support them, monetary policies are being tightened. Much EM corporate and sovereign debt is denominated in dollars. Hence the need to support currencies to service debt and stave off default. Debt now drives the globe – downward! The effects of decades of Keynesian deficit spending and central banking run amok are coming home to roost. Since 2014:Q1, the net export contribution to real GDP has been minus 0.6%. Another leg down coming. The daisy-chain from EMs to the US is multi-stemmed real and financial. Growing fissures in the financial system are the worry. US QEs went into the stock market and via the carry trade into EM debt. All this is unwinding, as it was always going to. Promises to become known the Great Unwind.
Well there are several kinds of havoc on EM economies being wreaked, not all of which are coming from China.
One is the collapse of the oil price, hitting EM oil producers, coming from US production. That benefits China directly but hurts it indirectly as oil producers were a big source of China’s export growth and especially demand for metals and construction materials.
A second is the collapse of other commodities prices, hitting EM producers of them, coming partly from the slowdown of construction among oil producers and partly from the slowdown of construction in China.
A third is a general drop in confidence in EMs in financial markets especially relative to the US economy, which to some extent can be blamed disproportionately on China but is really about most EMs generally. Eg Turkey has the same problems you describe and I doubt that has much to do with China. Remember that the US current account deficit is equal to the flow of accumulation of dollar assets among the rest of the world, and that’s not unwinding or even slowing.
What must be understood is that China’s “miracle” was not an organic process but one “made in the USA” (and in part Japan), in that US supranational firms have invested (via offshoring in search of labor arbitrage) trillions of dollars since the 1980s-90s, resulting in a scale and rate of growth per capita in China that otherwise would not have occurred.
US and Japanese FDI peaked in 2011-13 and began contracting in the past year or so, not coincidentally when China’s “exports” (largely from US and Japanese firms’ production of components, intermediate goods, and finished goods) and goods-producing sectors began to contract.
Since 2013, China’s labor force has been contracting. Along with reported wage growth, contracting production, M1 and M2 growing 9-13%, and money supply at ~195-200% of GDP, China’s productivity is growing no faster than ~1%. Then, at a population growth rate of 0.5%, in aggregate, China’s real potential GDP per capita hereafter is effectively 0%, which is the post-2007 average trend rate (new normal of secular stagnation) for the US, EZ, and Japan.
This outcome was never in doubt, as it was implied by the precedent of the middle-income trap, excessive debt to GDP, and the demographic drag effects China is now experiencing, as is occurring for the countries that make up 70-75% of world GDP.
Moreover, under these conditions, it should be no surprise that growth of trade has peaked and begun contracting, as the US-China “trade” flows made up the largest share of global “trade” for what I refer to as the Anglo-American imperial trade regime, which is not unlike that of Britain from the 1870s-80s to WW I.
Now with the onset of the cumulative, self-reinforcing effects of Peak Oil, record debt to GDP coinciding with unprecedented asset bubbles to GDP, hyper-financialization of the economy (net flows to the financial sector absorbing all output), population overshoot, climate change, low labor share, decelerating productivity, extreme wealth and income inequality, decelerating money velocity, and fiscal constraints, the world faces the new normal/neutral of global secular stagnation, which is likely to be further entrained by another global deflationary recession and bear market possibly underway.
Tweaking tax, fiscal, and monetary policies under the foregoing conditions will make little difference. The assumptions and policies that were deemed appropriate during the inflationary and reflationary regimes of the Long Wave will be rendered ineffective or irrelevant during the current debt-deflationary regime. The primary causes of the malaise are demographics, low labor share, too much debt, overvalued assets hoarded by the top 1-10% at zero velocity, and extreme inequality exacerbating the effects on capital formation and productivity (and growth of profits) from low labor share and excessive debt.
Until debt is forgiven sufficiently and labor share/purchasing power increases (by higher wages or lower or no regressive taxation on earned income) for the bottom 80-90%, the secular stagnation will persist and its effects worsen until a crisis that risks the collapse of the mass-consumer economy and of the institutions that depend on growth of the economy per capita.
It’s “different this time”, but apparently most eCONomists don’t know it, don’t know why it’s different and the implications, or they aren’t paid to tell us.
For those interested, please find the first edition of my China Tracker here: http://www.prienga.com/blog/2015/9/27/china-tracker-sept-2015
The evidence suggests that China most likely has been suffering the side-effects of an over-valued yuan since Q3 2014. Such a situation would benefit importers and consumers and hurt exporters and producers. And it has.
For example, gasoline and jet fuel demand in China were both up more than 20% in August year on year–absolutely a blow-out month. Oil demand was up an impressive 6.6%. Similarly, Nike saw fabulous results in China in the three months ended August, with sales there up more than 30%. http://www.bbc.com/news/business-34355627 All of these indicators directly contradict any notion of recession.
On the other hand, the Chinese have resisted devaluing the yuan in line with the won, yen or Euro, and so China’s competitiveness has substantially eroded, and that’s clearly visible in capital flows, exports, and industrial production. In principle, if China devalues, the demand for Nikes and oil should ease off a bit, and exporters should be revitalized.
I would add that China’s private debt-to-GDP ratio is very high, indeed, at levels associated with financial crisis in many other countries historically. However, the proximate issue in China is the exchange rate. We would get a better sense of the state of the underlying economy once that issue is addressed.
Find more in the Tracker.
Steven, China’s consumer spending is ~35% of GDP. Exports 25%. Production ~30% of GDP. Gov’t spending 14% of GDP.
See my reply to Tom above about China’s oil storage/hoarding as a share of imports and consumption.
Wages, consumer spending, and gov’t account for ~5% nominal GDP growth, whereas investment, production (private surveys show YoY contraction while the CCP reports a 6% YoY gain), and exports in aggregate are reducing GDP by ~2.5%. Who knows about inventories and the deflator, but that puts final sales at no faster than 2.5% nominal and private nominal GDP at ~1.3%, and 0.8% per capita. If the deflator is positive, the economy is growing at near 0% in real terms per capita.
Aggregate wages, investment, production, and money supply (~195% of GDP at a 0.51 velocity), and China’s real productivity is no faster than ~1%. Then note that the labor force has been contracting for three years running with the population growing at 0.5%, and China’s potential real GDP is effectively 0%.
Western analysts are much too credulous to the CCP’s made-up economic data when the best private surveys indicate that the Chinese economy is at no faster than stall speed.
The CCP officials are arresting journalists and traders for reporting other than the party line and for shorting the stock market. Needless to say, they don’t want the reality of China’s incipient hard landing to be recognized and acted upon. The CCP officials’ credibility and legitimacy is on the line, and they’re resorting to Stalin- and Mao-like tactics to crush any dissent or mass-social perception that the CCP is losing control of their central planning efforts.
The situation is exacerbated by the US and Japanese pulling FDI and expats and western and Japanese producers pulling out of China en masse.
China’s “miracle” was not an organic process but “made in the USA” (and in part in Japan) over the past 20-30 years. Now that US and Japanese FDI is contracting, so, too, will production and exports, which constitute ~55% of GDP. The Chinese economy will “rebalance” away from production and exports to consumer spending, but not voluntarily; rather, it will occur by default as a result of Peak Oil, declining available net oil exports, demographic drag effects, resource depletion per capita, and with real GDP per capita decelerating to the new-normal rate of global secular stagnation of ~0%.
Through 2013 we have seen a post-2005 decline in what I define as Global Net Exports of oil (GNE, the combined net exports from the Top 33 net exporters in 2005), which is a pattern that appears to have continued in 2014 (complete data not yet available from EIA). GNE fell from 46 MMBPD (million barrels per day) in 2005 to 43 MMBPD in 2013 (total petroleum liquids + other liquids). The volume of GNE available to importers other than China & India fell from 41 MMBPD in 2005 to 34 MMBPD in 2013.
Here are the mathematical facts of life regarding net exports:
Given an ongoing, and inevitable, decline in production in the net oil exporting countries, unless the exporting countries cut their liquids consumption at the same rate as, or at a faster rate than, the rate of decline in production, the resulting rate of decline in net exports will exceed the rate of decline in production and the net export decline rate will accelerate with time.
In addition, given an ongoing, and inevitable, decline in GNE, unless China & India cut their net oil imports at the same rate as, or at a rate faster than, the rate of decline in GNE, the rate of decline in the volume of GNE available to importers other than China & India will exceed the rate of decline in GNE, and the rate of decline in the volume of GNE available to importers other than China & India will accelerate with time.
For example, from 2005 to 2013 the rate of decline in the volume of GNE available to importers other than China & India (2.3%/year) was almost three times the observed rate of decline in GNE from 2005 to 2013 (0.8%/year).
Jeffrey, I suspect that the “Limits to Growth” (LTG) to global real GDP per capita from Peak Oil, falling GNE, population overshoot, etc., will force a decline in demand for oil imports in China and India as trade slumps and real GDP per capita decelerates to 0%.
India imports 100% of oil consumption. China imports 55-60% (?) of oil consumption. World oil supply per capita is no higher than in 2004-05 and where US oil production per capita was in the late 1970s, the onset of deindustrialization and financialization of the US economy. The world is where the US was in the late 1970s, i.e., peak industrialization. India is 40-45 to 80+ years too late to industrialization, and China’s growth has peaked and will decelerate to ~0% real per capita.
http://www.thehillsgroup.org/
http://www.thehillsgroup.org/depletion2_018.htm
https://app.box.com/s/npygb8t139jm69yjcz5nhzm8ygibd5pd
https://app.box.com/s/0hroqkg7zym2us8em4k55a36affs4xmc
The oil/commodities cycle is contracting, implying $20-$30 oil in the years ahead.
https://app.box.com/s/s0wyvm4xh7kvd4fxcwyxx3mfevtf8yub
https://app.box.com/s/8rqnbk0mqgctg7vlt04su71711vumjs9
https://app.box.com/s/6aju2cctaq9wxck2y6xwxdfbqidq95op
https://app.box.com/s/u3icgvx6wbcddnijynhx257dshzm1dyr
That fits with the ongoing decline per capita for US oil production (now at the level of the late 1940s) as the log-linear US oil depletion regime inexorably continues. Despite the fastest 5- and 9-year rates of US oil production since 1927-30, the shale boom/bubble is but a blip for the long-term US oil depletion regime per capita.
At the long-term trend rate of US oil depletion, US oil production per capita will have declined by 50% since 1970 by no later than the early 2020s; however, the 50% threshold could occur sooner were another global deflationary recession to occur, which appears increasingly likely. In fact, as little as a decline in US oil production to 8-8.2Mbd in the next 3-5 years will achieve the 50% decline per capita. I suspect that we will see the 50% per-capita threshold exceeded before 2020.
And we know what the implications are for when the US reaches and sustains 50% oil depletion per capita. The structural effects have already begun to occur with real GDP per capita since 2007-08 averaging barely faster than ~0% for the US, EZ, and Japan, and now for China’s real potential GDP. No amount of QE, ZIRP in perpetuity, and unprecedented asset bubbles can reverse the inexorable US depletion regime and its effects of real GDP per capita.
https://app.box.com/s/jemdqkdd23257oummtpjwl6348wigdlx
https://app.box.com/s/pfdk6c7a9g9n5i0e3s5txnej16q7biav
Neither will wind and solar (renewable energy or RE) make much of a difference during the remaining oil depletion regime’s descent. In fact, growth of wind and solar has likely peaked with the price of oil and will follow the oil cycle into negative growth in the years ahead. In effect, given Peak Oil and LTG, we cannot afford to grow real GDP per capita AND build out RE to necessary scale AND maintain the fossil fuel infrastructure indefinitely hereafter. Something has to give and it will be growth of real GDP per capita and the RE build-out.
As a result, we are likely to experience a last-man-standing contest between the West and China for the world’s remaining vital resources of finite planet Earth.
Minor correction: In 2013, India’s total petroleum liquids production + other liquids production was 25% of total liquids consumption, China’s was 42%.
OK, BC, I have clicked through every chart. So what?
US per capita production of oil has soared; US per capita consumption is growing strongly in the last twelve months. You can see my VMT forecast here. It has been spot on. I correctly called both the turning point and the magnitude of the adjustment.
Now, the issue is how long the shale revolution lasts and whether other technological advances in oil production will emerge. As of today, we are long oil around the globe.
But, to clarify my view, let me quote from my article (“A Eulogy for Shell Alaska”), to be published tomorrow:
“And yet I still believe in Shell’s earlier [peak oil] vision. Shales may prove an endless cornucopia of new oil. But maybe not. The oil and gas division of North Dakota’s Department of Mineral Resources has estimated that Bakken shale oil production would only be 35,000 barrels per day higher at the end of 2017 than it is today, even at Brent oil prices above $95 per barrel. Restarting US shales may take much higher prices and much more time than currently anticipated.
“And the flood might not last. No one expects shale growth to last past 2025, and many see a peak before 2020. Shell, by contrast, would not have begun flowing oil from Alaska until after 2025. Thus, if we look in decadal, rather than quarterly, terms, Shell’s visionaries may ultimately be vindicated. Shales, to the best of our knowledge, will not cover us for more than a few more years. In all likelihood, we will need the oil for which Shell is searching in Alaska.”
US VMT forecast. US VMT is up 4.2% July on July. That is smoking hot progress, and exactly what we would expect in a reversion from a supply-constrained to a demand-constrained world.
http://www.prienga.com/blog/
@Steven: https://research.stlouisfed.org/fred2/graph/fredgraph.png?g=200n
Yes, indeed.
Interesting article on Saudi Arabia:
The collapse of Saudi Arabia is inevitable
http://www.middleeasteye.net/columns/collapse-saudi-arabia-inevitable-1895380679
Here’s a bit I wrote on oil prices and Arab unrest. Interestingly, unrest seems more correlated with high oil prices, rather than low prices.
Keep in mind, the Saudi fiscal model went to hell after 1983, and particularly after the big oil price drop from Feb. 1986–and this at a time when they were pumping only 3 mbpd. And yet the monarchy survived. It’s not entirely clear that low oil prices lead to revolution.
http://www.prienga.com/blog/2014/12/1/arab-unrest-linked-to-oil-price-spikes-not-price-collapses
And by the way (speaking of being quoted), I should be on NPR’s Marketplace again tonight.
An item about growing unrest in the Saudi royal family, as power has been increasingly concentrated in one branch of the 35 surviving lines of the founder’s family:
Saudi Arabian Prince Makes Unprecedented Call for Removal of King in Palace Coup
http://www.haaretz.com/news/middle-east/1.678048
An excerpt from “On Saudi Arabia,” published a few years ago:
Do you ever have a cheery day, BC?
Here are China’s commercial inventories, just for you. They are a solid 19 mb below normal for oil, and 27 mb below for all crude and product inventories taken together.
http://www.prienga.com/blog/2015/9/28/china-excess-inventories
Thanks, Steven, but what’s “normal” WRT inventories going forward? Do your data account for tanker oil storage?
http://www.bloomberg.com/news/articles/2015-09-17/even-a-slowing-china-is-oil-s-best-defense-against-deeper-slump
http://money.cnn.com/2015/06/04/news/economy/china-oil-supertanker-opec/
China’s demand growth is set to slow to an annual rate of 2.3 percent by the fourth quarter compared with 5.6 percent in the second quarter, a reflection of “weak car sales data, declines in industrial activity, plummeting property prices and fragile electricity output,” the IEA said in a report on Sept. 11.
What if “normal” for 2011-14 is well above the trend rate of growth of demand hereafter?
What is the source of your data? Thanks.
Cheers! 😀
BC,
Inventory turns in terms of days of cover are pretty easy to forecast. If you have excess inventory, it’s not that hard to spot.
There’s very little floating storage, to the best of my knowledge. The article referenced above is from June. To the best of my knowledge, there is not a lot of crude in tankers, bar Iran, where it has been for some time. (Some of that may have moved recently. There are reports of large Iranian sales.) I assume Saldanha Bay in South Africa is still filled to the brim, but I don’t know of any reliable statistics. Similarly for Trinidad and Tobago. I can tell you the JODI data is dead wrong, and that’s about it. There are many, many countries for which we lack any kind of decent inventory data. (At some point, I’ll have an excess stocks analysis for the entire globe. But I have Bakken fish to fry today.)
There is some floating diesel in Asia. The demand for gasoline has been so strong that diesel, produced as a by-product in the refining process, is going begging. (Buy a VW TDI!) So we have a pretty impressive diesel overhang; some of that is in tankers in the Singapore area.
China data comes from China Oil, Gas & Petrochemicals (http://en.xinhua08.com/a/20130609/1191086.shtml).
The surge in demand for oil is due to price, not income, elasticity–as I noted on CNBC. The question is how long the short-term price elasticity takes to manifest itself. There are lots and lots of data problems associated with this.
I’ve given you the China data in the Tracker. I’ve provided interpretations, and I have been relatively optimistic. But were I in Jim’s frame of mind, I could give a darker reading, too, and bear in mind, Jim’s a better macroeconomist than I am.
From my perspective, I think it’s imperative that China complete its devaluation. The risk is that over-valuation leads to a debt problem, a loss of confidence, and a self-reinforcing downward cycle. Chinese policy-makers really blew it twice this time around. They should have devalued earlier, and failing that, they should have made the entire re-adjustment in one go. Now they’re trapped. Still, I would go ahead and bite the bullet. If necessary, I would just move to a managed float (that’s one way to cover a policy mistake!), and let the market devalue the yuan on its own. There is a lot a risk tied to an unnecessarily strong currency.
In any event, if China devalued, then we’d know where the Chinese economy really stands. It might not be so bad after all, at least this time around.
As for growth hereafter, here’s a graph for you: UK VMT, which was up 2.7% yoy in Q2.
You can see the recovery of trend, and that’s how GDP will catch up to potential GDP.
Here’s the VMT graph: http://www.prienga.com/blog/2015/9/29/uk-vmt-sept-2015
The Professor wrote:
“I’ve long believed that to understand business cycles we need to consider not just net flows but also gross interdependencies. A downturn in China will affect some businesses much more than others. If specialized labor and capital do not easily move to other sectors, that can end up having significant multiplier effects.
Professor,
Thank you once again for a bit of reason in your analysis. Krugman as the leaders of the far-left Progressive economists leads so many astray with his ultra-aggregate economics.
Excellent article!
“Demand out of China [for Apple iPhone 6s] looks white-hot,” Ives said.
http://news.yahoo.com/apple-reports-record-sales-iphone-6-6s-plus-124914752–finance.html
Doesn’t really scream recession, does it. It sure screams over-valued currency, though.
Steven, how much of China’s GDP is made up of Nike and Apple sales? What is the contribution to the overall rate of growth of GDP with consumer spending at ~35% of GDP?
Hypothetically, Nike and Apple sales might constitute 5% of overall consumer spending growing at 20-30% YoY, which would result in growth of overall GDP of ~0.4%.
The contraction in production and exports (~55% of GDP) results in nearly a wash against the contribution of growth of consumer spending to GDP. That leaves gov’t spending contributing ~1.4% to growth for there to be any reported growth of final sales (who knows what inventories and the deflator are).
The vast majority of economists and analysts have been so wrong about China for so long it’s almost comical at this point. The same economists who have been wrong for years about China are the ones claiming that China is not at risk of a hard landing, but that’s because they believe the falsified data coming from the CCP officials. What they never say is that FDI is contracting; the labor force has contracted three years running with productivity barely 1%; money supply is 193% of GDP at a velocity of 0.5, i.e., plunging in a deflationary manner; China’s money supply is reported at a banana republic-like compounding doubling rate of 4-5 years; US and Japanese firms and expats are exiting en masse; real estate is crashing; auto sales are contracting; millionaire and billionaire Chinese are taking money out by the billions; and the CCP officials are panicking and arresting reporters and short sellers.
Sounds like things are going well in the Middle Kingdom to me! 😀
As for the Yuan being overvalued, no doubt, as I’ve shared repeatedly in the past. However, a devaluation of the Yuan is unlikely to improve exports and/or production, as China’s production and export sectors are much more dependent upon US and Japanese FDI and its large multiplier to production and exports. With US and Japanese FDI contracting, production and exports will continue to contract. That is, 55% of China’s GDP will not be growing for the foreseeable future, and a currency devaluation will matter little apart from a balance of payments accounting reconciliation with growth of global trade flat or contracting.
China will “rebalance”, but not voluntarily or by central planning; it will occur by default as production and exports cease growing and by definition slower consumer spending will make up a larger share of decelerating GDP hereafter.
Cheers! 😀
https://www.youtube.com/watch?v=-Fl7yNIPlGM
https://www.youtube.com/watch?v=YkvEDAg6MWw
https://www.youtube.com/watch?v=hDzutIb6p6I
Steven, as to being cheery, I was trained, conditioned, and tested as a sentinel, a reflection of the electric eye, and to avoid being a victim of changes as a result of the actions of the militarist-imperialist, Anglo-American, rentier-socialist corporate-state.
Stoicism and vigilance.
Semper fidelis and shalom.
But, BC, please, small words. My brain is small and filled with obscure statistics as it is.
@Steven: “But, BC, please, small words. My brain is small and filled with obscure statistics as it is.”
Sarc noted. 🙂
And you are most certainly not a small-brained person confused by statistics, obscure or otherwise. 🙂
Here’s what’s happening with world trade as of July:
https://app.box.com/s/xt8fhcxp62igds328g7q6mzorpytq9pw
https://app.box.com/s/rvlhbckx959xahjysa30zwyallimx0qb
We’re back to when ECRI incorrectly called a (near) recession (or a mid-cycle pause) and the Fed went “all in” in a panic to avoid a recession, and at recession-like rates in 2008 and 2001.
https://app.box.com/s/ztgvh9e0u9skbdctnnrm29h2xpuq3854
https://app.box.com/s/sqpdwrin8dt40t3ri6n0n5ksx88gtoqz
https://research.stlouisfed.org/fred2/graph/fredgraph.png?g=1YKq
https://research.stlouisfed.org/fred2/graph/fredgraph.png?g=1YDi
https://research.stlouisfed.org/fred2/graph/fredgraph.png?g=1YDk
https://research.stlouisfed.org/fred2/graph/fredgraph.png?g=1Hmk
https://research.stlouisfed.org/fred2/graph/fredgraph.png?g=1YMB
https://research.stlouisfed.org/fred2/graph/fredgraph.png?g=1YDk
Now it appears that a stock bear market has begun and the unreal estate market reached another bubble peak in 2013 and is set to contract as in 2006-07, 2001, and 1989-90, setting up another bust with CPI deflation. Stock market capitalization and household net wealth have also turned negative.
https://app.box.com/s/cik3teki4u11tj7erkxqh1t1lw0eayvj
Financial risk is rising with credit spreads widening.
The equity, corporate bond, and unreal estate bust will be global, including China, Canada, Oz, the EZ, Russia, and Brazil, risking a debt-deflationary contraction larger than 2008-11.
https://app.box.com/s/545ufkd4x268h9uj8cuht24acksm30q0
https://app.box.com/s/qec330y98iuh0k1t1443egk28cpbt5uo
US PPI, wages, and peak demographics imply that the cyclical and secular rates of CPI will continue to decelerate.
https://app.box.com/s/0hroqkg7zym2us8em4k55a36affs4xmc
https://app.box.com/s/npygb8t139jm69yjcz5nhzm8ygibd5pd
https://app.box.com/s/zksl1v1a25x4n1x9bsk8cmpx0aqphxvk
https://app.box.com/s/a5j70ohb1j1c75wm6cvcbdgfbrb3n4z8
And the oil/commodities cycle has turned negative as in the early 1960s and 1986, implying the price of oil in the $20s-$30s in the years ahead coinciding with an energy sector bust as large, or larger, than the early to mid-1980s during the Continental Illinois collapse, S&L Crisis, Plaza Accord, etc.
Steven, the energy cost of energy extraction worldwide is now too costly to sustain production per capita given the the decelerating post-2007 trend rate of US, EZ, Japanese, and global GDP per capita at ~0%. We can’t afford to profitably extract marginal lower-quality, costlier sweet crude substitutes (kergen and bitumen) AND grow the 5- and 10-year real GDP per capita. Decelerating global growth will reduce the cyclical and secular change rates of oil demand against higher production costs, resulting in lower prices and no growth of production: Peak Oil and LTG.
During the 1980s, we were in a Long Wave disinflationary/reflationary regime following the Long Wave peak with much lower debt to wages and GDP, the constant-US$ price of oil at $15-$20/bbl, and real GDP per capita at twice today’s rate. Now we are in a debt-deflationary regime of the Long Wave, which implies a liquidity trap, risk aversion, liquidity preference, little or no growth of real GDP per capita, and price deflation. Further central bank reserve expansion will only reduce velocity further and reinforce the conditions of the deflationary regime, which has been the pattern in Japan since the late 1990s and was the case during the 1930s.
I’m absolutely certain that none of the foregoing is too obscure for your not-so-small brain. 🙂
Cheers! 😀
I’m trying to see if I can follow the thread here:
*Open question: how will China setback affect US.
*China has little imports from the US. [Implied is that overall effect on the US would be moderate.]
*But they import a lot of mined metal commodities from the World.
*So US mining and metal refining entities will be affected.
Then there is some discussion of specialized labor and capital (I assume that JH means specialized equipment–money is VERY not specialized–unless he means entities or something) possibly not transferring well to other tasks and a multiplier effect, danger to financial institutions, and then not knowing what will happen worrying him.
Yes, it is true that capital spent on mining is “wasted” to the extent that it was allocated based on an incorrect assumption of future prices. For an extreme example think about all the specialized labor and websites and servers and warehouses and such put into dotcoms like petfood.com and the like from 96-2000. And nothing transfers perfectly and in such cases there is waste. If I sink a shaft for a deep coal mine and the price drops so much that I don’t justify digging at the coal face seam, then that shaft is just a waste. (Maybe a little option value, but let’s not get pretty.) BUT it’s also possible there are cases of underinvestment when high prices surprise people. And you can’t always predict what is going to happen. But I think these are endemic aspects and concerns related to the free market, irrespective of China situation. I think some real reflection here is warranted.
As far as the concern, I think one should also think of the counter possibilities. For example, if mining was overinvested in, isn’t it better that this gets stopped sooner (limit MORE waste of capital)? Also the benefits to competing purchasers of metals in having cheaper factors of production. If we have a recession now, we did get to enjoy some earlier non-recession. In a perfect world, there would be no cycles of over/under investment, but how do you get there? The history of planned economies shows they are more wasteful than unplanned ones and that they destroy incentives for production in general. Perhaps some churn and uncertainty is a normal frictional issue in a free market.
Or, here’s an interesting question: JH wonders about multiplier effects: IOW, poor US minining and metal refining getting hurt impacts more than them, hurts rest of the country. Well is there ever an inverse multiplier? Let’s say where labor and equipment IS re-assigned easily. Could the impact ever be less than 1 times nominal impact? Or how about the impact of cheap steel and the like for building petrochem plants?
I think there’s also an interesting issue in the ‘not knowing what is going to happen worries me’. I think if we really unbake that it shows some interesting things. Maybe this is the macro versus micro thing.
Yes, in a perfect world, you would know the growth in demand of all commodities: perfect market forecasts, and not just volumes but actual future indifference curves! And in that perfect world, you would know exactly the cost curve of current production. And all future developments in mining and refining technologies (e.g. “minimills”). Oh…and future government restrictions from environmental laws, political instability, etc. I.e. future possible cost curves. Now, we can buy Freedonia market reports. Or even hire some fancy schmancy consulting company to put a team of MBAs on it for a while to study it. But there is STILL huge uncertainty. That’s just the world. And companies still invest given those uncertainties. The world goes on. The world lives, exists and functions in this environment of uncertainty.
I mean I look at something like the price of oil. And it is freely traded (consider Brent, if you want to be technical). The price is the price. And then there’s a futures strip. That price is the price. Could be wrong. Probably will be…after all CLZ9 has been all over the map. But still the price is the price (and you can hedge, albeit with some costs). But from a CAPM perspective you can even ignore that and consider that individual investors and the market overall can hedge (portfolio theory, Sharpe Nobel prize blabla) and just be the best investment you can be on a project beta basis. But even just simply looking at options pricing and the implied 95% high and low price curves, you can see that there are huge uncertainties in future price. But that doesn’t actually bother me. I just accept it. and knowing that. Knowing that…by just pricing put and call options.
I read this somewhat differently.
I think it’s time for the Chinese to step up. They have to provide better–principally, more credible–economic statistics. When times are good, investors and economists will forgive a certain flexibility in reported statistics. In downturns, however, investors will tend to discount all the news and price in worst case scenarios. A lack of timely, accurate and credible statistics exacerbates uncertainty. And you can’t create that over-night.
China is too big and too important to be careless. Notwithstanding an unfolding downturn there, China needs to be confident and certain that events will favor them in the long run. China’s a great nation. It has to increasingly think like one.
Steven, the “great nation’s” economic “miracle” was “made in the USA” (and in part Japan) since the early to mid-1990s (NAFTA, WTO, offshoring, labor arbitrage, etc.). With US and Japanese FDI contracting, 55% of China’s economy can’t grow, leaving consumer and gov’t spending to create any net growth.
But China’s debt and money supply to GDP has resulted in a broad money velocity of 0.5 (Japan is at 0.4). Just to keep the aggregate of nominal consumer and gov’t spending at the current 4.5-5% rate (~3.5-4% ex gov’t), money supply has to grow 9-10%, i.e., a compounding doubling time of ~7 years.
With money supply, wages, and gov’t spending growing 9-10% and production and exports contracting, real productivity is not growing, and is even contracting along with the labor force for three years running. By definition, at best case for the economy’s real potential GDP is ~0%, and that’s including a 1% contribution from gov’t spending.
To grow the economy, China either needs productivity to accelerate dramatically to an unheard-of 9-10% or faster or for deflation to occur at a similar rate!!! 😀 IOW, a 1930s-like debt-deflationary collapse over the next 3-5 years is the only way that China can reset the system to thereafter grow at potential real GDP per capita of ~0% from 2008-14. 😀
Under the foregoing conditions, there is no way that China’s workers’ wages can continue to grow ~9-10%, or even faster than 4-5%, and permit growth of profits and investment hereafter. If wages were to decelerate to the 4-5% rate with gov’t spending at 10%, that would reduce trend nominal GDP to ~2.5-3% nominal, and 2-2.5% per capita.
This is precisely what the decelerating rate of electricity consumption below 2% YoY and oil demand at around 2% YoY for 2015 is implying for China’s nominal GDP.
Eventually eCONomists and TBTE bank and broker analysts will come around to this emerging reality, but someone at the top has to give it his blessing and pay someone to concede the trend and take credit for getting it right (after being wrong for years). 🙂
https://research.stlouisfed.org/fred2/graph/fredgraph.png?g=200Z
https://research.stlouisfed.org/fred2/graph/fredgraph.png?g=2013
Don’t worry, be happy james.
Yes, over-valued currency it is.
The Chinese have cut the sales tax on small autos by half, that is, by 5% of the selling price.
I wish I found this comforting. It reinforces in me Jim’s worries.
They really need to devalue the yuan and find out where they are.
@Steven, an oil-, auto-, and debt-based economic model in China is a kind of dystopian ecological nightmare of unprecedented proportions. Have you been to China since, say, 2007-10? Pollution, water shortages, desertification, loss of arable land, surreal traffic jams, and rising imports of energy and food make it a virtual certainty that China’s growth boom is over and they will be lucky to grow at all in real terms per capita.
China remains a four-letter word: SELL.
I think there is a lot of evidence that the plunge in oil prices was from supply growth and/or previous over belief in future depletion (peak oil, even the lite versions).
If price drops, at the simplest level we can look for growth in supply or shrink in demand. Volume is our clue here. Higher volume indicates supply growth. Lower volume indicates demand contraction.
Now of course, both things can happen at the same time, contributing or fighting each other. In addition, markets have some future expectations of both supply and demand, both of which may change. But all that said…volume is a big clue. In 2008, we had a big run up in price and people like Matt Simmons talking about peak oil and the like. Then we had a genuine recession, volume drop, and a crash of price (not just the spot, but futures expectations too).
So. I took the IEA statistics for quarterly production and just looked at YOY growth. Assuming there is some seasonality, this would seem to be the things to compare. Here is the result:
QTR Glprod(MMbpd) YOY delta
Q1 2011 88.4 1.4
Q2 2011 87.6 -0.4
Q3 2011 88.6 0.0
Q4 2011 89.5 0.7
Q1 2012 90. 4 2.1
Q2 2012 90.3 2.7
Q3 2012 90.2 1.6
Q4 2012 90.7 1.2
Q1 2013 89.9 -0.6
Q2 2013 91.0 0.7
Q3 2013 91.6 1.3
Q4 2013 91.7 1.0
Q1 2014 92.0 2.1
Q2 2014 92.6 1.6
Q3 2014 93.7 2.2
Q4 2014 95.1 3.4
Q1 2015 94.6 2.6
Q2 2015 96.0 3.4
What does this show? First, we clearly aren’t in anything like the 2008-2009 recession when price dropped to the thirties amidst an actual demand driven volume contraction (pre intervention). Second, growth has been stronger more recently.
———
*Shale was under appreciated (by the market overall and even more so by this blog author).
*Peak oil, depletion, scarcity premium was over emphasized by the market, even more so by this blog author.
Little bit more analysis of the above, just from graphing in Excel and the trend line function:
Graphs shows the supply story (sorry, don’t know how to embed pictures).
Overall period:
1. Sixteen of the eighteen quarters show YOY volume increases. Only two show decreases.
2. The average YOY growth was 1.5 MM bpd.
3. The slope is increasing (accelerating growth during the period), with an extra 0.5 MM bpd/year every year. Rsq =0.38, 18 data points.
4. Just eyeballing and describing the curve [which is rate of growth, not production!] (sorry if this is not mathematical):
a. seems to go down from 1Q11 to 2Q11, to an actual negative growth.
b. then accelerates with a monotonic increase to 2Q12 at a high of 2.7 MM bpd growth
c. then drops monotonically down to 1Q13 for an actual negative growth value.
d. from there rises to 2Q15 value of 3.4 MM bpd YOY growth (not monotonic increase over this period, but close to it, see rsq below).
For 4 a-d, it would be interesting to look at what happened with major events (e.g. Libya or OPEC gulf state decisions). Gotta be wary of over-reading into things (for one thing, the reason for a big delta may be more related to the previous value than the present one). But still…might be a story here.
Recent period 1Q13 to 2Q15: This is an ADMITTED cherrypick! (Just going off the period of 4d and looking at it, for the heck of it. It is playing with endpoint picking, but has some value in being “close” to the price crash.)
a. Average growth was 1.8 MM bpd
b. slope of growth (acceleration of growth) is an extra 1.5 MM bpd/year per year. Rsq of 0.86, 10 data points.
—————
net, net: seems like there is a story of increasing supply behind the price crash. Even to the extent that demand is a part of the story, it is probably more around a revision of expectation of super high demand to reasonable demand (China growth moderation). In any case, it seems challenging to justify the peak oil scarcity premium, in that event. More like the ‘hard to keep up with India China growth’ premium. But nothing like a strong peak oil turning or Hotelling impact. [E.g. consider a thought experiment of what would have happened to price had demand been such that volume of production remained static over the last few years.]
Nony –
If you haven’t looked at the China Tracker yet, you should.
There is no doubt that supply surged as oil prices crashed. But as Jim has noted: “[O]ne can’t help but be struck by the fact that the weekly changes in oil prices correlate with dramatic moves in other commodity and financial markets.” (https://econbrowser.com/archives/2015/09/common-factors-in-commodity-and-asset-markets). In Jim’s related oil price model (now re-christened the ‘ICE’ — interest rates, copper, exchange rates — model), 60% of the collapse in prices is attributed to demand weakness, and the only major weak economy right now is China. (See p1 of the Tracker.)
The problem with Jim’s model is that supply and demand effects are occurring at the same time and in similar magnitudes. If we assume these are uncorrelated events, then China must be collapsing literally within weeks of the supply-driven collapse in oil prices. How likely is that, really? It’s not.
However, there is a related event, notably that China does not devalue the yuan with the collapse of oil prices and the resultant surge in the value of the dollar. Thus, shales caused all three of a) the supply-driven collapse in oil prices, b) surge of the US dollar, and c) the weakness of China’s export and manufacturing center, as well as associated capital outflows. China’s weakness is caused principally by two policy mistakes. First, China failed to devalue the yuan in line with the Euro, yen or won. And second, once it devalued, it only devalued a little and then chickened out with the rest.
in this interpretation, it is imperative for China to devalue the yuan to its proper level. If people believe the Chinese economy is faltering due to internal, business cycle (read, excess credit) reasons, that itself could prompt a recession. A correctable policy mistake could prompt a broader recession.
Thus, while I agree entirely with your analysis about surging oil production, Jim’s ICE model makes a pretty convincing case, I think, for demand weakness as well (but note, not volume-demand weakness, but price-demand weakness; ie, China is willing to take much larger volumes of oil–up an astounding 13% by JODI measures–but only at a much lower price).
So, China has (uncharacteristically) really blown the call on exchange rates–understandably so–but it still got the call way wrong. As I have stated before, were I Chinese policy makers, I would say we are sorry (we misjudged the source of pressure on our currency); or I would declare victory and take this opportunity to go to a floating exchange (‘the yuan will be the reserve currency of the world, and today we take a great step forward by initiating a managed float’); or tough it out and hope that exchange rates move back into your direction. This last hope is not entirely misplaced, but a subject for another time.
SK, see comment below (meant it to be here).
In addition to the comments, I would be wary of emphasizing Jim’s model: I think his model only tries to get the price correct, not price AND volume. But the P-Q curve has both. Supply curves and demand curves have both. And for that matter the whole issue of depletion and for example the state production curves, was showing an interest in volume. But just from the basic insights from micro econ 101, it is good to think about P AND Q.
Yes, I agree. But we do know both P and Q, for all the countries involved. In a normal recession, both the price and quantity of oil demanded declines. But that hasn’t happened anywhere (or more specifically, it is limited to some of the non-OPEC commodity suppliers, eg Brazil and Canada–they’re not big enough to move the needle.) So if you’re arguing, as Jim does wit the ICE model, that price weakness reflects demand weakness, then it has to come from China. And we do see that weakness in the Chinese data, per the Tracker. So the ICE model is correctly indicating demand weakness–it’s there in the data.
The problem is that you have to reconcile soaring oil demand in China with ‘weak’ China demand overall. Not easy to do. It implies some fabulous contortion of China’s oil demand curve, just as you suggest.
However, you can rationalize away weakness in the China if you attribute it to an over-valued yuan. In that case, China’s economy really isn’t that weak, maybe not weak at all. Rather, it’s struggling with an over-valued currency, which is making manufacturing and exports weak–and thereby creating the impression of a weak economy–even as imported oil demand stays strong. All that makes sense, and I think is the best interpretation of the data.
If so, then China needs to devalue the yuan. That simple. They do that, and the Chinese economy bounces right back.
1. I just look at the global result. Sure some countries may go up/down in volume, but the overall volume is up. That’s just not consistent with reduced demand causing the price drop. You have a fungible product. Global supply and demand are what matter. And you need to look at Q as well as P. Not just P.
2. Has volume of oil consumed by China actually decreased? I don’t think so.
————–
I guess you can make some argument that future demand was predicted higher and that the price was relying on it. But it’s still not consistent with a scarcity premium, peak oil, mindset then. And it becomes a little semantic, but perhaps a more reasonable interpretation is that the 100+ prices were a mirage based on unreasonable world demand growth (I don’t buy it still…we haven’t had a global recession and instead had US LTO kick ass and OPEC crumble as a cartel. But at least you can think of it that way, if you want to argue demand.)
China has overtaken the US as the top destination for foreign direct investment (FDI), for the first time since 2003.
Last year, foreign firms invested $128bn (£84,8bn) in China, and $86bn in the US, according to the United Nations Conference of Trade and Development.
http://www.bbc.com/news/business-31052566
I’m not sure that list means what you think it does. For example, Hong Kong is #2 for FDI on that list. That would represent about 150x the per capita investment made in China.
I think the size of FDI into China indicates that the foreign investors on the ground are not as negative about China’s economy in the future as many seem to think.
Ben –
I think a lot of that was hot money heading into the Shanghai and Hong Kong stock exchanges, and it’s 2014 data, so I suspect 2015 is going to look much worse.
But to your point, I think the Chinese need to lift their game–doing more of what the Chinese are already doing well. Part of that involves relaxing (or as Aaron Rogers would put it, R-E-L-A-X). More specifically, it involves having some self-confidence that doing good will also be doing well.
I am (or was) scheduled to present on oil markets in Tianjin at the end of this month. While I’m there, I’d be pleased to also present on some of the transition challenges facing a post-socialist economy, along the lines of my experience in Hungary (ie, what it means to ‘relax’ in technical terms). So I’ll see if I can arrange something along those lines.
Meanwhile, I’ll be presenting on Oct. 15th at Princeton University on the oil markets outlook, for those who may be interested.
Q is up and P is down. The simple first order single factor explanation is that the S curve moved to the right. If D curve moving left were the cause of P down, then Q should have gone down along with P. (As happened in 2008-9 recession.)
If you think that P came down from both D moving left and S moving right, you do realize it means you have to posit an even MORE substantial supply curve shift to explain the volume increase? It means S moved even MORE. IOW, it’s even a greater slap in the face of those who emphasized peak oil scarcity premium, or whatever label you use. (e.g. your state charts, your Columbia talk, the 2012 ASPO conference, etc.) And it means even more importance to attach to US LTO, which was treated extremely dismissively by those who wanted to emphasize depletion worries.
P.s. I think oligopoly is a big part of the story here, but again…this was something I pointed out that should be thought about more (last summer), not dismissed with a lit survey. [A free competitor debottlenecks and increases production at high price, not the converse. Yet, we see SA pumping 1 MM bpd more than a year ago when price is $50 lower. That shows previous high prices were partially the result of OPEC influence.]
I was surprised by the ability of shale oil to continue to increase production at an increasing rate, yes. I am on the record as saying that many times. However, I took my cues from PIRA and WoodMac, ie, I was following their forecasts. If I had my own forecasts for shale, they might have been better. But maybe not. Technological innovation is very, very difficult forecast with such tools as we have.
Moreover, keep in mind, we’re only one year into a surplus. We are still in the short term, and not either the medium or long term. Can shale production continue to increase by 1 mbpd, year after year? For a few years, probably yes. For five years? Ten years? Maybe not. To wit: The North Dakota Dept of Mineral Resources estimates that there is a 50% probability that there are at least 60,000 drilling locations (potential producing wells) in the Williston Basin. They put 90% confidence at 25,000 wells. Of these, 12,000 are in service already, and increasing by 2,000 per year (which holds production around current levels).
https://www.dmr.nd.gov/oilgas/presentations/NDOGCPC091015.pdf
If the P90 turns out to be right, we have another 5-6 years of Bakken wells. If the P50 number is right, then Bakken production could increase by another 800 kbpd and hold that level through 2040. But even if that is true, the Bakken would only cover another eight months of global demand growth.
As for the Saudis, part of the increase seems related to their new Yanbu Refinery, a 400 kbpd monster which came on line in April and produces primarily diesel (of which there is now a glut). It appears the Saudis increased crude production to fill up the refinery, ie, they maintained earlier crude exports (actually lifted them if I recall correctly), and also threw in additional product exports. So some of the Saudi run up appears driven by the inauguration of the Yanbu refinery earlier this year.
So, shales have made impressive gains, and I expect these to continue for the next couple of years. However, it is far from clear that peak oil has bee solved in any permanent sense. China is still near the bottom of the S-curve of consumption. We not yet even close to global steady state consumption, best I can tell.
1. There is no such thing as a shortage. There is a supply curve and a demand curve and price and volume. Bill Gates thinks there’s a shortage of computer scientists to work for him. Your average 50 year old out of work programmer thinks there’s a shortage of decent jobs. Those are just words. P-Q rules. Especially for commodities like oil.
2. Every indication was that we would continue the growth and even the acceleration of US LTO had prices remained $100+ (for example if OPEC had made this happen.) Look at the various specialty report predictions from summer 2014. Or just look at how much production went up even as rigs count was declining and DUCs being made (IOW, how strong the lag was).
3. I would use the P50 for a thought experiment. Probably right to use ND rather than USGS. Even USGS sees 10GB resource and that’s a pretty old study. 20 is more reasonable based on estimates by consultancies and the like. (at $100 prices. $45 is a whole nother kettle of fish.) I feel pretty good about the well numbers. CAn see the pilot trials for downspacing. The geography is pretty well explored. Lots of companies talked about 10 year inventory at current drill rates in year ago SEC filings. It’s really not that flamboyant. Not relying on magic from EOR or new completion improvements (those would be upside).
3.5. I think the Permian is the really serious resource in terms of thinking about ultimate resource. (at $100). It’s so thick.
4. You’re SA remarks just show they were not free competitors, not pumping all out, if they had spare capacity. Why weren’t they selling that to the market earlier? So what if they sent it to a refinery later? Why short the market before?
5. Futures strip shows Brent at $62.50 in DEC2022 (seven years from now). That’s $52.5 in 2015 dollars, assuming annual 2.5% inflation. Market seems pretty darned sanguine about all that demand growth, even moderate demand growth, from China. Market seems to have:
(a) bought into US LTO as a scalable, responsive marginal barrel. With some staying power. Not an Austin Chalk blip. Not just a neat story for the cornucopians, but something with impact on world price.
(b) believes OPEC destabilized as a functioning cartel. (note for this to mean anything, it also means that the $100 was at least partially a result of OPEC, specifically SA, exerting market power.
(c) cast aside the 2004-2008 peak oil hype. I’m not even talking the “sandals” but the people like this guy (http://www.theoildrum.com/story/2006/11/2/204936/516).
“1. There is no such thing as a shortage. There is a supply curve and a demand curve and price and volume. Bill Gates thinks there’s a shortage of computer scientists to work for him. Your average 50 year old out of work programmer thinks there’s a shortage of decent jobs. Those are just words. P-Q rules. Especially for commodities like oil.”
In a P&Q sense, this is of course correct. But if the oil supply is constrained, the growth will be limited to productivity gains. If those are infinitely flexible (or more precisely, at least as flexible as the proximate binding constraint), the output will suffer. And it did. To my mind, that has the feeling of a shortage. Is there are shortage of water in California? If the market clears, then theoretically, no. But you still won’t be able to water your lawn.
“2. Every indication was that we would continue the growth and even the acceleration of US LTO had prices remained $100+ (for example if OPEC had made this happen.) Look at the various specialty report predictions from summer 2014. Or just look at how much production went up even as rigs count was declining and DUCs being made (IOW, how strong the lag was).”
The relevant forecasts for LTO are for those before mid-year. Neither PIRA nor WoodMac foresaw developments six months out, as I recall. It’s an interesting question about DUCs, by the way. What ever happened to the notion of half-cycle costs?
“3. I would use the P50 for a thought experiment. Probably right to use ND rather than USGS. Even USGS sees 10GB resource and that’s a pretty old study. 20 is more reasonable based on estimates by consultancies and the like. (at $100 prices. $45 is a whole nother kettle of fish.) I feel pretty good about the well numbers. CAn see the pilot trials for downspacing. The geography is pretty well explored. Lots of companies talked about 10 year inventory at current drill rates in year ago SEC filings. It’s really not that flamboyant. Not relying on magic from EOR or new completion improvements (those would be upside). ”
Nobody uses USGS seriously, to the best of my knowledge. The ND DMR is in the thick of it. There more to it than that. Maybe I’ll publish on this later this week.
“3.5. I think the Permian is the really serious resource in terms of thinking about ultimate resource. (at $100). It’s so thick. ”
That’s what Goldman Sachs thinks, and the Permian has held up comparatively well. Still, the Permian shed 6 horizontal and 2 vertical oil rigs last week, per BH.
“4. You’re SA remarks just show they were not free competitors, not pumping all out, if they had spare capacity. Why weren’t they selling that to the market earlier? So what if they sent it to a refinery later? Why short the market before?”
To appearances, Saudi Arabia is still able to increase production. The Yanbu quantities were simply a function of having a big refinery coming on line. The remainder of the increase was allegedly for ‘market share’. I don’t know any consulting theory which suggests you should flood the market with cheap product when prices are low, but there you have it.
“5. Futures strip shows Brent at $62.50 in DEC2022 (seven years from now). That’s $52.5 in 2015 dollars, assuming annual 2.5% inflation. Market seems pretty darned sanguine about all that demand growth, even moderate demand growth, from China.”
The market has always had much lower expectations for China’s demand growth than I have.
“Market seems to have: (a) bought into US LTO as a scalable, responsive marginal barrel. With some staying power. Not an Austin Chalk blip. Not just a neat story for the cornucopians, but something with impact on world price.”
I would argue that markets don’t really have a sense of what marginal cost is right now, so they are thinking from the spot market forward, not the futures market backward.
“The market (b) believes OPEC destabilized as a functioning cartel. (note for this to mean anything, it also means that the $100 was at least partially a result of OPEC, specifically SA, exerting market power.”
I never know what this means. Isn’t Saudi Arabia exercising market power by dumping crude and product on the market? I think I have an article on this somewhere on Platts Barrel.
“Markets have (c) cast aside the 2004-2008 peak oil hype. I’m not even talking the “sandals” but the people like this guy (http://www.theoildrum.com/story/2006/11/2/204936/516).”
The question is whether supply is able to grow faster than demand. Right now, it can.
If those are not infinitely flexible (or more precisely, at least as flexible as the proximate binding constraint), then output will suffer.
Argh, in English:
So, shales have made impressive gains, and I expect these to continue for the next couple of years. However, it is far from clear that peak oil has been solved in any permanent sense. China is still near the bottom of the S-curve of oil consumption. We are not yet even close to global steady state consumption, best I can tell.
SK comments, renumbering:
1. “But if the oil supply is constrained, the growth will be limited to productivity gains. If those are infinitely flexible (or more precisely, at least as flexible as the proximate binding constraint), the output will suffer. And it did. To my mind, that has the feeling of a shortage. Is there are shortage of water in California? If the market clears, then theoretically, no. But you still won’t be able to water your lawn.”
a. I don’t know what you mean. You are not being clear and you are also not phrasing your comments in terms of traditional micro economics. I’m not being petty, I just hear some fancy terminology and don’t know the meaning. Either I don’t know all the buzzwords, or you are not being logical (probably some of each).
b. It doesn’t matter what “feels like a shortage”. Gates feels a shortage of programmers. The programmers feel a shortage of jobs. The reason you can’t water your Cali lawn is government intervention. If they just let price float, you could compete with other users and water it if you could pay for it.
2. “It’s an interesting question about DUCs, by the way. What ever happened to the notion of half-cycle costs?”
I don’t understand the DUCs either and I think it has been a different story at different points of the year (differing contangos during 2015) and even different for different companies. Plus you really can’t trust stories in the press since they argue different points, need to actually look at the numbers. And then you have companies like EOG finally giving in and saying they will complete their DUCs first (to the extent of very little new drilling) in late 15 and 16. It’s not even a pure contango issue as there was also the issue of waiting for prices to drop in the services market. Basically, I should have never raised the DUCs since they don’t back my points and I (and everyone else) doesn’t understand them.
I agree with you that it certainly would seem to make sense (in sunk cost economics) to complete the drilled wells and NOT drill new ones only to NOT complete them. But then, could be things as simple as the drilling contracts were already paid for (so a sunk cost) and the completion contracts were not. You do hear people talk about this on some of the earnings call questions, discussing when contracted rigs will come off and basically allow more contraction.
3. “The market has always had much lower expectations for China’s demand growth than I have.”
I think the market believes in reversion to the mean. 10% growth rates can only go on for so long.
4. “I would argue that markets don’t really have a sense of what marginal cost is right now”
The markets don’t “know”. No one does. It’s a new phenomenon. But they have adjusted their Bayesian expectations (how they “bet”) to consider LTO more seriously than they did before. I don’t think they were ever as negative (or skeptical, I don’t care the label) as people like David Hughes, Art Berman, yourself, or James Hamilton. Consider the people running around saying that US LTO wasn’t worth developing at $100!
But the markets last summer had some skepticism/reservations/expectations also and now they are adjusted. And that doesn’t mean it’s gone altogether. Just reduced. And of course it is still possible to change. Just that it has been changing in the direction of thinking LTO has more runway (both in extent and in low cost) than previously.
Of interest, you might consider the parallel case of US NG market and how shale has affected it. It’s not a one for one comparison (some differences in geology, market, amounts, but still very interesting analogy because of the similar technology of extraction.
Consider the natural gas DEC16 contract (HHZ6). [I think that is far enough out that current weather has no impact.] 5 years ago, it was valued at $6.50. It has pretty steadily gone down from there to current value of $3.00. That is an incredible revision of expected future supply and demand balance!
http://www.marketwatch.com/investing/future/HHZ6/charts?symb=HHZ6&countrycode=US&time=20&startdate=1%2F4%2F1999&enddate=10%2F2%2F2015&freq=1&compidx=none&compind=none&comptemptext=Enter+Symbol%28s%29&comp=none&uf=7168&ma=1&maval=50&lf=1&lf2=4&lf3=0&type=2&size=2&style=1013
Market has clearly decided that price will be a lot lower than it expected earlier (and that is happening even in an environment of increasing volume as well as a political climate that allows some export and punishes coal…IOW prospects for continued growth.) In other words the technology, or our skill at using it (same thing from a business standpoint) has improved markedly over last few years. And the market tries to predict where things will go. and shale gas was already “hyped” in OCT2010. It hasn’t been “news” in the last 5 years that they have this thing called fracking to get gas out of shale.
But pretty clearly, current market has decided that it was too skeptical OR that “the frackers just got better and better” (and even this was an issue of expectation/skepticism, because the concept of improvement of new businesses is not a new idea to the world and had been written about). Not only was the market wrong, but people like Art Berman (ASPO leader, geologist, big peak oil speaker) were even more wrong—he said shale gas would need $10 and would run out of sweet spots!
5. “so they are thinking from the spot market forward, not the futures market backward.”
I don’t know what this means (just in communication of the idea), but regardless suspect a logical flaw. The markets for any future contract (e.g. CLZ9, HHZ6, etc. etc.) are making a bet on future supply and demand. People can freely take either side of the contract and the price moves in response. If anything, I think the spot price is more influenced by the futures price, when in contango, because of the potential for storage, than the future affected by spot. (The converse is not as true. You can’t negative store stuff if a producer goes down or the like.) If you are looking out only a few months, than sure recent disruptions can affect the futures price. But going out over a year, than effects of weather or temporary disruptions will be minimized and you will just have the markets bet on quasiequilibrium (which includes some amount of weather, wars, etc.)
6. “I never know what this means. Isn’t Saudi Arabia exercising market power by dumping crude and product on the market? I think I have an article on this somewhere on Platts Barrel.”
The market power was before, when they shorted the market. Currently, they are not “dumping”. There is no such thing as “dumping”. SA are just price takers. Pre-crash was more in direction of market power. Now, less.
7. The question is whether supply is able to grow faster than demand. Right now, it can.
The futures strip is in contango going out all the way. The market is predicting that the intersection of P and Q will rise. That means the market thinks the demand curve will move to the right FASTER than the supply curve will move right. Just at a fundamentally different place from where we were last summer (and what they predicted for the strip last summer).