U.S. gasoline prices averaged $3.31 a gallon over December 2013 to February 2014 but only $2.31 a gallon over December 2014 to February 2015. How did consumers respond to this windfall in their spending power? A new study by the JP Morgan Chase Institute has come up with some interesting answers.
Rather than trying to draw conclusions from imperfect aggregate or survey data, the Chase study is based on the anonymized credit or debit card transactions of 25 million individuals over these two periods of high versus low gasoline prices. They found huge differences across individuals in terms of how important gasoline is for their budget. A typical household was spending $101 a month on gasoline back when gas prices were high. For the highest-spending quintile, that number was $359/month, whereas for the lowest quintile it was only $2/month. And spending on gasoline is a much bigger fraction of the budget for lower income households.
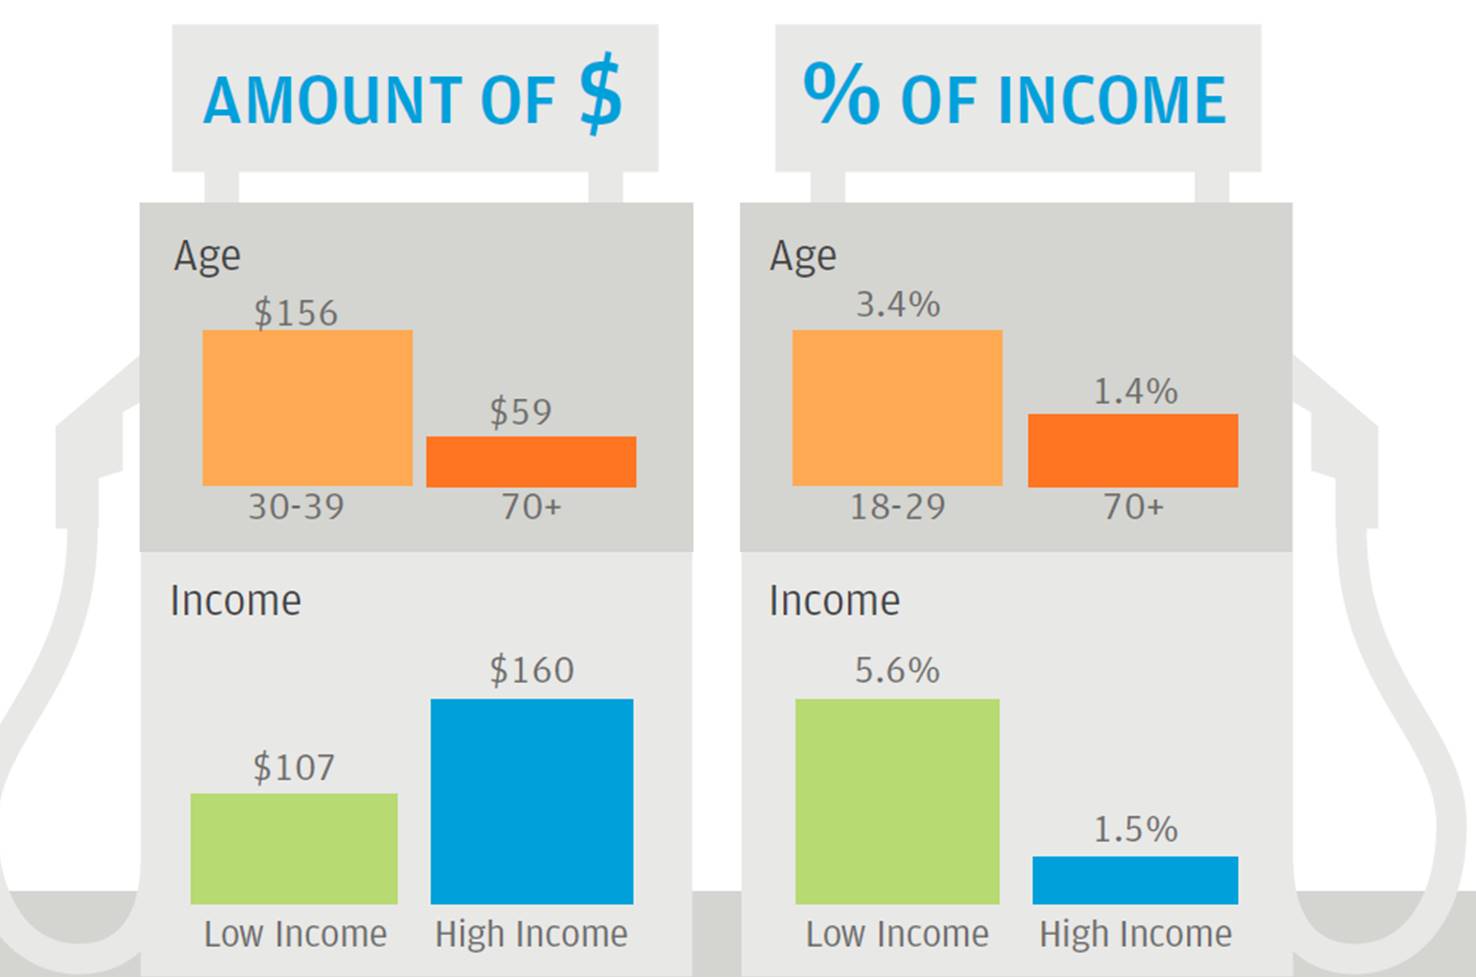
Spending on gasoline by different income quintiles and age groups (total dollars and as a percent of percent of income). Source: JP Morgan Chase Institute.
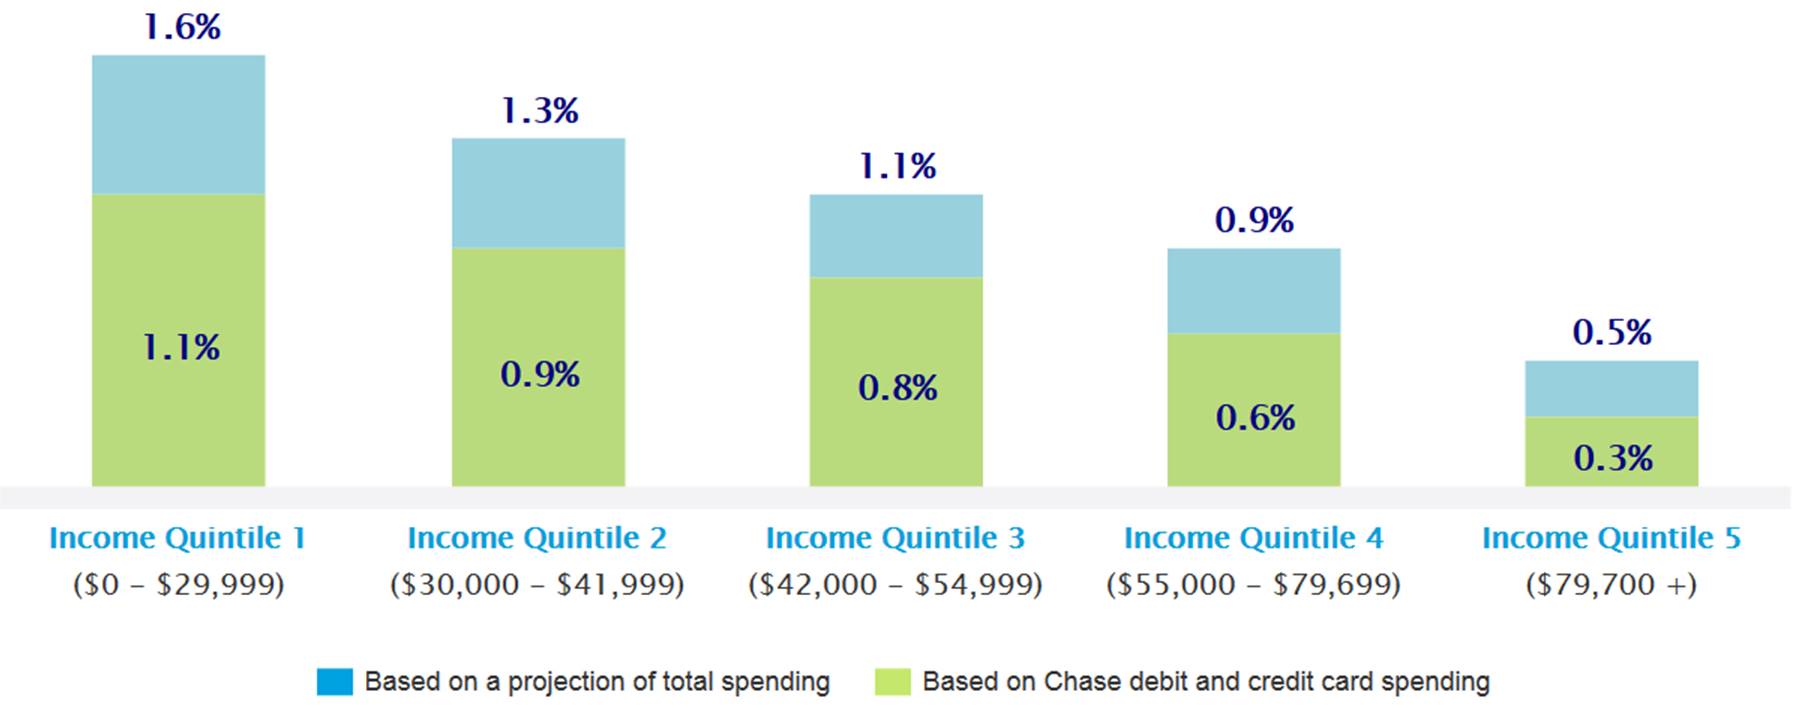
Increase in purchasing power from gasoline saving for different income groups. Source: JP Morgan Chase Institute.
I and others have tried to infer the effects of lower gasoline prices on consumer spending by looking at aggregate consumption spending. But using their detailed data set the Chase researchers were able to come up with a more satisfying answer. The basic idea is to compare how much spending on other items changed between the high gas price and low gas price periods for those who had been spending a large amount on gasoline with those who had been spending a low amount on gasoline. Economists refer to this as inference based on difference in differences. The Chase researchers found 73 cents in extra spending on other items for every dollar saved at the gasoline pump. Restaurants and groceries were the two biggest areas where spending was observed to increase.
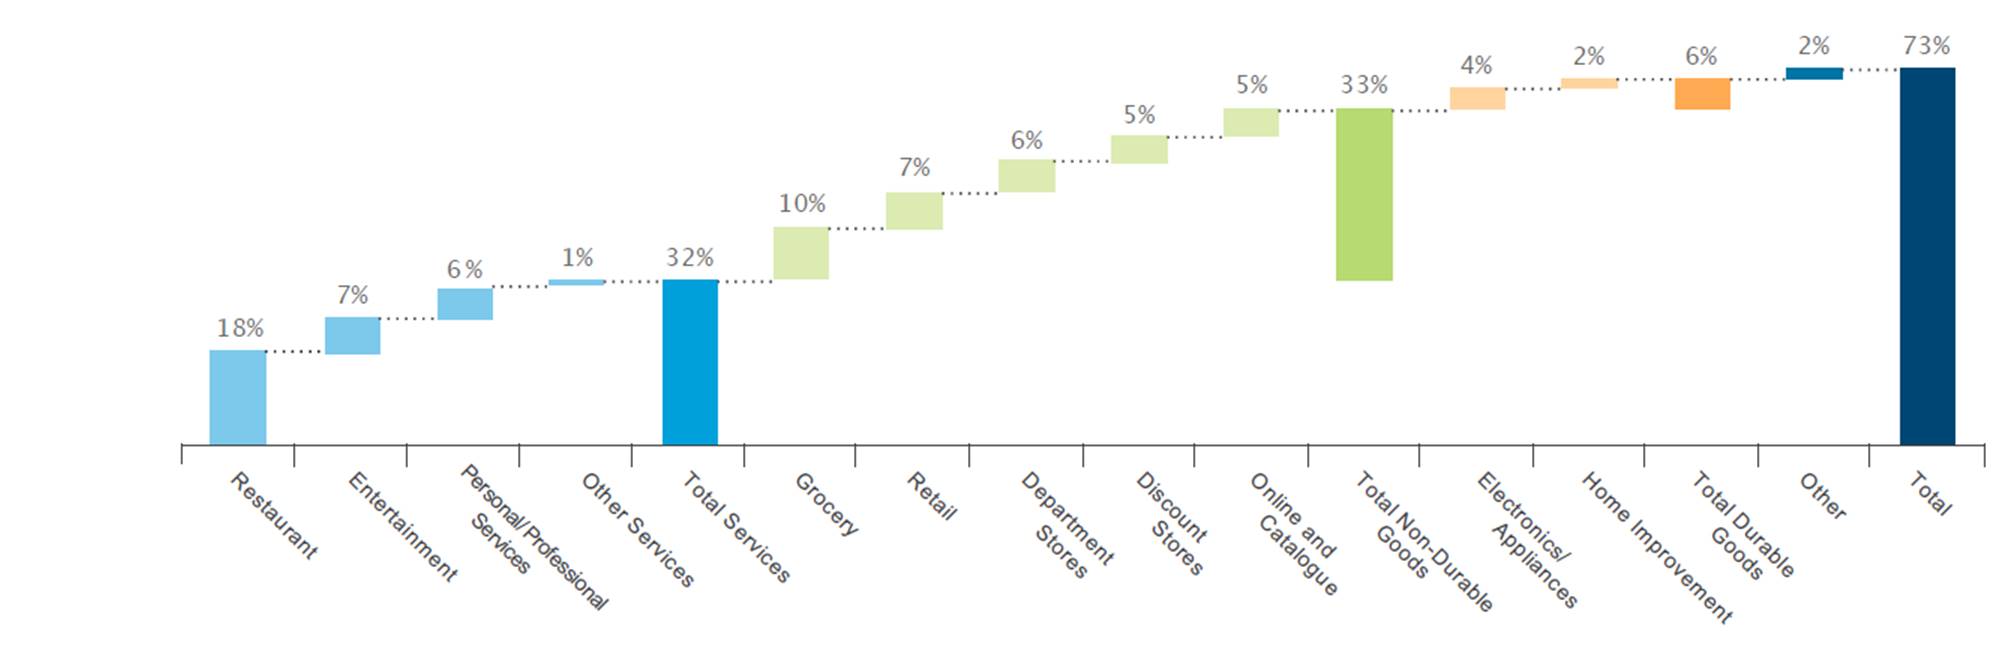
Percent of gasoline saving spent on other categories. Source: JP Morgan Chase Institute.
One limitation of the data set is that most car purchases are not done with credit cards. We know from the aggregate data that increased car purchases are a big component of the consumer response to lower gasoline prices. Thus the total extra spending is likely to be significantly higher than the 73% measured directly.
The evidence thus is that consumers were indeed responding to the most recent price declines the same way they usually did, namely, by spending most of the windfall. The fact that we don’t see this as clearly in the aggregate data suggests that the economy has been facing other headwinds that partly offset the stimulus from lower gasoline prices.
Another consumer response to lower gasoline prices is increased consumption of gasoline itself, though these adjustments take more time to develop. U.S. vehicle miles traveled, which had been stagnant while gas prices were high, have since resumed their historical growth.
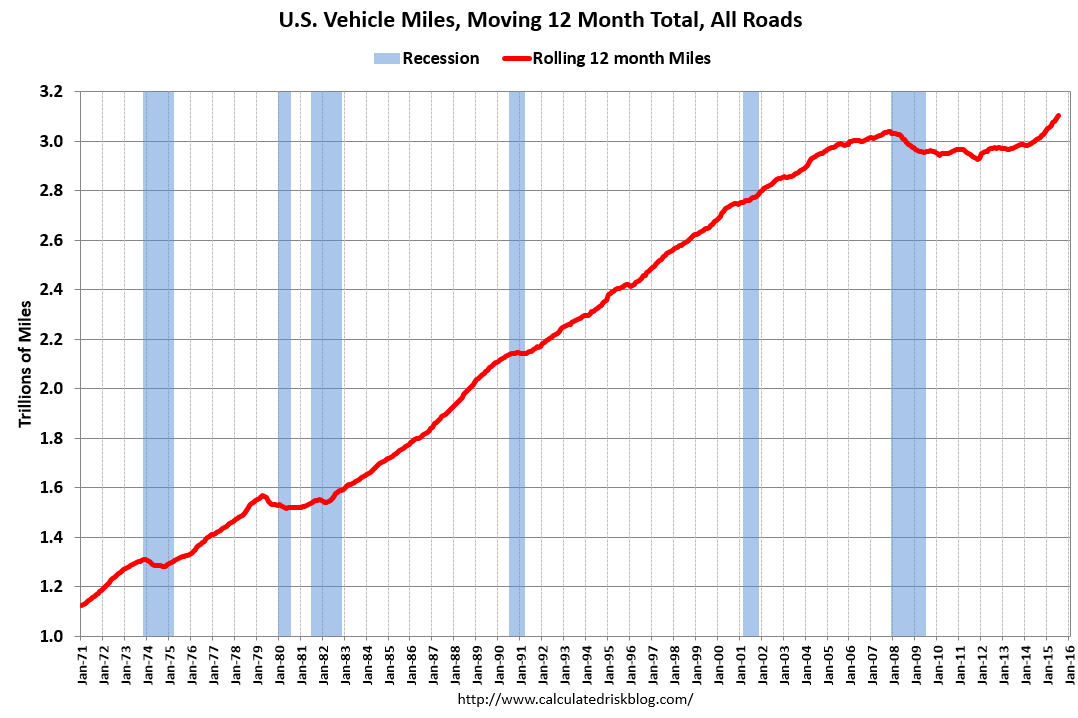
Source: Calculated Risk.
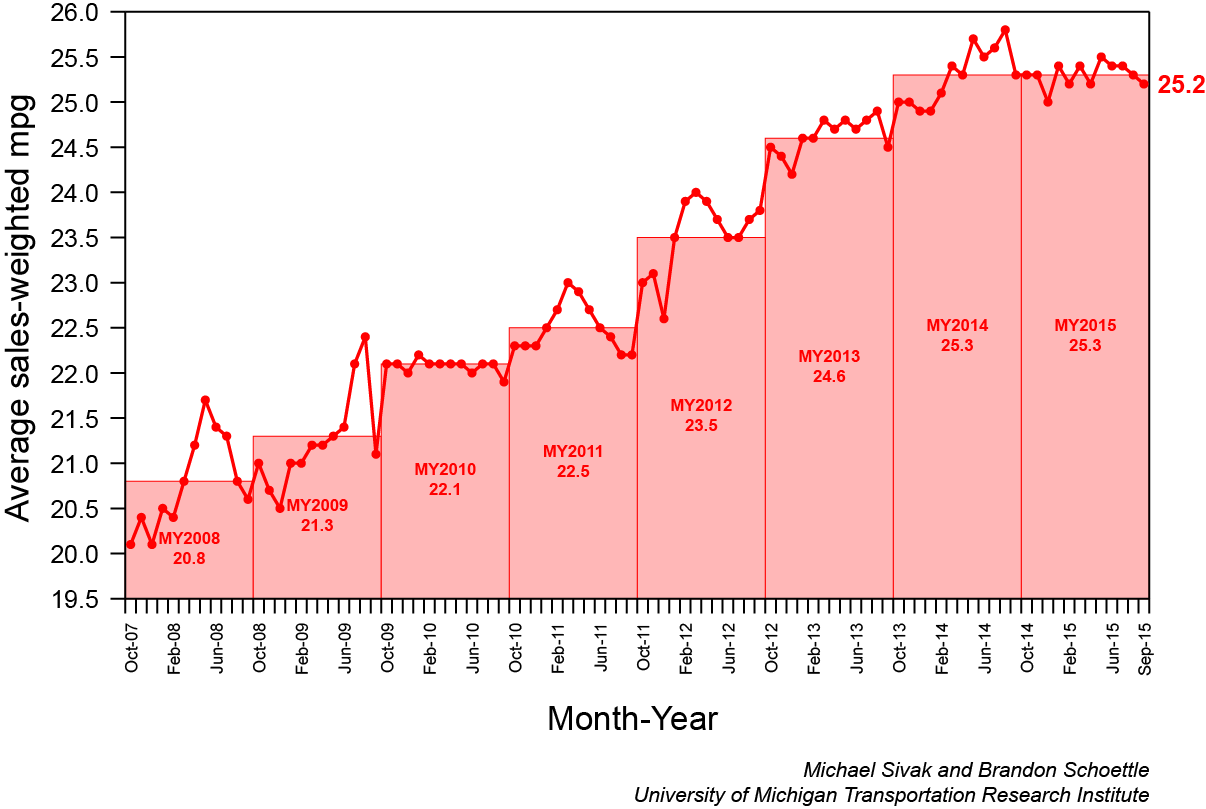
And the average fuel efficiency of new vehicles sold in the United States, which had been improving steadily through most of 2014, has fallen with oil prices.
So, now, if you look at the VMT numbers, you can see Fernald’s drop in productivity growth after 2005, you can see the Recession, and as a practical matter, you can see the secular stagnation as well. If you like, you could superimpose the potential GDP numbers right on top of the VMT numbers (I’ll do this for my next CNBC piece, assuming they publish it). You will also notice that the growth in VMT is accelerating and returning to ‘potential VMT’. I would bet that we’ll see GDP also close on potential GDP in the process.
It seems, consumers would’ve responded similarly to a tax cut when gasoline prices were high without the loss of oil production and its multiplier effects.
In other words, both consumer and producer surplus would’ve been greater with a tax cut, because of higher disposable, and aggregate, income when gasoline prices were high.
It seems you (James) have become a little more cautious since upgrading your overall indicator to a smiley last year. I on the other hand have been seeing the positives in this year’s US data that a year ago I still wasn’t seeing. We’ve got a sustained run of growth around 2.7-2.8%, which I think is nothing to complain about for an advanced country with less than 0.5% working-age population growth. We’ve had a clear acceleration of household consumption to around 3.3%, from less than 2% in 2013, not all of which is going to more imports. Sure the China/EM troubles are an issue, I think the drop in oil prices has accomplished about what you’d expect. Doubts that it would boost US consumption, growth and real imports have been defeated.
https://research.stlouisfed.org/fred2/graph/fredgraph.png?g=200n
Steven, take a look at VMT per capita, which is/are at the level of 2000. Air passenger miles per capita has/have almost returned to the highs of 2007-08.
https://research.stlouisfed.org/fred2/graph/fredgraph.png?g=216N
https://research.stlouisfed.org/fred2/graph/fredgraph.png?g=26gd
Also, the decline in the price of energy and gasoline as a share of final sales and PCE is being overwhelmed by the acceleration in the cost of health care (TWICE the rate of final sales/GDP) as a share of final sales and PCE, absorbing well more than the net benefit from the decline in the price of oil and gasoline.
https://research.stlouisfed.org/fred2/graph/fredgraph.png?g=26gf
The sum of the growth of oil, gasoline, and health care spending as a share of final sales is cumulatively recessionary.
https://research.stlouisfed.org/fred2/graph/fredgraph.png?g=26gi
https://research.stlouisfed.org/fred2/graph/fredgraph.png?g=26gj
https://research.stlouisfed.org/fred2/graph/fredgraph.png?g=26gk
https://app.box.com/s/ys8ijadj4b57nb95ka0b3ilph38ga7fm
The price of oil is still TOO HIGH vs. the capacity of the economy to grow real final sales per capita; and, in this context, “money” (and its velocity and acceleration) is relatively “tight” (and markedly decelerating at a recession-like rate), which will constrain business and household demand hereafter rather more than most eCONomists perceive as likely.
Thus, don’t be surprised if many months hence the NBER backdates a 2008-like recession (and coincident bear market for equities and corporate bonds) having begun in late 2014 or early 2015.
Yes, I concede, it’s not good business PR to say so, nor is it likely to be a position to ensure one’s job security as an analyst or business or academic eCONomist; but the data speak for themselves.
The airline business in peace time grows typically in excess of GDP growth. If we’re back to 2007 levels of flying per capita, then we’re what, maybe 25% where we ought to be. And we should make all that up in the next three years or so. Plus organic growth. So we’re talking airline passenger growth of a third over the next three or four years? You think you don’t like flying Southwest now? Just wait a bit.
You need to be careful looking at nominal spending on non-energy goods.
The CPI for commodities less food and energy has been falling for the last three years — the year-over-year change in now minus -2.5%.
Similarly for retail sales. as the deflator is now down -2.4% from a year ago. Moreover, it is widespread as the deflator for GAFO sales — department store type goods -is now at minus -2.5% and has been negative since 2012.
So consumers could be spending more on many consumer goods even though the nominal data will still show declines.
I guess we fit into the high income group. I don’t pay much attention to gas prices. I pay more attention to how easy it is to get into and out of the gas station. Back when diesel was pushing $5/gal I was thinking how high it would go before the it would affect our use of the truck and horse trailer rig. I was thinking $10/gal would get my attention. Then I was thinking of replacing the old Rav4 with a new Highlander. MMMMM? $50K!!! At that point I decided we would drive the Rav till the wheels fall off. I wonder what folks are thinking of when they are encouraged to buy new when the gas price falls. Weird!!!
PS
The truck is 15 years old and not broken in yet. The 25 year old truck is just getting broken in.
Impressive. All this access to individual income numbers (not household income numbers).
I was curious about the data source and even more curious about some of the assumptions that drove the data sample creation. Pasted from page 26:
1. They have a checking account and at least 5 outflow transactions from their checking account per month.
2. They do not hold a gas station specific card.
3. They live in a zip code with at least 140 other individuals in our sample.
The authors of the study do not motivate these choices other than to say they allow the researchers to “focus on core Chase Clients.” Frankly, the restrictions strike me as excessive but then I probably do not understand them.
The implicit lingering concern is that sample generation is part of sophisticated data mining operation…..
@Spencer:
https://research.stlouisfed.org/fred2/graph/fredgraph.png?g=275s
https://research.stlouisfed.org/fred2/graph/fredgraph.png?g=26gi
https://research.stlouisfed.org/fred2/graph/fredgraph.png?g=275D
https://research.stlouisfed.org/fred2/graph/fredgraph.png?g=275U
https://research.stlouisfed.org/fred2/graph/fredgraph.png?g=275X
http://www.investing.com/economic-calendar/redbook-911
BC look at this: http://www.bea.gov/iTable/iTable.cfm?reqid=12&step=1&acrdn=1#reqid=12&step=3&isuri=1&1203=2011
Right now the year over year change in the retail deflator is -2.5% as compared to the CPI that is 0.2%.
Retail sales prices are essentially all goods while the CPI and the other measures you cite are over 50% services and normally services prices rise more than goods prices. Currently the CPI for goods excluding energy is up 0.2% while services less energy is up 2.6% from a year-ago. One big reason for the differences is that the CPI contains housing while retail sales do not include housing.
I don’t know while you are referring to these measures when THE BEA series is clearly the correct measure to use when you evaluate consumer spending.
Tel me, why should I deflate retail sales by the measures you cite when there is clearly a better measure available.
I see you refer to the PCE deflator, but the BEA constructs the retail deflators as part of its work to construct the PCE deflator.
But the bottom line is that the retail deflator is running some 2% lower than the measures you cite so consequently you are significantly understating real growth.
I have no idea why FRED publish a series of retail sales deflated by the CPI. I have complained bitterly ever since I discovered it.
@Spencer:
https://research.stlouisfed.org/fred2/graph/fredgraph.png?g=26gf
https://research.stlouisfed.org/fred2/graph/fredgraph.png?g=27sX
https://research.stlouisfed.org/fred2/graph/fredgraph.png?g=2705
https://research.stlouisfed.org/fred2/graph/fredgraph.png?g=27tc
https://app.box.com/s/aluz60bqd033jlx5bhjvnf171ewmdvo8
https://app.box.com/s/2fr2jxsib2gr4hmahws3jqrprp3qs0s3
BC these are all interesting data series.
But what do they have to do with the warning I raised that because we are seeing actual deflation in the price of goods that looking at the point that nominal spending has not jumped because of lower oil prices may be misleading. That consumers may be having a larger response to lower oil prices that is masked by falling prices in the retail arena?
Spencer, the accelerating cost of health care (growing at more than twice the rate of final sales and at 18-19% of GDP) and rent (for ~35% of households) is more than offsetting the decline in the price of gasoline and the pass-through deflationary effects on retail prices for after-tax consumer income/spending, especially for the working-class bottom 80-90% living paycheck-to-paycheck subsistence with no discretionary income.
This phenomenon is manifesting in contracting revenues and profits YoY and weak wage growth (at a record low for labor share of GDP) and a plunge in M2 velocity for private final sales and a deep, recession-like contraction in M2 acceleration.
A similar phenomenon is occurring in the Euro Area (EA), as ECB QE is primarily resulting in increasing liquidity and lending for the financial sector, which in turn is encouraging funding of gov’ts, with EA gov’t spending at ~50% of GDP. As in the case for the US and Japan, QE is having little effect on non-financial private lending in the EA. As of earlier this year, M2 less reserves/bank liquidity has markedly decelerated to ~2% with M2 velocity for private GDP at ~0.7, implying nominal GDP of no faster than 1.4% hereafter and a further deceleration in private non-financial lending.
The point in stressing this is that the emerging deflationary regime is occurring coincident with a plunge in velocity and a contraction in the acceleration that previously occurred in 2008, 2001, and the early 1980s.
And this is occurring with 70-75% of world real GDP per capita having decelerated below “stall speed” as long as a year ago, which coincided with the onset of the crash for oil and other commodities.
The world is in a recession, but the secular trend rate of real GDP per capita has decelerated below 1%, which is within the margin of error of the estimates of the deflator, inventories, and import prices.
Thus, the global economy is highly susceptible to any number of shocks, including the failure of a financial institution, stock bear market, HFT fat finger, derivatives blowout, weather, energy, natural disasters, or geopolitics. Virtually none of the existing eCONometric models is sensitive enough to detect a regime change, if you will, in the business cycle progression.
https://research.stlouisfed.org/fred2/graph/fredgraph.png?g=28GP
I have not seen anyone discuss demographics. Lower income consumers are often younger while higher income consumers are older (see first chart above). Younger consumers would generally consume more gasoline because they would drive more often. Older consumers would be more inclined to reduce their travel by auto and so reduce gasoline consumption while other uses such as air, train, and boat would be more common with older consumers.
Richard Thaler, in his recent book Misbehaving, cites a study that when gas prices fall, people buy more premium gas (e.g. http://www.businessinsider.com/us-consumers-spend-more-on-gas-2015-9 ). Any thoughts on how relevant that is here? Would the Chase study even catch that?
https://research.stlouisfed.org/fred2/graph/fredgraph.png?g=295y
They go out and buy more because the gas is at a lower price. What they should do is consume normal amounts and invest the extra cash they have while they can now. Markets are low and volatile, the Fed rate has not pushed everything back to normal as of yet. This is the best time to have extra cash right now. The people don’t get it though, but one day with the gel of Don Heavy they will.