Despite the depth of the last recession, private nonfarm payroll employment is now higher than the corresponding point in the last recovery.
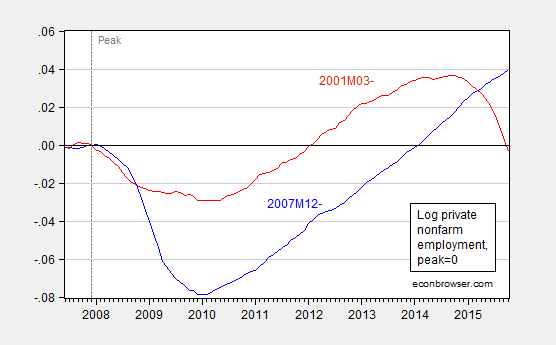
Figure 1: Log private nonfarm payroll employment normalized for NBER peak at 2007M12 (blue), and for NBER peak at 2001M03 (red). Source: BLS via FRED, NBER, and author’s calculations.
Update, 11/7: Reader rtd was confused by the horizontal axis labels in Figure 1, and wants a graph with dates normalized to peak. Here it is. However, I still plot using the same left scale.
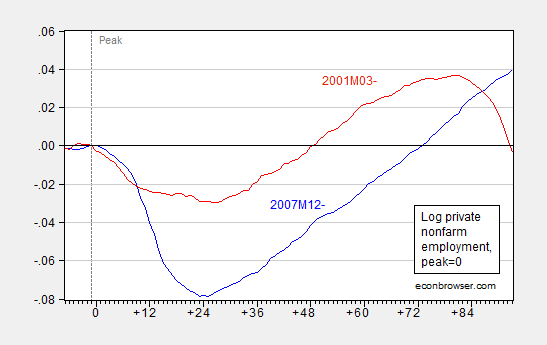
Figure 2: Log private nonfarm payroll employment normalized for NBER peak at 2007M12 (blue), and for NBER peak at 2001M03 (red). Source: BLS via FRED, NBER, and author’s calculations.
Can i suggest you change the x-axis? If you’re providing two data sets with each belonging to differing time series, I feel having the x-axis as a continuous time series with no breaks (to actually represent the data) adds unneeded confusion. Maybe just have # of months from peak?
Also, I’m confused by the comment “Despite the depth of the last recession, private nonfarm payroll employment is now higher than the corresponding point in the last recovery.” It’s confusing because the data seem to indicate that your concept of “the corresponding point in the last recovery” is actually a point from the most recent recession per NBER’s Recession Dating Committee. Seems strange to overlap these time series and simultaneously consider datapoints part of a recovery when they are part of a downturn. What am I missing?
Three Fed officials – Lockhart, Bullard, and Mester – said 70,000 to 125,000 jobs per month are needed to “outpace population growth – to keep the jobless rate steady” – which is less than the prior rate of 125,000 to 150,000 a month, e.g. because of Baby-Boomers retiring.
If one-third of the output gap has been destroyed in this “recovery,” then we’re roughly 5 million jobs short of full employment. There’s still massive idle labor, along with enormous “locked” potential in the economy.
We are already nearing full employment. 5 million turns into far less when you count demographics. Bad post.
Keep dreaming – demographics are already included.
If you want to show how we’re near full employment, I’ll show you how you’re wrong.
My latest over at CNBC: China and oil
http://www.cnbc.com/2015/11/06/wheres-oil-headed-ask-china-commentary.html
There is something disconcerting about the labor market in this recovery.
Too much of the official Fed commentary on the declining participation rate focuses on the impact of aging demographics (which is mathematically correct, in part), whilst ignoring the notable impact of the collapse in participation by the cohort of prime workers aged 25-54 years of age.
http://tinyurl.com/q45ya83
http://tinyurl.com/qxf4c6q
It appears as if the FOMC is going ahead with raising the Fed Funds rate by 25 bps in December – if they’re doing it because of the labor market tightness, they’ll be making a serious mistake.
Considering every company I work with is having supply issues right now with labor, your not getting it. The Boomers are going, going, going and by 2020, totally gone. The Echo’s are getting trashed at a party right now. We are inbetween and only Generation X left to work. Getting it now?
Payrolls per capita: https://research.stlouisfed.org/fred2/graph/fredgraph.png?g=2rMB
Employment per capita: https://research.stlouisfed.org/fred2/graph/fredgraph.png?g=2rME
Full-time employment per capita: https://research.stlouisfed.org/fred2/graph/fredgraph.png?g=2rMF
Full-time, private employment per capita: https://research.stlouisfed.org/fred2/graph/fredgraph.png?g=2rMT
Same but for age 25 to 54: https://research.stlouisfed.org/fred2/graph/fredgraph.png?g=2rMX
Per capita employment ex health care: https://research.stlouisfed.org/fred2/graph/fredgraph.png?g=2rN1
Ex education: https://research.stlouisfed.org/fred2/graph/fredgraph.png?g=2rN4
Ex health care and education: https://research.stlouisfed.org/fred2/graph/fredgraph.png?g=2rN5
Ex food services and drinking places: https://research.stlouisfed.org/fred2/graph/fredgraph.png?g=2rNc
Ex health care, education, and food services and drinking places: https://research.stlouisfed.org/fred2/graph/fredgraph.png?g=2rNf
Same and ex gov’t: https://research.stlouisfed.org/fred2/graph/fredgraph.png?g=2rNp
Total: https://research.stlouisfed.org/fred2/graph/fredgraph.png?g=2rNu
Change rate (0.54%): https://research.stlouisfed.org/fred2/graph/fredgraph.png?g=2rNG
The low- or no-productivity sectors of the economy (gov’t, private health care and education, and restaurants and bars) have grown per capita while the rest of the private sector has not.
http://www.pewinternet.org/2014/08/06/future-of-jobs/
http://www.technologyreview.com/view/519241/report-suggests-nearly-half-of-us-jobs-are-vulnerable-to-computerization/
http://www.technologyreview.com/featuredstory/515926/how-technology-is-destroying-jobs/
The former sectors are now a net cost to the private sector and are the most vulnerable to once-in-history disruptions from accelerating technological advances (Big Data analytics, AI, robotics, bioinformatics, biometrics, nano-electronic sensors, IoT, the cloud, etc.) and the elimination of tens of millions of middle- to upper-income service sector jobs without net replacement of paid employment and purchasing power over the next 5-10 to 20 years.
http://www.bls.gov/emp/ep_table_104.htm
~80% of the fastest-growing jobs earn an average of $27,000/year and require little or no post-secondary training/credential. Americans lament the state of our “educational” system, but clearly it is working in the sense that 80% or more of workers do not require much “education” or “skills” given the evolving nature of the labor market.
Rapidly accelerating technological advances are resulting in increasing deskilling of a growing majority share of the labor force and no longer resulting in a net increase in employment, especially not breadwinner employment.
These recoveries have become so long that I think the raw number of jobs is less meaningful to compare than in previous cycles. We should probably adjust for working age population.
Except in Wisconsin, of course.
http://www.fcedc.com/sft386/09deccombined.pdf
The Rage: “Considering every company I work with is having supply issues right now with labor, your not getting it.”
Get creative. Try something you’ve never tried before — like raising wages.
There are plenty of workers out there, over a 150 million in fact. Unfortunately for you, they are happily working for your competitors because your company is such a crummy place to work. Workers vote with their feet. If you can’t find even one person in 150 million to switch for you, you must run a truly horrible business.
Sorry, but the pool of workers is shrinking to population. I am on the ground floor. You don’t know a thing and proved it.
To Rage’s point about surplus labor, see my post above and the following:
http://www.telegraph.co.uk/finance/economics/11978542/Robots-may-shatter-the-global-economic-order-within-a-decade.html
It’s going to get infinitely worse for the bottom 90%+, and eventually the bottom 95-99%, in the next 10-20 years.
The US economy no longer creates net new full-time, private, breadwinner employment per capita. 80-90% of households are living paycheck to paycheck, if they’re lucky, with no prospects of accumulating capital wealth for business creation, retirement savings, etc.
Were I a Millennial, I would “go Galt” or “boycott” the mass-consumer economy to the extent practically possible and do just as most are doing today, including living with parents or extended family rent free, forgoing auto ownership, coupling, household formations, and child rearing, and walk away from the hierarchically imposed, top-down “winner-take-all” values, self-identity, and objectives.
If 80%+ of jobs hereafter will be low-paying, dead-end, part-time service jobs paying an average of $13,000-$27,000/year, what’s the point of trying to afford an apartment, cost of an auto, and financial commitment to a spouse/partner and children?
Why should Millennials buy in to the “American Dream” when it’s an illusion that anyone can discern while even partially awake?
BTW, Rage, alleged labor shortages are characteristic of late-cycle conditions. Whenever one hears about persistent labor shortages in one or more sectors, it’s an indication of the economy nearing, or having achieved, the business and household effective demand constraint.
By the many metrics I follow, we hit that constraint by early to mid-2014. Payroll receipts and reported wages and salaries imply that growth of employment is currently overstated by as much as 1% or more, whereas late-cycle labor hoarding and frantic management of workers’ hours (especially part-time workers) to avoid ACA mandates is exacerbating the late-cycle effects.
Not coincidentally, BEA profits after tax and S&P 500 revenues and earnings are contracting YoY, with the cyclical trend rate of revenues decelerating to ~2-3%.
Moreover, non-residential investment to GDP is contracting again. Along with the foregoing, revenues and profits are at the late-cycle phase, or even recessionary, implying no impetus for growth of investment, production, employment, and wages hereafter.
The Rage was talking about a tightening labor market or moving towards a labor shortage.
Robots free-up labor to expand the economy and if capital spending, or investment, is allocated efficiently, living standards improve.
Moreover, better jobs are created, because workers are needed to create, build, ship, install, improve, maintain, operate, and manage those machines.
Currently, in the U.S., there’s an overabundance of capital and an education boom.
There are too many overeducated Americans working at low-skilled jobs and too much capital kept in unproductive assets.
Joseph, about raising wages, as you probably know, labor share is at a record low going back to the Great Depression (and data implying the 1890s-1900s), which, along with extreme inequality, is reducing the trend of productivity, which in turn reduces GDP growth per capita with the labor force barely growing, if at all.
But as I point out above, accelerating technological advances in AI, robotics, etc., will result in further deskilling of a growing majority share of the labor force in the next 5-10 to 20 years, capping wage gains, reducing hours worked, and further constraining growth of investment, consumption, and GDP per capita.
The vast majority of eCONomists are not acknowledging and discussing these emerging global structural constraints because they don’t get paid to do it and breaking from the academy’s herd is often a career-ending move.
Therefore, we should not expect to be informed by eCONomists or anticipate much in the way of innovative policies to address the worsening structural effects.
Moreover, “the market” as it is constituted will continue to do what it does best, i.e., respond to price and tax signals and incentives to concentrate income, wealth, and political power to the top 0.001-1% owners at the increasing marginalization of the rest of the population.
In other words, the current anemic recovery is not quite as bad as the worst recession since the Great Depression.
Thanks for that.