The St. Louis Fed has a handy webpage where it shows the Taylor-rule implied Fed funds target rate given measures of the output and inflation gaps, and the natural real rate of interest. Here’s recent snapshot I downloaded for my classes.
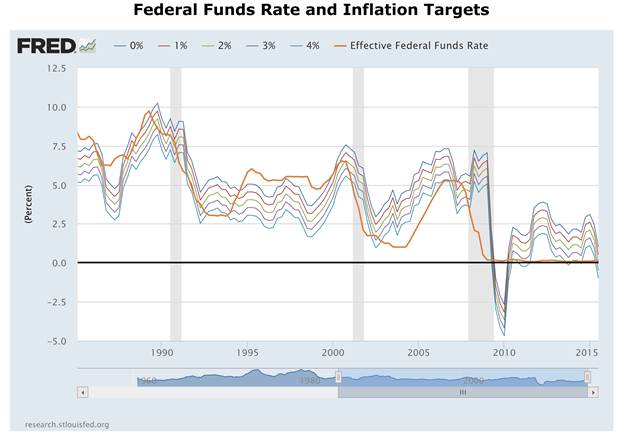
Source: Federal Reserve Bank of St. Louis accessed 11/4/2015.
The description of the calculations are very transparently presented:
Given a 2% PCE inflation target, the Fed funds rate as of 2015Q2 was just at the implied level.
The careful reader will observe that there are many “Taylor rules”, even from Professor Taylor himself. Besides debates over the proper measures of y, y*, and π (including present or future), and the values of the parameters, there is a crucial debate regarding r*, the real natural rate of interest. For expositional purposes, the St. Louis Fed website uses the 2.5% figure, which — if I were teaching in 2007 — would seem relatively defensible. But for policy purposes, a more nuanced position would seem reasonable. This is where the whole debate over the real natural rate, and more specifically the recent Laubach-Williams estimates, come into play. Figure 2 displays the Laubach-Williams estimates as well as the default 2.5% rate used in the above figure.
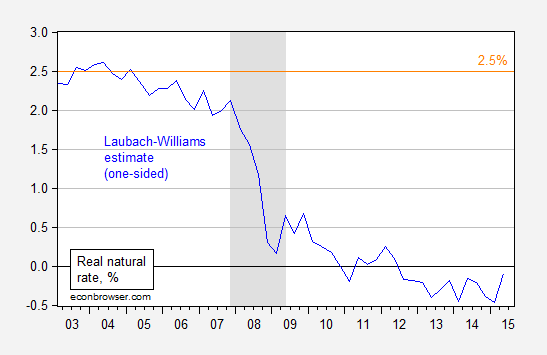
Figure 1: Laubach-Williams real natural rate (blue), and 2.5% (orange). NBER defined recession dates shaded gray. Source: Federal Reserve and CBO via FRED, Laubach-Williams [xls], and NBER.
Substituting in these estimates for r* yields a substantially different picture.
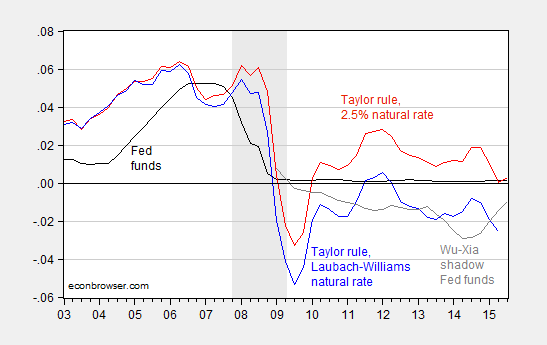
Figure 2: Fed funds rate (black), Taylor rule using 2.5% real natural rate of interest (red), Taylor rule using Laubach-Williams real natural rate (blue), and Wu-Xia Shadow Fed funds rate (dark gray). NBER defined recession dates shaded gray. Source: Federal Reserve and CBO via FRED, Laubach-Williams [xls], Wu and Xia, NBER, and author’s calculations.
Since the Laubach-Williams estimates for the natural rate only extend up to 2015Q2, the implied target only goes up to that date. Nonetheless, the fact that the implied target is about 2.6 percentage points lower than the corresponding value derived using the standard 2.5% equilibrium rate suggests that now is not the time to raise the Fed funds rate; see for instance President Williams’ statement.
Note that if the shadow Fed funds rate equals the actual when the Fed funds rate exceeds zero, then an increase of the target by 25 bps implies that the jump in the shadow rate will be on the order of three-quarters of a percentage point (the end-October shadow rate is -0.53%).
Update, 11/12: For the sake of completeness, I also show the Taylor rule using both the Laubach-Williams natural rate and potential output (rather than CBO) estimates. Since output exceeds potential as of 2015Q2 using the Laubach-Williams estimates, the corresponding implied Fed funds rate is higher.
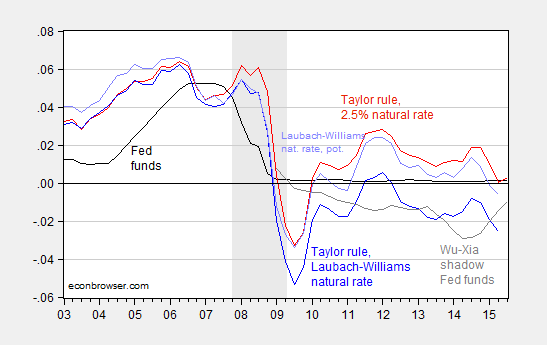
Figure 3: Fed funds rate (black), Taylor rule using 2.5% real natural rate of interest (red), Taylor rule using Laubach-Williams real natural rate (blue), Taylor rule using Laubach-Williams real natural rate and estimated potential (light blue), and Wu-Xia Shadow Fed funds rate (dark gray). NBER defined recession dates shaded gray. Source: Federal Reserve and CBO via FRED, Laubach-Williams [xls], Wu and Xia, NBER, and author’s calculations.
The Taylor rule is a two-legged stool. It ought to be three. Instead of revealing that other leg, I’ll leave it to those who are daring and perspicacious enough to figure it out, those on the quest for truth wherever it may lead. The third leg without which the two-legged creature of this post is nonsense. For it was precisely this fatally flawed incomplete rule that guided Fed policy on the destructive course that led to the Great Crisis. And then spawned the equally flawed policy of a-bridge-too-far ZIRP and QE, whose quite predictable unintended consequences will reveal themselves in the next crisis.
JBH: Great prose. Have you considered writing science fiction?
When Knut Wicksell was writing, economists realized that the inputs into economic activities was constantly changing and so he wrote theoretically rather than developing specific formulae. With the rise of econometrics came the hubris that economists could measure economic inputs and they would remain stable.
Looking at Menzies many curves and variables simply confirms the limits of econometrics. It is only as good as the inputs. Using econometrics to determine policy is nothing but an educated guess. As econometrics fails hubris grows because those who have sold out to econometrics would have to give up their life’s work without it.
Econometrics has its place in measuring the effectiveness of policies, but it is as bad as any educated guess in creating policy.
Ricardo: You should sometime look into the origins of the Taylor rule, in particular, how Professor Taylor first identified the relationship. It involved no econometrics.
This is the second-best line you’ve ever written:
“Sold out to econometrics”? Give me a break.
First best is your assertion within the last year that Saddam Hussein’s possession of WMDs validated our 2003 invasion of Iraq. But second best comes very close to the first.
Kenzie,
My comment was on econometrics and how econometricians attempt to predict. I know how the Taylor rules developed.
By the way it looks like you are far along in you effort to have the entire US on food stamps/SNAP or what ever name it has been given lately in an attempt to hide its past. I was impressed that you were so open about your intentions.
Sorry Menzie. That really was a typo.
Given lags in the adjustment process with an expected small and slow tightening cycle (e.g. 0.75% Fed Funds Rate at the end of 2016), from a highly accommodated stance, it’s not unreasonable to begin the “lift-off” in December.
Typically, the Fed takes a cautious stance. The labor market has been strengthening, although it still has a long way to go, and inflation expectations can change quickly (including if markets believe the Fed is falling behind the curve).
Anyway, the mainstream doesn’t believe another round of QE is necessary, at this point, and tightening is just a matter of timing and magnitude.
Peak Trader: What empirical evidence do we have for the United States that inflation expectations can change quickly, over the past thirty years?
Menzie Chinn, the Fed has kept inflation expectations low, e.g. in 2007 when monetary policy was restrictive. So, it should begin tightening soon.
Also, Greenspan was great at jawboning.
Since 2008 the Fed has tended to undershoot it’s target of 2% inflation so if people (who form inflation expectations) have learned anything it should be that the Fed is usually too quick to jump the gun and raise rates. This means that if inflation expectations were to become unanchored they are more likely to decrease than to increase.
In the 1990s, Greenspan believed the economy could grow faster without sparking inflation. He was right.
And, in the downturn after 2000, Greenspan lowered the Fed Funds Rate to 1%, which was exceptionally accommodative at the time. He was right about that too.
Then we had QEs.
So, you can say the Fed is too quick to jump the gun and lower rates too.
Perhaps I’m misreading, but doesn’t it say something when the Fed’s Taylor rule estimates suggest that they’ve been targeting 4% inflation (and more) since 2000 and utterly failing to achieve anything close?
Nothing personally, but most of these projections are silly and useless. They also look distorted and confused. They cycle in to much foreign money and not enough domestic money.
Nice, but who cares?
No one is debating that inflation is low. That’s not the issue. Nor was it the issue in 2008.
Rather, there are two different issues: one financial and one ideological.
The ideological argument hinges on a conservative weltanschauung. Greenspan captures the sentiment:
“Remember this: normal interest rates for reasonably good debt have always been in the 4-5% annual rate for millennia. We have data going back to ancient Greece, and interest rates were not all that significantly different then than now. And we have daily data going back to 1694 with the Bank of England.
“The reason this is the critical issue is it’s telling us the interest rates we’re looking at in history is almost certainly built into human time preference. It’s inbred. That means we’ve pressed the interest rates well below normal for a protracted period of time. The danger is they will begin to come up to where they’ve always been in millennia.”
This notion captures conservative fears about factors we don’t understand. If we’re diverging from established practice for a long time, conservatives worry that we could be blind-sided by something we can’t anticipate or know. Scott Sumner would probably dismiss this as mindless fretting, but there it is.
The other factor is global asset prices. Inflation did not blow up the global economy in 2008. The fingered culprit was an asset price bubble closely associated with US housing values. We now see a bubble again. That’s the concern you have to address.
Goldman notes that the corporate sector has relevered, by the way, and is now approaching levels which preceded the 2008 financial crisis.
http://www.bloomberg.com/news/articles/2015-11-10/goldman-sachs-says-corporate-america-has-quietly-re-levered
https://research.stlouisfed.org/fred2/graph/fredgraph.png?g=2wby
https://research.stlouisfed.org/fred2/graph/fredgraph.png?g=2wbB
http://www.mckinsey.com/~/media/McKinsey/dotcom/Insights/Economic%20Studies/Debt%20and%20not%20much%20deleveraging/MGI%20Debt%20and%20not%20much%20deleveragingIn%20briefFebruary%202015.ashx
Right, Steven. As a share of private GDP, non-financial corporate debt is back to the level of Q1-Q2 2008 and at the same levels as 1927-30 and Japan in 1987-94.
http://www.researchaffiliates.com/Our%20Ideas/Insights/Fundamentals/Pages/385_Are_Buybacks_an_Oasis_or_a_Mirage.aspx
http://www.hussmanfunds.com/wmc/wmc150817.htm
A growing share of the corporate debt taken on since 2009, and especially since 2012-13, has been to buy back shares, pay interest and dividends, finance M&A, and fund stock option grants for execs. The equity bubble enabled by QEternity and ZIRP encouraged taking on massive debt for equity.
https://app.box.com/s/earfgyknu6xx8woigktnnny6dn7devt2
More importantly, note that the real Aaa and Baa spreads to the 10-year Treasury are at the levels of 2008; the deflationary recession following WW II; 1937-40; 1927-34; and 1921-23.
https://research.stlouisfed.org/fred2/graph/fredgraph.png?g=2thC
The widening of the corporate yield spreads is occurring with a deep, recession-like contraction in the acceleration of the Austrian Total Money Supply’s (TMS) velocity to private GDP, coincident with the broad US equity market entering a bear market.
The Fed raising rates today would be like raising rates in 2008, 1937-40, or 1930, and the BOJ raising rates in the early 2000s or in 2008.
Dumb.
https://research.stlouisfed.org/fred2/graph/fredgraph.png?g=2oPM
Thus, I expect the Fed will more likely resume QEternity in 2016, and be compelled eventually to do NIRP.
https://research.stlouisfed.org/fred2/graph/fredgraph.png?g=2wfA
BTW, nominal private GDP is again decelerating below 3% YoY following a cyclical peak, which occurred at the onset of recessions since 1950, expecting the inflationary period of 1973-81, during 1967, and 1952.
Cool charts but what about unemployment rate? Doesn’t Taylor model take unemp. rate into account as well? The model in Bloomberg even with a zero natural rate comes out @ 0.97.
Indy: The output gap is a negative function of the unemployment gap, by virtue of Okun’s law. Bloomberg’s conversion factor is -2.0.
The Taylor rule specification on the Bloomberg terminals differs in other respects, more substantive, including use of core PCE rather than headline.
These comments display one of the problems with the Taylor rule.
What is it?
It changes regularly — even Taylor changes it every time we turn around–and different people modify it to the extent that we really do not know what it is or what it should be.
Laubach and Williams look at potential output and then make adjustments for such things as inflation pressures. Comparing the dynamics of one business cycle to another in this way is apples and oranges.
I just take a straight shot at real time potential output as measured from real GDP and effective demand, based on labor share, capacity utilization and unemployment.
I see that potential output dropped down to a growth rate of 0.5% after the crisis, but is now growing at almost 2%.
Here is a link to my estimation of the natural real rate. My estimation followed pretty well with theirs for decades. Then my estimation dropped together with theirs during the onset of the crisis, but then mine has been rising since the crisis. Theirs has not. Mine is the light blue line that I overlaid onto their graph in the following link.
http://angrybearblog.com/wp-content/uploads/2015/10/lw-ed-comp.png
Full article here…
http://angrybearblog.com/2015/10/lw-not-see.html
I stick with the view that the natural real rate of output is between 1.5% and 2.0% currently.
But the optimal interest rate is far from the current one. We live in strange times where the economy is trying to compensate for the adverse effects of high inequality. So the interest rates will be lower than optimal. People see much more unused capacity than reality has it. More people have been marginalized and cut out of the economy. Interest rates refuse to accept this fact yet. but eventually interest rates will have to rise and represent the economy minus those who have been marginalized by inequality. Here is my article on that view…
http://angrybearblog.com/2015/11/low-inf-from-low-int-rates.html
https://research.stlouisfed.org/fred2/graph/fredgraph.png?g=2wlQ
https://research.stlouisfed.org/fred2/graph/fredgraph.png?g=2wlO
https://app.box.com/s/h0p6s4ye96k6cx7smn0r2te0giganyy1
https://app.box.com/s/xcult10g1qfq3qi9wobow4j4l6j0pu0o
https://app.box.com/s/ys8ijadj4b57nb95ka0b3ilph38ga7fm