Today we are pleased to present a guest contribution written by Andrés Fernández (IDB), Michael W. Klein (Tufts), Alessandro Rebucci (Johns Hopkins Univ.), Martin Schindler (IMF and JVI) and Martín Uribe (Columbia Univ.). This post is based upon this paper. The findings, interpretations, and conclusions expressed in this article are entirely those of the authors. They do not necessarily represent the views of the InterAmerican Development Bank, the International Monetary Fund, the Joint Vienna Institute, their Executive Directors, or the countries they represent.
The Great Recession has spurred a reconsideration of the appropriate role of capital controls. The prevailing view among economists in the 1990s was reflected in the title of Rudiger Dornbusch’s 1998 article “Capital Controls: An Idea Whose Time is Gone.” But attitudes began to shift in response to the economic crises in the late 1990s. More recently, even IMF staff studies and policy papers have shown greater acceptance of the use of capital controls, under certain circumstances, as part of a country’s “policy toolkit,” a shift that The Economist magazine dubbed “The Reformation.” This new paradigm is consistent with a recent branch of theoretical research in which capital controls contribute to financial stability and macroeconomic stabilization—see for example Jeanne and Korinek (2010), Schmitt-Grohé and Uribe (2015), and Benigno, Chen, Otrok, Rebucci, and Young (2014). But these theoretical works stand in contrast to a number of empirical analyses that emphasize the ineffectiveness and potential costs of capital controls—e.g., Binici, Hutchison and Schindler (2010), Forbes (2007), Klein (2012), Prati, Schindler and Valenzuela (2012).
The evolving debate on capital controls highlights the importance of careful empirical analyses of these policies. One challenge facing researchers in this area is the availability of indicators of capital controls. In a recent paper, building on the data sets of Schindler (2009), Klein (2012), and Fernández, Rebucci and Uribe (2015), we have constructed a new data set that reports the presence or absence of de jure capital controls, on an annual basis, for 100 countries over the period 1995 to 2013. Like other de jure capital control panel data sets, this data set is based on information in the IMF’s Annual Report on Exchange Arrangements and Exchange Restrictions (AREAER)– Quinn (1997) and Chinn and Ito (first presented in 2006).
The distinguishing and important feature of our data set is its disaggregation of the information down to the level of individual types of transactions between residents and non-residents. This allows for the construction of capital control indices based on information on 32 separate transaction categories. This level of disaggregation of the data allows for a more detailed and nuanced analysis of capital controls than was possible with most other capital control indices. The data allow an examination of controls on different types of assets (e.g., portfolio flows, FDI, real estate and derivatives), on the direction of capital flows (inflows or outflows), on the residency of the agent involved (transactions by residents or non-residents), as well as the location of the transaction (transactions executed onshore or offshore). Furthermore, these data can be easily aggregated into indexes that target a specific research or policy question.
For example, Fernández, Rebucci and Uribe (2015) used these data to show that the presence of capital controls is relatively stable, and they are imposed in an acyclical manner. We also show, in the paper, that the data can be used to distinguish between narrowly targeted, episodic, and longstanding and widely-imposed capital controls; a distinction that Klein (2012) makes between “open”, “gate” and “wall” country cases. Binici, Hutchison and Schindler (2010), in turn, examine the relationship between de jure controls and de facto flows by asset category and directionality and find limited evidence of impact on the overall volume of flows, though some compositional effects.
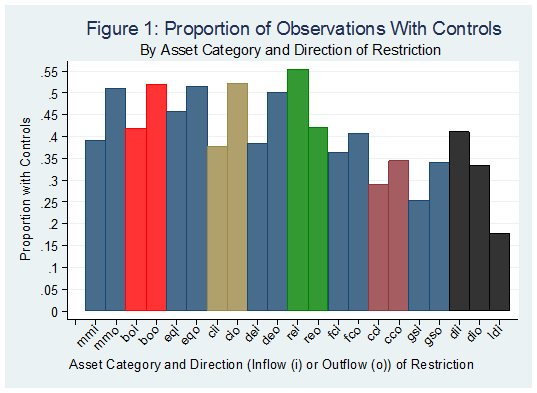
The ten assets in our data set (and their two-letter abbreviations) are money market instruments (mm, fixed income assets with a maturity of less than one year), bonds (bo, which have a maturity of one year or greater), equities (eq), collective investments (ci), financial credits (fc), real estate (re), commercial credits (cc), derivatives (de), direct investment (di) and guarantees, sureties and financial backup facilities (gs). Figure 1 presents information on the prevalence of controls across asset categories (the two-letter asset category abbreviations are followed by either i, for controls on inflows, or o, for controls on outflows, with the 21st category, ldi, representing controls on the liquidation of direct investment). This figure shows that controls are relatively less prevalent on liquidations of direct investment, guaranties and sureties, commercial and financial credits, ranging from 18 percent of observations for ldi, to 55 percent for rei. The figure also show that, in general, that controls on inflows and outflows tend to move together although there is a higher prevalence of controls on outflows than on inflows.
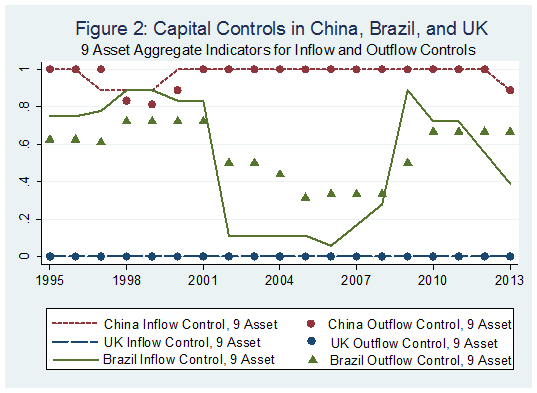
Other important characteristics of our data can be illustrated by means of country examples. Figure 2 presents a 9-asset aggregate indicator (the simple average of all categories except Direct Investment) for China, Brazil, and the United Kingdom: a Wall country, a Gate country and an Open country, respectively, in the terminology of Klein (2012). (According to Klein (2012), “Open” (“Walls”) countries have, on average, capital controls on less than 15 percent (more than 70 percent) of their transactions subcategories over the sample period and do not have any years in which controls are on more than 25 percent (less than 60 percent) of their transaction subcategories. “Gate” countries are neither Walls nor Open.) There were no controls on either inflows or outflows in the United Kingdom throughout the sample period, but at least some controls on virtually all categories of both inflows and outflows in China. Controls in the Gate country, Brazil, are more varied. They were reduced from a value greater than 0.8 in the first seven years of the sample to a value below 0.2 from 2002 to 2006. Then they were re-imposed, beginning in 2007 and 2008, with some controls on inflows subsequently lifted in 2012 and 2013, as the real began to depreciate.
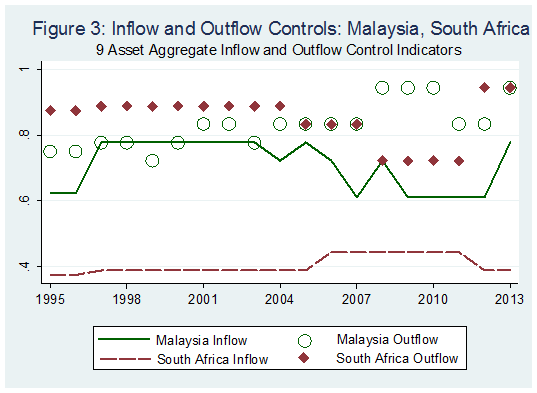
The experience of Malaysia and South Africa shows the importance of having separate indicators for inflow controls and outflow controls, something that is not available with other broad cross-country capital control datasets (Figure 3). In Malaysia, our 9-asset inflow control indicator moved in the opposite direction of the 9-asset outflow control indicator in 2004, and one indicator changed while the other was constant in 1999 – 2003, and 2005, 2008, 2011 and 2012. In these years, an aggregate inflow and outflow indicator would show less variation than the two separate series. South Africa has very different average values for its inflow and outflow indicators, and the two move in opposite directions between 2008 and 2011. During this period, while inflow controls were increasing, outflow controls were being relaxed. An aggregate that represents both inflows and outflows for this country would not show the large differences in its controls on inflows and controls on outflows. Figure 3 also illustrates a caveat regarding our data. The outflow index in Figure 3 does not pick up the tightening of controls on outflows in Malaysia during the crisis in 1998. This is because controls on outflows were already in place in Malaysia on most asset categories in our index at the time, and the policy tightening of controls did not introduce controls on new categories—see our paper for more details on this.
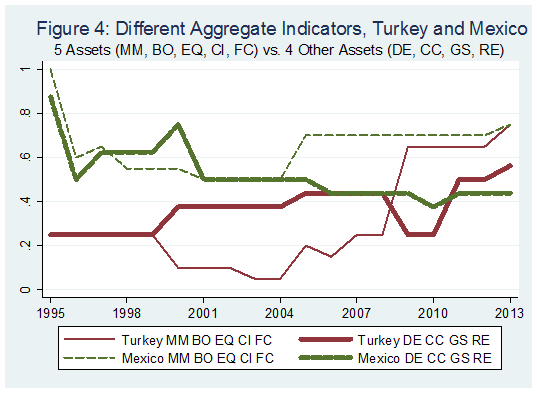
Along with differences in inflow and outflow controls, our data set also enables one to consider differences in controls across categories of assets. To illustrate this, we present in Figure 4 the values, for Turkey and Mexico, of two different aggregates of controls on both inflows and outflows, one for Bonds, Equities, Collective Investments and Financial Credits (mm, bo, eq, ci and fc) and the other for the four other categories (but for direct investment). This figure shows the divergence in these two indicators for Turkey after 1999, with the aggregates moving in different directions in 2000 and 2008. An aggregate of the full set of nine categories would fail to show the divergence in the sub-categories during the 2000 – 2011 period, and indicate more stability in the stance towards controls than the consideration of sub-categories would suggest. In a similar way, there is a divergence in the two sub-categories of controls in Mexico beginning in 2005 that continues for the remaining sample period. The experiences of these two countries show that the ability to distinguish among subcategories of assets may be important for analyses in which theory suggests the role of particular asset categories and where aggregate measures may mask the evolution of controls on those categories of assets.
The role for capital controls is one of the most hotly contested issues in discussions on the international monetary system. The shift in the views of some policymakers and researchers towards a greater acceptance of these rules and regulations in the wake of the economic and financial turmoil of the past several years contrasts with the concerns of others that restricting capital flows tends to be ineffective in reaching desired goals and, moreover, fraught with unintended consequences. Properly addressing the continuing controversies surrounding this topic requires careful, high-quality theoretical and empirical research. Our hope is that this data set proves useful in advancing our understanding of this important topic.
References
Benigno, G., Huigang Chen, Chris Otrok, Alessandro Rebucci, and Eric Young. 2014. “Optimal Capital Controls and Exchange Rate Policy? A Pecuniary Externality Perspective.” CEPR Discussion Paper 9936.
Binici, M., M. Schindler and M. Hutchison. 2010. “Controlling Capital? Legal Restrictions and the Asset Composition of International Financial Flows.” Journal of International Money and Finance 29(4): 666–684.
Chinn, Menzie D. and Hiro Ito (2006). “What Matters for Financial Development? Capital Controls, Institutions, and Interactions”, Journal of Development Economics, 81(1): 163-192.
Dornbusch, Rudiger (1998), “Capital Controls: An Idea Whose Time is Gone”, mimeo.
Fernández, Andrés, Alessandro Rebucci, and Martín Uribe (2015), “Are Capital Controls Countercylical?” Journal of Monetary Economics,.
Fernández, Andrés, Michael W. Klein, Alessandro Rebucci, Martin Schindler and Martín Uribe (2015), “Capital Controls Measures: A New Dataset” NBER Working Paper no. 20,970.
Forbes, Kristin (2007), “One Cost of Chilean Capital Controls: Increased Financial Constraints for Smaller Traded Firms,” Journal of International Economics, 71: 294 – 323.
Jeanne, Olivier and Anton Korinek (2010), “Excessive Volatility in Capital Flows: A Pigouvian Taxation Approach”, American Economic Review Papers and Proceedings, 100(2): 403 – 407.
Klein, Michael W. (2012), “Capital Controls: Gates versus Walls.” Brookings Papers on Economic Activity 2012 (Fall): 317-355.
Prati, Alessandro, Martin Schindler and Patricio Valenzuela (2012), “Who benefits from capital account liberalization? Evidence from firm-level credit ratings data,” Journal of International Money and Finance 31(6): 1649–1673.
Quinn, Dennis (1997), “The Correlates of Change in International Financial Regulation”, American Political Science Review, 91(3): 531–51.
Schindler, Martin (2009), “Measuring Financial Integration: A New Data Set”, IMF Staff Papers, 56(1): 222–38.
Schmitt-Grohé, S., and M. Uribe. 2012. “Prudential Policy for Peggers.” NBER Working Paper 18031. Cambridge, United States: National Bureau of Economic Research.
This post written by Andrés Fernández, Michael W. Klein, Alessandro Rebucci, Martin Schindler and Martín Uribe.


very interesting dataset.
thanks.
it seems the competition is increasing on the capital controls analysis and I like that !