Many analysts had anticipated that a dramatic drop in oil prices such as we’ve seen since the summer of 2014 could provide a big stimulus to the economy of a net oil importer like the United States. That doesn’t seem to be what we’ve observed in the data.
There is no question that lower oil prices have been a big windfall for consumers. Americans today are spending $180 B less each year on energy goods and services than we were in July of 2014, which corresponds to about 1% of GDP. A year and a half ago, energy expenses constituted 5.4% of total consumer spending. Today that share is down to 3.7%.

Consumer purchases of energy goods and services as a percentage of total consumption spending, monthly 1959:M1 to 2016:M2. Blue horizontal line corresponds to an energy expenditure share of 6%.
But we’re not seeing much evidence that consumers are spending those gains on other goods or services. I’ve often used a summary of the historical response of overall consumption spending to energy prices that was developed by Paul Edelstein and Lutz Kilian. I re-estimated their equations using data from 1970:M7 through 2014:M7 and used the model to describe consumption spending since then. The black line in the graph below shows the actual level of real consumption spending for the period September 2013 through February of 2016, plotted as a percent of 2014:M7 values. The blue line shows the forecast of their model if we assumed no change in energy prices since then, while the green line indicates the prediction of the model conditional on the big drop in energy prices that we now know began in July of 2014.
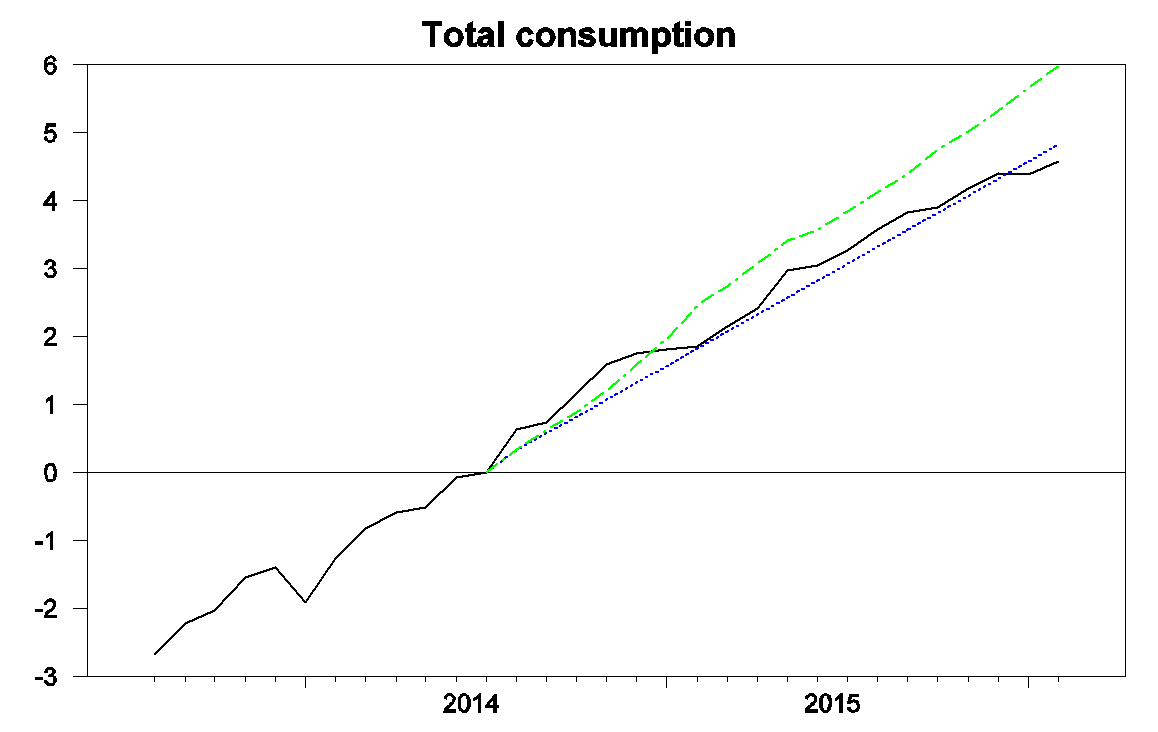
Black: 100 times the natural log of real consumption spending, 2013:M9 to 2016:M2, normalized at 0 for 2014:M7. Blue: forecast from an updated Edelstein and Kilian vector autoregression using only data as of 2014:M7. Green: forecast from the vector autoregression conditioning on observed energy prices over 2014:M8 to 2016:M2.
These calculations suggest that while there was a modest boost in spending in the second half of 2014 and first half of 2015, it was significantly less than would have been predicted from the historical relation between spending and energy prices. Moreover, any boost seems to have completely vanished by this point, with actual consumption even a little below what would have been predicted had there been no drop in energy prices at all.
A study of individual credit and debit card transactions by JP Morgan Chase Institute found that at the individual level, consumers did seem to be spending most of the windfall on other items. Their evidence for this was that if you compared the spending of an individual who had formerly had a big share of their budget going to gasoline with someone who did not, you saw the spending by the first person rise relative to the second by almost the full amount of the first person’s gain. The reconciliation between this micro evidence, which suggests that consumers did spend much of the windfall, and the macro evidence, which shows no evidence of a significant increase overall, is that there were other factors besides oil prices that were holding everybody’s consumption back, such as slower income growth and more precautionary saving. Spending by households with big gasoline expenses may have risen relative to other households at the same time that the average spending by all households came in close to trend. These aggregate factors show up as part of the “error term” in regression models like Edelstein and Kilian’s. If that’s the right way to interpret this, it means that aggregate consumption spending did get a boost from lower oil prices in the sense that we would have seen much more anemic growth of spending had oil prices not come down so dramatically.
On the other hand, there can be little debate that lower oil prices have meant a major hit to the incomes of U.S. oil producers. One place that this is starting to show up in the GDP numbers is in capital expenditures. Spending on mining exploration, shafts, and wells was contributing $146 B at an annual rate to U.S. GDP in the second and third quarters of 2014. By the end of 2015 that number was down to $65 B, a drop of about half a percent of GDP.
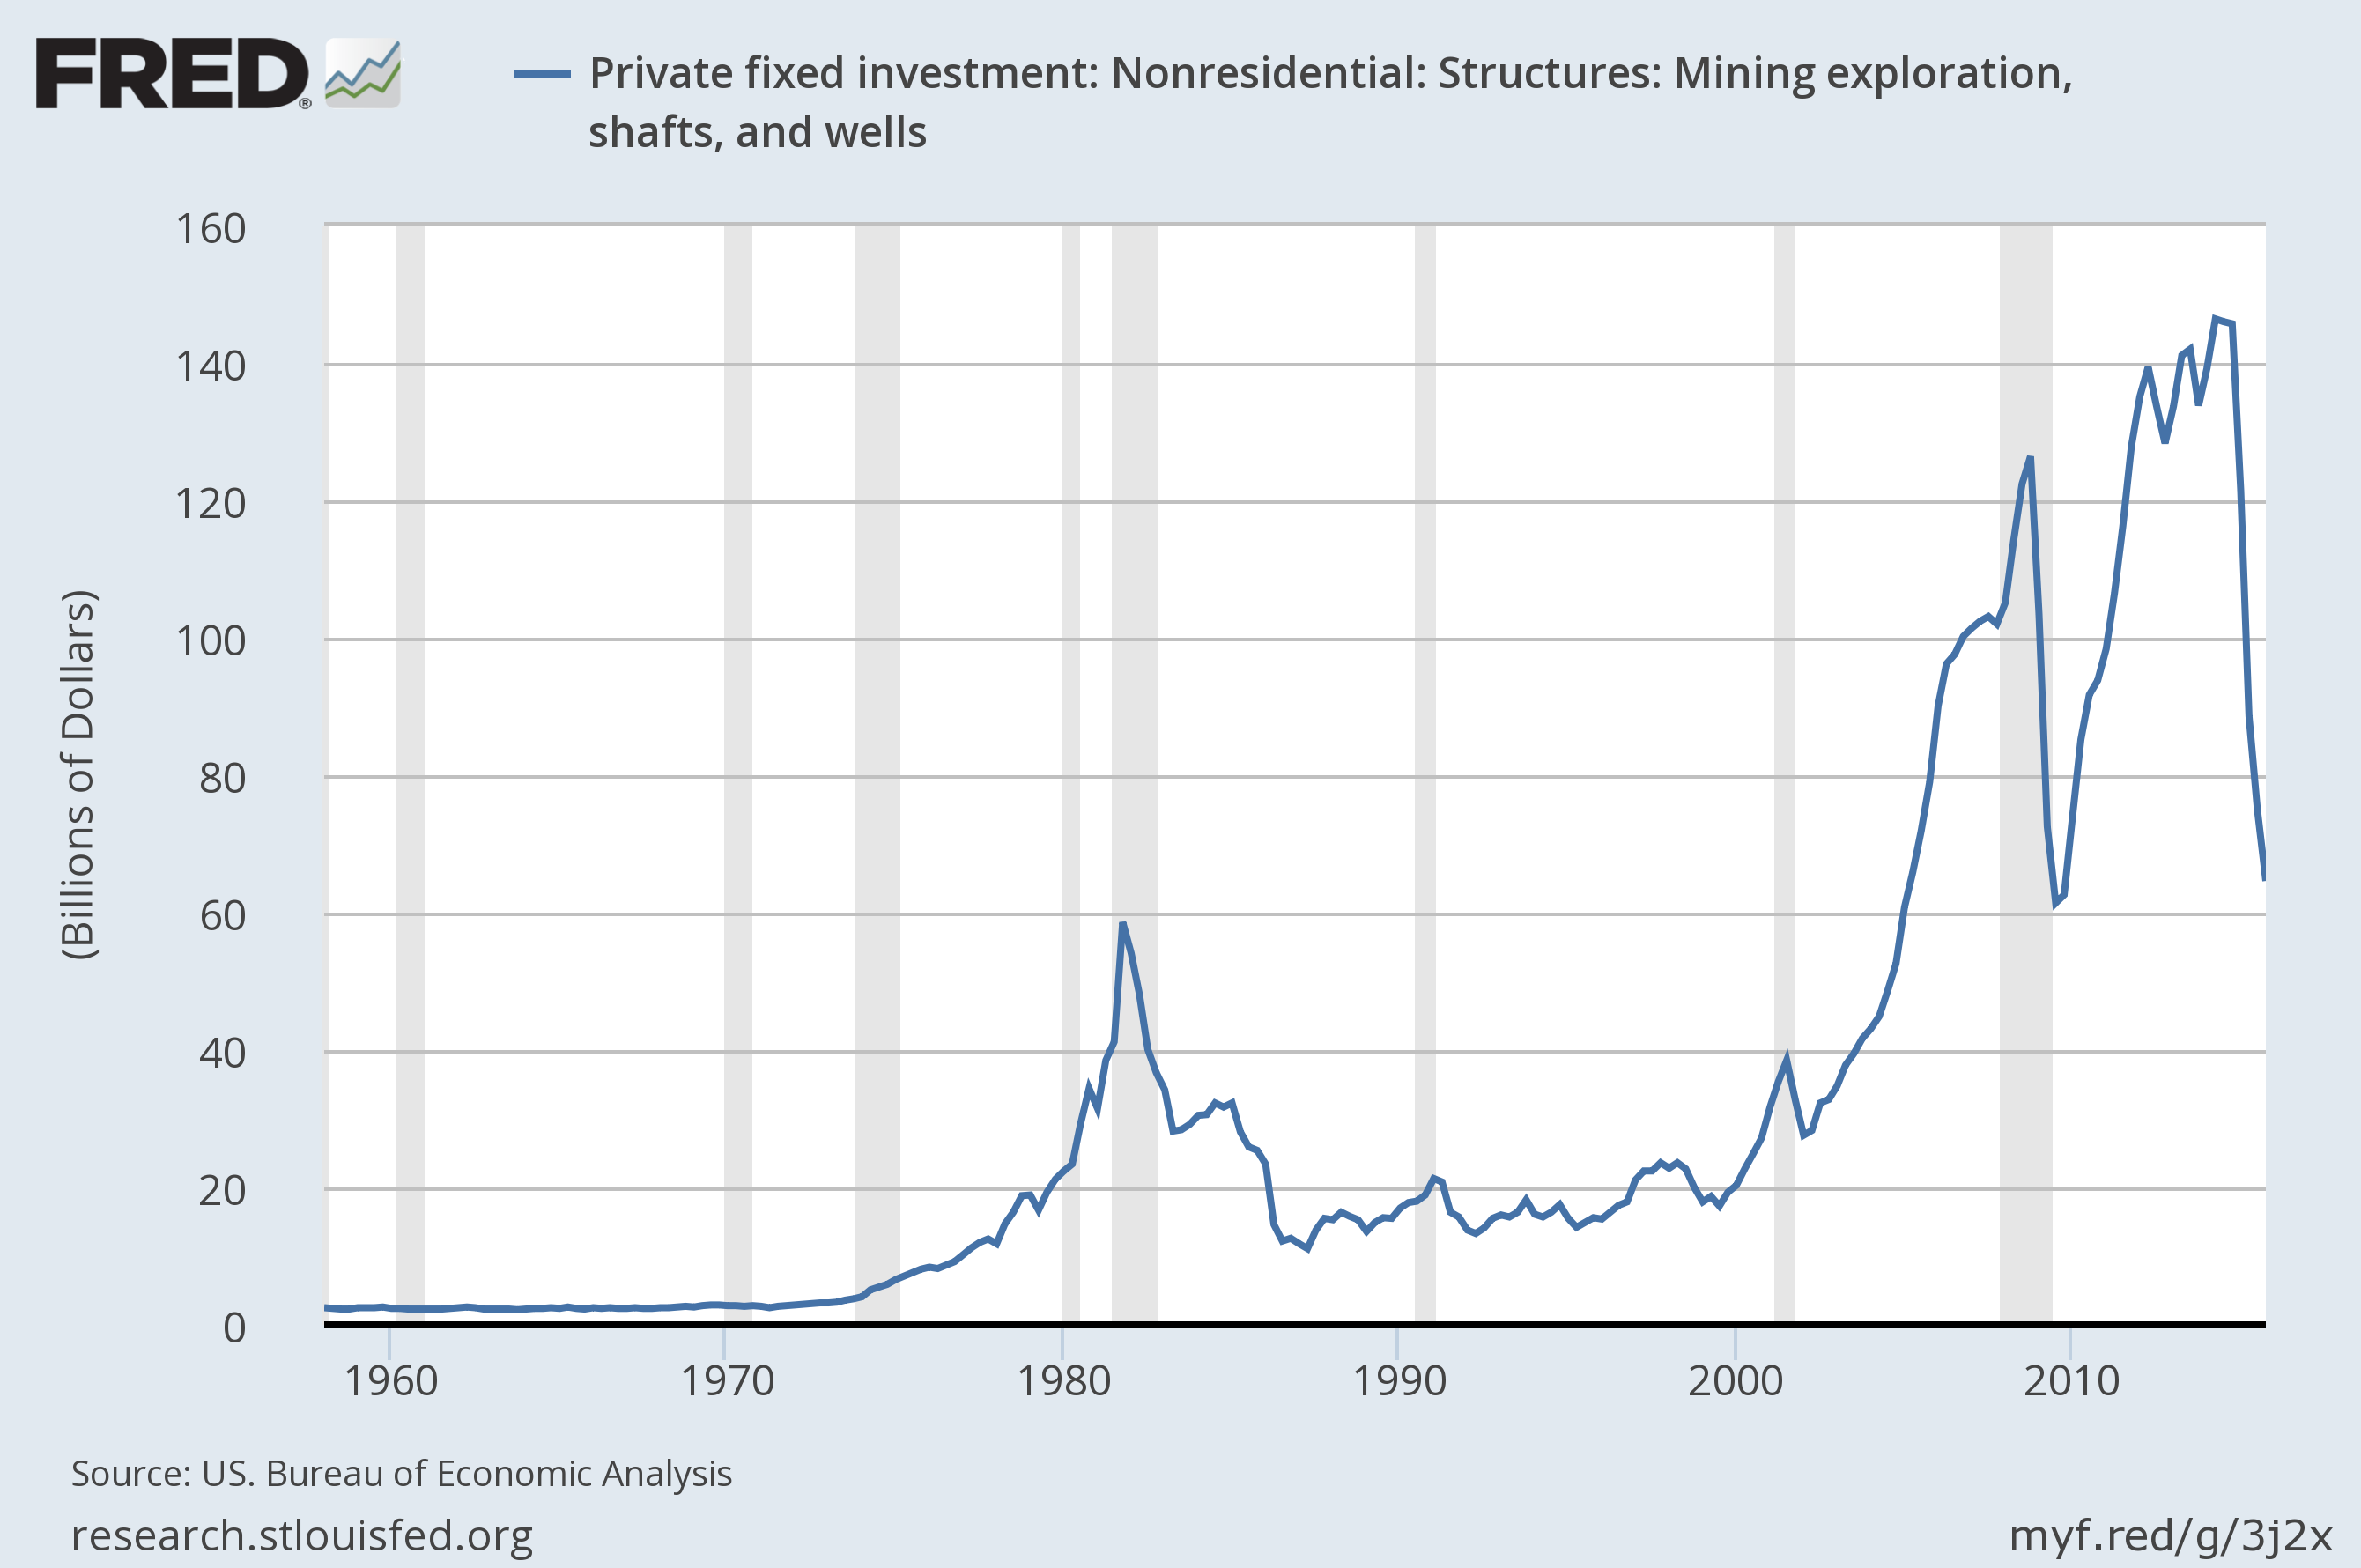
Expenditures on private fixed nonresidential structures investment in mining exploration, shafts, and wells. Source: FRED.
So far the resulting drops in U.S. oil production have been relatively modest. But I am expecting a significant decline for 2016, and that will be an additional direct drag on U.S. real GDP when it happens. Feyrer, Mansur, and Sacerdote estimated that the fracking boom caused the number of Americans working to be 3/4 of a million higher and the unemployment rate to be 0.5% lower during the Great Recession than it otherwise would have been. We’re about to watch that process operate in reverse.
If the U.S. were not a net importer, then even if the added spending by consumers was exactly equal to the reduced spending by producers, the result could still end up being a net drop in GDP. The reason is that if I buy another restaurant meal in New York, that’s not much help to someone who was counting on selling sand (or for that matter even restaurant meals) to frackers in Texas. As enterprises that were selling items to those working in oil production see a drop in their demand, they may end up laying off some of their own workers. As a result of those layoffs, the net loss in Texas could exceed the gains in New York. In a 1988 paper I showed that in an economy that produced all its own oil, an oil price decline could lead to higher total unemployment, in part because it takes time for people in the oil-producing regions to move to the areas where the jobs are now available.
For a net oil importer like the United States, the direct dollar gains to consumers exceed the dollar losses to domestic producers. Even so, multiplier effects from displaced workers and capital in the oil sector could end up eating away at some of those net gains. When oil prices collapsed in 1986 we saw no boom in the national U.S. economy, and in fact Texas and other oil-producing states experienced their own recession.
On the other hand, when oil prices spike up rapidly the result is unemployed labor and capital in sectors like autos and their suppliers. Furthermore, in the days before fracking there was a much longer lead time between an increase in oil prices and an increase in spending by oil producers. The result was an unambiguous net negative shock to GDP from a big upward spike in oil prices. The oil price shocks of 1973, 1979, 1980, 1990, and 2007 were all followed by economic recessions. In a recent paper I surveyed a number of academic studies that concluded that while a sharp increase in oil prices can reduce U.S. GDP growth, it’s harder to see evidence of significant net gains for U.S. GDP from a sharp decline in oil prices
It looks like we’ve just added some more data to support that conclusion.
The US trade balance suggests that savings on the US oil trade deficit as being spent one-for-one on trade imports from other countries.
It’s plainly visible on the second graph down: http://www.calculatedriskblog.com/2016/03/trade-deficit-increased-in-january-to.html
Right, but the increased trade deficit suggests faster consumer spending. I think the Gov if off.
How do we know the government is calculating right? Energy price deflation can screw up hedonics. My guess spending is revised upward a bit.
The remark that is supposed to indicate a possible reconciliation between the micro credit card study and the macro result shown in the graph makes no sense. “there were other factors besides oil prices that were holding everybody’s consumption back,…” does nothing to reconcile the two, but only adds to the apparent contradiction. If consumption was held back, why did people who historically used a lot of gas spend (“consume”)more non-gas items on their credit cards?? Chase is saying spending was level.
If you can’t reconcile that, there really is nothing to say because you’re not stating which data you choose to believe.
Other important factors not addressed (that still don’t resolve the discrepancy):
– Did prices drop on other large components of spending due to the lower cost of shipping and manufacture? That would tend to reduce spending.
– Since the exact amount of oil the US imports is known, why even look at models that consider the US to be self sufficient? Obviously the profits lost on oil would cancel the savings, so that model is entirely irrelevant.
– If US production has not yet dropped, why are the Texas frackers unemployed? Maybe they will be in the future, but you would need a better estimate of actual lower Oil payrolls vs GDP to say anything about current data. Sure, oil industry unemployment might alter future spending, but aren’t you looking at a past spending paradox?
What about large categories of consumer spending that don’t appear on credit cards – like debt service? Have outstanding credit card balances decreased? Are people paying down mortgages or other debt? Lower delinquency rates (that wouldn’t be reflected in credit card spending patterns).
There are just too many moving parts in consumer spending to encapsulate them with this broad an analysis. It really doesn’t answer the question “Why no economic boost.” In fact, it doesn’t really even answer the question of whether there was an economic boost or not.
Mark Rockbin: Suppose that before gas prices went down, c1 was 95 and c2 was 100, so average c was 97.5. Suppose c1 saved 5 on gasoline and c2 saved nothing, because c1 drives a lot and c2 doesn’t drive. We next observe c1 = 97.5 and c2 = 97.5. Then c1 has risen by 5 relative to c2; c2 – c1 used to be 5 and now it is zero– that is what Chase study claimed to observe. But average is still 97.5, just as before– that is what aggregate data claim to observe. Interpretation is that some aggregate factor (such as more precautionary saving) was holding both c1 and c2 back by 2.5 relative to what they would have been without that factor. Specifically, in the absence of that aggregate factor (but with the same drop in gasoline prices) we would have seen c1 = 100 and c2 = 100.
have you looked carefully at chase study? Confidence bands are huge, a lot of sampling issues, it is not a panel but just cross-section, obscure methodology, …
the individuals who had formerly had a big share of their budget going to gasoline are a very small part of aggregate spending overall…what are those whose gasoline spending is a drop in their much larger budget bucket doing?
anecdotally, i can’t say there was any occasion where i personally spent more than i otherwise would have despite relatively large savings on heat oil…my spending habits are pretty inelastic, it would take more than a few extra thousand dollars in my pocket to change them…
Then you’re savings went up or you paid off some (credit card) debt.
Texas’ Unemployment Rate Has Been Steady over the Past 6 Months
http://www.bls.gov/eag/eag.tx.htm
In fact, the Texas rate is well below the national rate and absolute employment has risen. Texas is not in a recession at all despite the collapse of oil prices.
OTOH, national economic growth is clearly weakening and will likely be close to zero for 1Q16.
https://www.frbatlanta.org/cqer/research/gdpnow.aspx?panel=1
This is due to the appreciating value of the dollar and the massive reduction of the federal budget deficit. From August 2011 through
January 2016, the dollar appreciated by about 54 percent against the yen and by about 32 percent against the euro.
Against an index of currencies of 19 other important trading partners (including China, India, and Mexico), the dollar has
appreciated by about 27 percent. https://www.fiscal.treasury.gov/fsreports/rpt/treasBulletin/b2016_1.pdf
Meanwhile, the federal budget deficit (as a per cent of GDP) declined by 74.5% from FY2009 through FY2015.
https://www.whitehouse.gov/omb/budget/historicals
Any Keynesian would understand this situation, but anti-Keynesians would not.
Why is 2009 a relavent starting point for budget comparisons?
FY2009 was the peak of the Great Recession and therefore should have been the beginning of counter-cyclical fiscal policy. Instead, it was the beginning of pro-cyclical fiscal policy with obvious consequences.
“FY2009 was the peak of the Great Recession and therefore should have been the beginning of counter-cyclical fiscal policy.”
Go back to 2008 and find a single Keynesian that said fiscal stimulus should wait until the recession peaked. Or consider the definition of the output gap and the definition of cyclical. The peak of the recession should correlate to the PEAK of counter-cyclical policy. Ideally (from a Keynesian perspective) fiscal stimulus would start at the beginning of the recession, and taper off as UE/GDP returned to normal levels or trend.
FY2009 started on Oct. 1, 2008. Lehman Bros. did not collapse until Sept. 15, 2008. Until then, many economists did not think a recession had begun or believed that it would be only a mild recession that could be rectified with monetary policy.
Obviously in hindsight, stimulus should have begun in FY2008, but that was never contemplated in September 2007. Just as obviously, constricting fiscal policy in 2009 and thereafter, was completely wrong. But that is exactly what Pres. Obama and the Republicans did:
In April 2009, before the Great Recession in the U.S. had even hit bottom and as nearly 700,000 jobs were being lost that month alone—with over a million more jobs to be lost until the unemployment rate finally hit its peak six months later—President Obama was telling Americans that the federal government had to “tighten its belt” and impose “fiscal discipline” to end the economic crisis:
“We came into office facing a budget deficit of $1.3 trillion for this year alone, and the cost of confronting our economic crisis is high. . . But we can’t settle for a future of rising deficits and debt that our children can’t pay. All across America, families are tightening their belts and making hard choices. Now, Washington must show that same sense of responsibility.” President’s Weekly Address, 4/25/09
Yes, of course “Ideally (from a Keynesian perspective) fiscal stimulus would start at the beginning of the recession.” But nobody had perfect foresight of the disaster ahead in August 2008.
“Until then, many economists did not think a recession had begun or believed that it would be only a mild recession that could be rectified with monetary policy. ”
It is irrelevant what people thought at the time, the output gap is the measure of a economic potential minus economic actual. The baseline for stimulus is thus the time period leading up to the recession (possibly adjusting for expected growth depending on your views), not the amount of spending that was occurring when economists agreed that the recession had started X months ago.
“Obviously in hindsight, stimulus should have begun in FY2008, but that was never contemplated in September 2007.”
Actually it did (though not in September)- here is Paul Krugman on Jan 14th 2008-
“Suddenly, the economic consensus seems to be that the implosion of the housing market will indeed push the U.S. economy into a recession, and that it’s quite possible that we’re already in one. As a result, over the next few weeks we’ll be hearing a lot about plans for economic stimulus”
And Bush signed the economic stimulus act into law in Feb 2008, and the Housing and economic recovery act enacted July 2008.
Obama’s quote isn’t placed on the right timeline, He took the oath Jan 2009, and signed his stimulus bill in Feb 2009. Quoting him about “belt tightening” 2 months after signing an 800 billion dollar stimulus bill is a little, um, funny. The 1.3 trillion dollar deficit he mentions is mostly stimulus, the deficit in FY2008 was ~450 billion. Comparing FY 2010-2016 to FY 2009 is the same as saying “if you ignore all the stimulus we did in 2009, we did no stimulus in 2009”.
“It is irrelevant what people thought at the time, the output gap is the measure of a economic potential minus economic actual. The baseline for stimulus is thus the time period leading up to the recession (possibly adjusting for expected growth depending on your views), not the amount of spending that was occurring when economists agreed that the recession had started X months ago.”
is data available to make this assessment in real time?
@ Baffling
It doesn’t matter if the assessment is made real time or not (we can’t know when the peak of the recession is in real time either), what matters is that you need compare govt spending prior to the recession to during the recession to determine if spending is “stimulative”. Intent for the spending doesn’t matter, the fact that spending occurred or didn’t occur does.
“The peak of the recession should correlate to the PEAK of counter-cyclical policy. Ideally (from a Keynesian perspective) fiscal stimulus would start at the beginning of the recession, and taper off as UE/GDP returned to normal levels or trend.”
in real time, can you begin fiscal stimulus at the start of the recession? when we talk stimulus, we talk intentional stimulus. not sure if an accidental gap would be considered a stimulus?
“when we talk stimulus, we talk intentional stimulus. not sure if an accidental gap would be considered a stimulus”
Keynesian models don’t distinguish between on purpose or accidental, they might distinguish between tax breaks or spending increases giving each a different multiplier, or infrastructure spending vs UE benefits, but the mechanics of deficits turning into stimulus don’t change based on the reasons legislators had in authorizing the spending.
The Texas unemployment rate for Feb . (prelim) is 4.4%. In July 2014, just as oil prices were beginning to crash, the rate was 5.0%.
The unemployment rate in Texas looks liked it peaked at 4.6% this past December, and declined in Jan and Feb. Now, unlike some other states, the unemployment rate in Texas has not declined in the last 18 months. On the other hand, it is quite low. These leads us to conclude that oil sector personnel who were laid off have already found alternative employment, and this is going to be a problem when the oil sector re-starts. The labor simply won’t be there.
steven, do you have any feel for the number of oil workers in texas, who when they are laid off, leave the state? i would assume there are a number of transplant workers-like in north dakota-and perhaps they leave rather than enter the unemployment pool of texas? otherwise, any idea what other alternative employment they are taking? either way, the labor supply will be a problem if/when oil recovers.
Professor Hamilton,
When clicking on the Edelstein link, I got the following site message “The SiteMaker service was decommissioned on November 30, 2015.”
AS: Thanks for calling this to my attention. I’ve replaced it with a link to the journal version of the article, though you won’t be able to access more than the abstract unless you have access to a university. If you can find an unblocked version of the working paper, let me know and I’ll link to that.
“the fracking boom caused the number of Americans working to be 3/4 of a million higher and the unemployment rate to be 0.5% lower during the Great Recession than it otherwise would have been. We’re about to watch that process operate in reverse.”
haven’t we already seen the brunt of of the negative impact on employment from the energy price collapse? the US rig count has already declined 77% from peak, oil companies have already laid off thousands of workers. i am not suggesting this is over, and of course the production declines lag investment, i am just thinking that we may have already passed the largest point of negative impact on employment figures.
I think the evidence suggests that fracking probably lowered the unemployment rate by something like 3-5 percentage points. In 2011, the US unemployment rate was 10%, as it was in Europe. It’s still 10% in Europe and now 5% in the US. The difference: a whopping amount of US oil which transformed the US current account.
I really think you can’t have a discussion of oil effects without using the lens of the current account. If you’re importing a lot of oil, and its price goes up, then you need to either i) consume less, ii) export more, or iii) borrow more. If you can’t borrow more, then you’ll be consuming less, and you do that principally by slowing down your economy.
It’s possible energy savings went into debt paydowns.
Yes, and that’s likely if there is pessimism about the economy.
A gasoline price cut though is like the ultimate tax cut:
– its benefits are spread out through the entire working population, not just those who pay income tax (you get indirect effects for the very low paid– municipalities get a break on the cost of diesel fuel for their buses, so probably don’t raise ticket prices as fast)
– it’s a small, weekly benefit. Behavioural finance suggests those are far more likely to be spent rather than saved vs. a single large lump sum
– there’s a supply side benefit, in that low paid workers can afford to drive further to work, therefore increasing the available labor supply to employers And similarly small self employed contractors (think of all those pickup trucks) can afford to drive further to clients– landscape gardening, construction, repair & maintenance etc.
Average US household from memory spends c. 4-5% of its budget on gasoline, so the kind of drops we have seen are a significant increase to real incomes. And that goes for people who only pay Social Security taxes, as well as higher income groups.
Seems this means we should have a counter cyclical carbon tax that raises gas prices now (moderately) and then goes away when when prices spike to help decrease the negative impact of the changes in gas prices.
There has been a slowing trend in quarterly real GDP growth, since mid-2014.
Nice editorial on fracking from Gary Sernovitz at Lime Rock.
http://www.nytimes.com/2016/04/11/opinion/can-liberals-frack.html
If you are interested in fracking at the layman’s level, I can recommend his new book, The Green and The Black. The oil aspects of the book are excellent, balanced and technically correct. If you want to read just one book (and a good beach read at that) to be able to converse about fracking with the literati at cocktails parties, this is the one for you. Recommended for the Menzie’s of the world.
Maybe it’s a simple-minded theory, but it seems to me that what underlies all this is pervasive economic pessimism. What matters in consumption choices is not so much current disposable income as expected income, and people don’t expect that to rise much if at all. After 30 years of slow or nonexistent growth in wages, many of us no longer count on our standard of living rising in the future so we’re reluctant to spend more just because of a windfall like low fuel prices. .
Evidence shows small drip drops into your pocket *do* get spent. And gasoline price cuts fit that framework.
Whereas single one-off lump sums tend to get used for debt reduction or savings.
It is a fact that the US dollar has gotten much stronger on a broad trade-weighted basis. The dollar rally coincided with slump in oil and other commodity prices. Over the past two years, the correlation is close to perfect.
Did the dollar rally push down oil prices? Did lower oil prices push up the dollar? Or perhaps both the dollar and oil prices were driven by a common factor, perhaps the slowdown in emerging economies.
The stronger dollar would hurt the US trade balance at the same time that lower oil was boosting consumer purchasing power. The net effect may been a wash or even negative. That is a different situation from a hypothetical in which the dollar is steady but a surge in oil production pushes down prices.
The direct effects of a USD rise are small. The US does not have a big percentage of GDP devoted to foreign exports/ imports, by the standards of the other G8 countries (or even China). It is relatively self sufficient– think of the biggest single items in the economy e.g. healthcare– almost entirely US in both consumption and production of healthcare services.
So a loss of exports/ rise in imports, does not have a huge effect on the US economy. Mostly for commodity producers.
At least in the short term. In the long run, patterns like tourism and industrial location (transplant plants in the US) can change. That said, most manufacturers who price products in USD (and that’s a lot of the world) tend to have at least some production in the USD zone (and that works out to NAFTA, primarily).
No mention of the mandatory, increasing payments to the health insurance industry and the fact that these are a significant component of GDP growth?
And they have slowed, dramatically.
Note of course that higher health care payments go into GDP: insurance companies and healthcare providers are all part of GDP.
Your loss is someone else’s gain. Very little of US healthcare expenditure “leaks” into imports (whereas say spending on consumer goods has a high import percentage).
This is an excellent blog. I read it often but have never gotten into the scrum. For once I feel the need to comment on one specific piece – the study by the JP Morgan Chase Institute on consumer spending. It is useless.
Frank Fisher used to warn his students “bad data are not just torn IBM cards.” It is advice that has long sense been lost in the econometrics community except when academics face off in Federal Court and must defend their work under oath.
Frank’s comment applies to the Chase Study. The authors of the study explain at page 8.
We identify gas and non-gas consumer spending using anonymized data from debit and credit card transactions among Chase customers. We classify all spending at gas stations as gas spending, and spending on everything else as non-gas spending. For most individuals, we know area of residence by zip code, income, age and gender, which allows us to examine consumer behavior across different demographic and geographic groups. Although we do not observe the quantity of gas purchased or the price of gas for each transaction, we use state-specific price data to explore the impacts of gas price declines on the average per capita quantity of gas purchased in each state.
There are two problems with this approach. First, gasoline is sold not only at both gasoline stations and large warehouse stores such as Wal-Mart and Costco. Second, consumers buy other things at gasoline stations.
It is not clear whether sales at firms such as Costco are included in their data base. However, we know that the larges volumes are sold at these stores. Further, anecdotal evidence form the managers (I have tried to get hard data but there has been no cooperation) suggests sales spike when prices are high and fall when prices are low.
It is clear, though, that consumers buy other things at gasoline stations and that “inside sales” meaning sales of goods other than gasoline are negatively correlated with the price of gasoline. I am on the board of a private firm that owns a large number of stations. I will state that the correlation is high and the price elasticity of substitution is high. This provides a storing incentive for firms with large stores attached to gasoline pumps to keep gasoline prices as low as possible.
With regard to the Chase Study I will simply say what I told the authors – it is a flossy prevention of random numbers which tell us nothing about consumer gasoline consumption.
Don’t forget, our taxes(Fed/State/Local) have gone up, health care costs and school fees. I will soon have 2 in college and 1 in prep school. I have a high paying job; but am going into debt for the kids education.
are your kids in private or public schools?
Offsetting Federal looseness has been tightness by state & local government. I think someone called it “1000 Herbert Hoovers”. Also with new home construction low, there hasn’t been the same demand on municipalities to provide new infrastructure.
The looming crisis is pensions (actually it is already here)– falling returns plus overgenerous promises to public sector workers have left many state and local governments in the USA in a lot of trouble. Illinois always comes out first and foremost (after Puerto Rico) but there are others. That will compel further rounds of higher taxes/ spending cuts.
It is hilarious that economists are mystified that low oil prices haven’t boosted the economy. It’s because the same thing (tight money) that is causing low oil prices is causing an economic slowdown. If you consider (as I do) that the best indicator of the real value of the dollar is the reciprocal of the CRB Index, everything becomes clear.
and the US shale boom has curtailed the export of dollars/for oil that is spreading our tight money globally, and punishing the emerging countries that once again took out loans in US dollars when it looked too good to be true… Look for more bankrupt EM government bonds ahead…
It’s interesting to me that virtually all of this discussion (with the possible exception of Steve Kopits’ contribution) is about effects on aggregate demand. What about aggregate supply? Standard textbook analysis of the 1970s stagflation attributes it to a negative AS shock caused by rising energy prices. This negative AS effect dominated any negative AD effects, or we wouldn’t have gotten such high rates of inflation. So, why should we expect much positive effect on AD today from declining energy prices? It doesn’t take much to convince me that negative effects on investment in the energy industry balance any positive effects on consumption.
The 2014-15 energy price decreases, like the 1970s energy price increases (and unlike the decreases in 2008-09), are most likely driven by trends in oil and gas supply. Since July 2014 we’ve seen lower energy prices drive headline CPI inflation downward, but very little effect on core inflation. To my mind, the real puzzle is why the decrease in energy costs to the non-energy industrial sector (along with the stronger dollar) hasn’t driven core inflation down.
Perhaps energy price decreases have a smaller AS effect on the service-oriented, energy-efficient economy of the 2010s than energy price increases had on the more manufacturing-oriented and less energy-efficient US economy of the 1970s. Maybe the current economy is more electricity-intensive than fuel-intensive, and power companies aren’t passing through their lower natural gas and coal prices. (https://www.eia.gov/electricity/data/browser/#/topic/7?agg=2,0,1&geo=g&freq=M)
Or, maybe the rightward shift of the AS curve is just slow, as AS shifts are wont to be. In any case, it seems to me that the AS side of this question is the more interesting side.
It’s not immediately clear that a services-oriented economy is less *oil* intensive than the earlier US economy.
Consider: oil is used in transport, primarily. So that’s shipping, flying, railways, private motor vehicles, delivery and distribution services. The railways have been doing well until recently and investing heavily. People are driving more: whether to commute (more employed, more people taking up less convenient jobs which become available) or leisure. Distribution services like Amazon are booming, ditto freight etc. Flying is not getting less popular.
Yes there is higher fuel efficiency, but overall fuel demand does grow y-on-y when the US is not in recession (with the drops you would expect of the rise to an average $100/bl price for a 4-5 year period).
As for heavy industry, in the US that largely fuels itself with *natural gas*. Which is already at record low prices. Manufacturing companies heat their factories with gas, and with electricity (air conditioning as well)– and electricity in the USA is generated by natural gas, coal, nuclear, some renewables ie NOT crude oil byproducts.
Oil is using as a heating fuel in a relatively small number of homes and businesses, mostly concentrated in the North East.
Take it further, a significant amount of services is oil related eg oilfield services sector.
Reverse pass through http://www.bls.gov/regions/west/news-release/averageenergyprices_sanfrancisco.htm
Electric and retail natural gas prices have risen during that time, before starting to fall in 2016, but I’m looking at a 20% jump right now in N. CA. I leased an electric car in 2013 (for 3 years) in part to capture the low (and now 50%) lower nat gas prices while oil prices stayed high. My electric rates went up more than expected as it pushed me to a higher tariff bracket, and wasn’t improved by any “electric car friendly” rate plan. My electric prices have steadily risen (about 20% in last year alone) in spite of cheap supplies, mostly driven by extra costs of buying mandated solar like the German and other house-top-solar countries (Spain doesn’t allow roof top solar) have experienced. Nevada time-of-day pricing court decision of solar could begin to reverse that effect and expose the “peak supply” problem of solar which has driven cost increases at many US utilities. I’m giving up my electric car for a gas car as I think shale will keep a lid on oil for a long time, and there are no incentives to build the charging infrastructure (which isn’t even standardized)–good luck Tesla. I have seen some data supporting the notion that a larger portion of the oil savings has been spent on gasoline–the product with the biggest price cut (and consumer’s expect to disappear like in the past), which is obvious from the jump in miles driven and the larger cars/trucks being sold today, and helped increase the savings rate/pay down debt.
AS has probably been more constrained than the AD by pessimism: weak investment spending (weak animal spirits + lower investment/revenue of the fast growing tech sector + higher dollar reduces exports demand = higher corp savings). While AD was first constrained by the states’ budget cuts, and then subsequently as mentioned by the federal budget declining share of GDP, so far only China has really pushed fiscal stimulus to offset the weak global economy. After a debt-fueled bubble bursts, it is hard to grow supply with excess global capacity–it took WWII to shrink excess capacity after the last depression. Weak commodity prices today echo the problems of that era.
Although rigs/workers have fallen dramatically without much impact on supply (within 5% of peak means revenues have largely held up), that can explain the unexpectedly weak impact on the Texas economy–much more resilient than in 1970, more diversified, with a vibrant tech sector, and a even a wine industry now). Its oil sector is much more resilient in the face of today’s price declines–shale is innovating faster than any sector I’m aware of–almost 50% price drop in a couple years (it is as high tech as any silicon valley start up). Forecasting a sharp shale production decline in 2016 is tough with the oil price swings so volatile, global supply estimates so difficult to aggregate, and the pace of innovation in shale so much faster than ever expected. Natural gas frackers increased production in spite of similar price declines.
It seems to me the key here is that US monetary policy is already very loose.
What an oil price drop does is allow the Central Bank to relax monetary policy, with less risk of inflation– so if the economy is weaker, they do that.
That worked fine when Fed Rate was say 6%.
Now with near zero rates, there’s no room for further monetary loosening (without getting really creative eg helicopter drop). So the benefit to the economy as a whole from that just does not take place.
Meanwhile the negatives, a drop in activity in the oil producing sector and allied industries and localities, is not fully offset by more spending elsewhere. To the extent the US imports oil, there *is* a net gain, but it’s small.
The key is the ZIRB (Zero Interest Rate Bound).
I think James Hamilton has shown fairly decisively that one area of the US economy very susceptible to gasoline prices is light vehicle manufacture (and consumer sentiment).
The latter is certainly booming– with emerging concerns about sub prime auto loan securitizations (sigh).
However the US oil related economy is relatively large at this point (both domestic, eg fracking, but also it’s a global industry, HQ’d in Houston) and the downturn there is quite immediate and brutal– the oil patch is going through one of its rough spots.
The other point (see my other post) is that this lower oil price and higher USD does not allow the Fed to proceed with looser monetary policy– that’s about as loose as you can get without radical measures like Japan has done/ is considering.
Just be glad you are not Canada– the oil price fall is hitting Alberta (one of the most expensive places in the world to produce oil- -the tar sands) hard, and the average Canadian consumer is highly indebted, so less likely to spend that surplus from falling gasoline and oil prices. Oh and did I mention they have a housing bubble in Toronto and Vancouver? ;-).
But they have an immigration policy that keeps bringing in new immigrants with lots of money to continue buying those properties, and innovate, with recent Canadian forecast now already improving in spite of their larger hit from oil.
What a crock of bs…
As Mosler points out, the money a net importer pays for imports does not disappear but is either saved by foreigners or is used to purchase US exports. Oil exporters are accordingly cutting spending and our exports are accordingly shrinking.
So when oil price falls sharply we get recession/investment losses in the oil patch, downturn in exporters, and some diffused extra spending nationwide by gasoline buyers mostly on domestic services e.g. Restaurants.