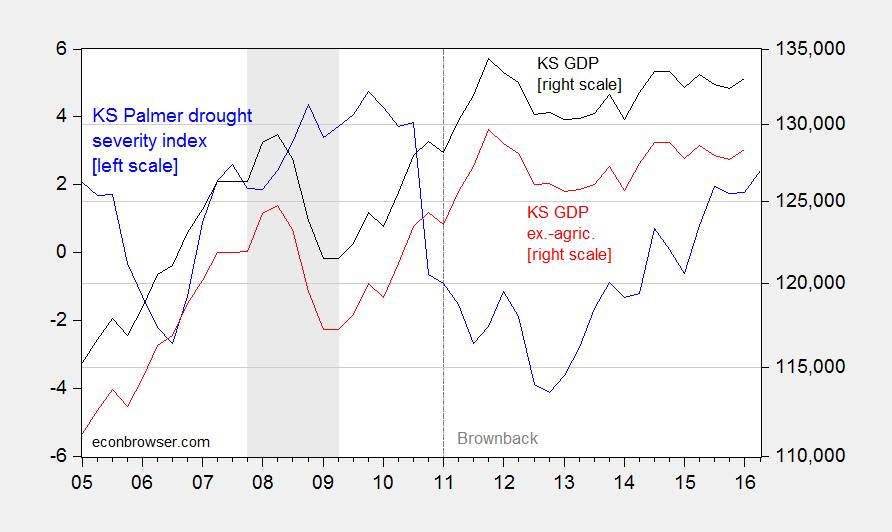
Ironman at Political Calculations asserts it does. Unfortunately, he makes a mistake in calculating Kansas GDP ex.-agriculture by simply subtracting chained agriculture from chained state GDP (discussed in the addendum to this post). Here in Figure 1 is properly calculated GDP ex.-agriculture plotted against a drought index (lower values is a more severe drought).
Figure 1: Palmer drought severity index (PDSI) for Kansas (blue, left scale), and Kansas GDP in millions of Ch.2009$, SAAR (black, right log scale), and ex.-agriculture (red, right log scale), calculated using Törnqvist approximation. NBER defined recession dates shaded gray. Lower values of PDSI indicate more severe drought. Source: BEA (2015Q4 first state GDP release), NOAA, and author’s calculations. Graph updated to include 2016Q1 state GDP data, 2nd release, 8/11, 9:10AM Pacific.
Note that the slowdown is apparent in GDP excluding agriculture, post-Brownback. Drought is not the explanation. And as shown in this post, a hit to durables from the downturn in aircraft cannot be the answer.
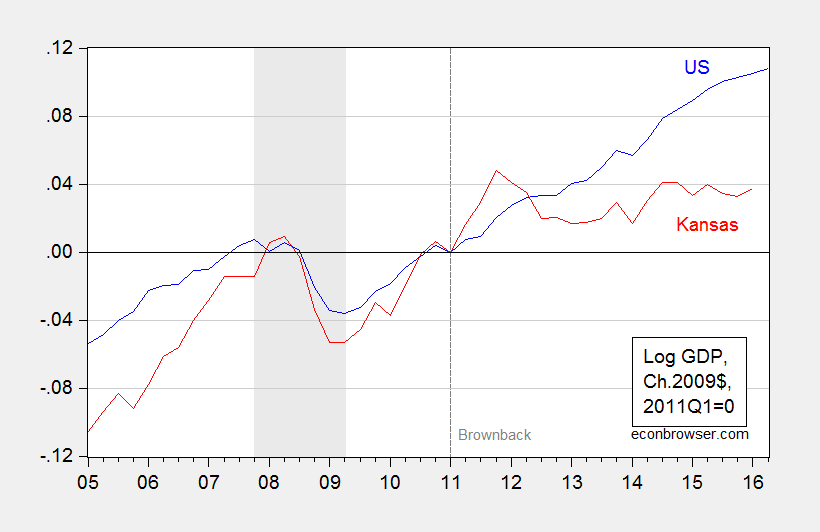
Update, 8/11 9:50AM Pacific: Here is an updated graph of Kansas economic performance relative to US.
Figure 2: Log US GDP (blue), and Kansas (red), all in Ch.2009$, 2011Q1=09. NBER defined recession dates shaded gray. Source: BEA, 2016Q2 advance release, BEA state 2016Q1 second release, NBER, and author’s calcuations.
Update, 8/11, 11:15AM Pacific: By the way, still waitin’ (CBPP) for the response to the “shot of adrenaline”.
Update, 8/12, 6:15PM Pacific: Ironman asserts:
The effects of extreme drought that year would also negatively impact the state’s non-durable goods manufacturing sector, as mills in the state would have less grain to process into flour, particularly in the quarters following the main harvest, which is also evident in the detailed state-level GDP data.
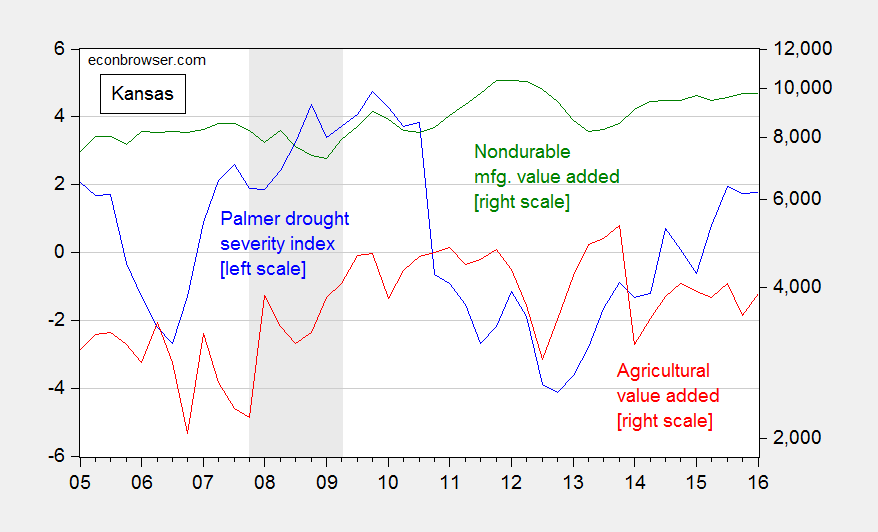
Here is a time series plot of the real agricultural and nondurable manufacturing value added series.
Figure 3: Palmer drought severity index (PDSI) for Kansas (blue, left scale), and Kansas agricultural value added (red, right log scale), and nondurable manufacturing (green, right log scale), in millions of Ch.2009$, SAAR. NBER defined recession dates shaded gray. Lower values of PDSI indicate more severe drought. Source: BEA (2015Q4 first state GDP release), NOAA, and author’s calculations.
Note that agricultural output declines even as the drought lessens, and overall nondurable manufacturing holds up pretty well throughout the drought.


Will Ironman become the new Florida Man?
For a moment I thought ‘Brownback’ was a new technical term. Drought… ‘brown’….
Oh, it, err he is the governor of the state of Kansas and he has implemented radical income tax cuts that are currently jeopardizing public education funding and has inspired 4 ex-governors to band together to form ‘Save Kansas’. He also figures among the least popular governors in the USA.
Strikes me as another fascinating exercise in political rent-seeking where time horizons differentiate political actors.
Carry on.
MMMMM??? Maybe the cut in education is a feature not a bug. Does Kansas export its educated that increase the output of other states? If so, maybe Kansas should shutdown its higher education system which is subsidizing the rest of America. One of my work study students was a Jayhawk. Nice kid. I helped him get his masters in engineering and he got a job with GE in Ohio.
It’s not drought. And it’s not planes. So what is it? What graphs like the ones above would you show to explain KS’ underperformance? There has to be some quantitative data that shows which sector(s) is pulling it down, whether it was caused by Brownback or not, right? Then the question, for which ever sector(s) it ends up being, is if there if a logical link between Brownback’s policies and the underperformance.. The same goes for WI.
Perhaps, a low unemployment rate with little growth means a shift from high wage jobs to low wage jobs or full time to part time jobs. A July 2016 article states:
“Kansas has seen dips in farm incomes (owing to consistently low crop prices and steep declines in cattle prices), a fall in commodity prices and exports, sluggish movement in oil and natural-gas markets, and declining manufacturing.”
Many retail jobs don’t pay much.
maybe supply side and austerity policies were stupid to pursue in the past 5 years.
Austere policies on high wage industries and small businesses is “stupid.”
However, it seems, in Kansas, there were job losses in high wage industries and job gains in low wage industries, mostly because of changing market conditions, although tax cuts for households and businesses can offset some of the income losses and raise demand.
“Austere policies on high wage industries and small businesses is “stupid.”
perhaps, but that is not what happened in kansas. kansas pursued stupid policies of austerity and supply side economics in the middle of an aggregate demand problem. it was stupid, and the outcome was predictable.
I think, Kansas has a balance budget requirement. Kansas has been suffering on the supply side with the loss of high wage jobs due to changing market conditions. And, it gained from the tax cuts, raising consumption in retail, food service, and hospitality industries, along with creating the low wage jobs in those industries.