The real return on long-term government bonds has dropped steadily over the last 30 years, falling from values around 4% to something closer to zero or even negative for many countries today. What accounts for this remarkable development, and what are the prospects for this situation to continue?
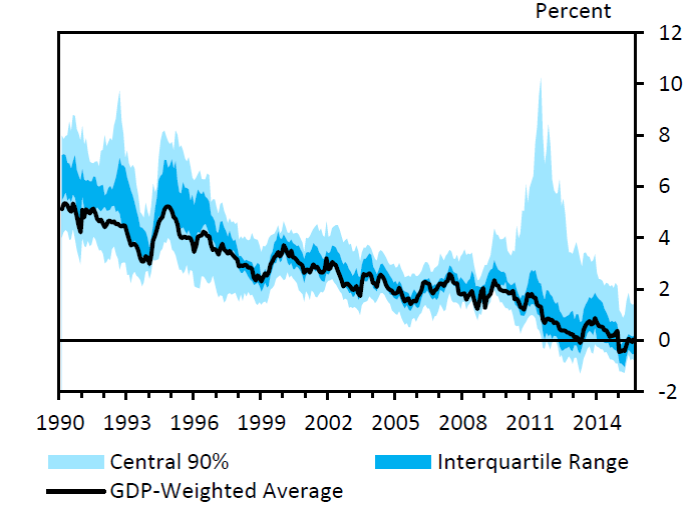
Range across advanced economies is estimated real yield on long-term government bonds. Source: Rachel and Smith (2015).
Bank of England economists Lukasz Rachel and Thomas Smith have a very interesting paper in which they propose answers to these questions. Their basic idea is to think of world capital markets as an integrated whole in which the world real interest rate is the value that equates global saving to global investment. Both saving and investment would be expected to grow with world GDP, so the authors describe these schedules relative to GDP. A fall in the real interest rate could result from a downward shift of one or both of these schedules.
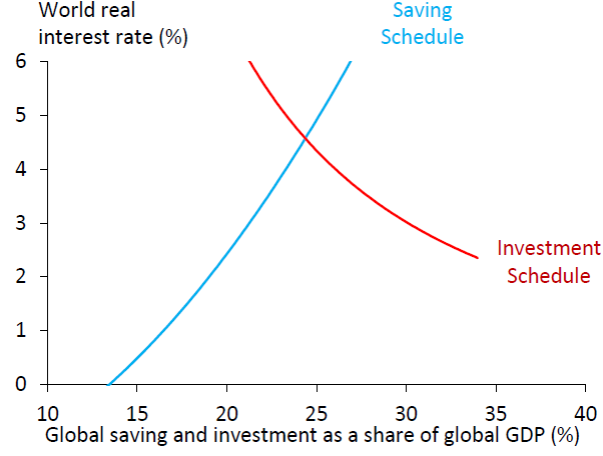
Vertical axis: world real interest rate. Horizontal axis: world investment or saving as a percent of world GDP. Source: Rachel and Smith (2015).
Demographic changes are one reason we might see a downward shift in the saving schedule. It is a very well-established observation across different countries and over time that people aged 30-60 tend to save a higher fraction of their income than do the very young or very old.
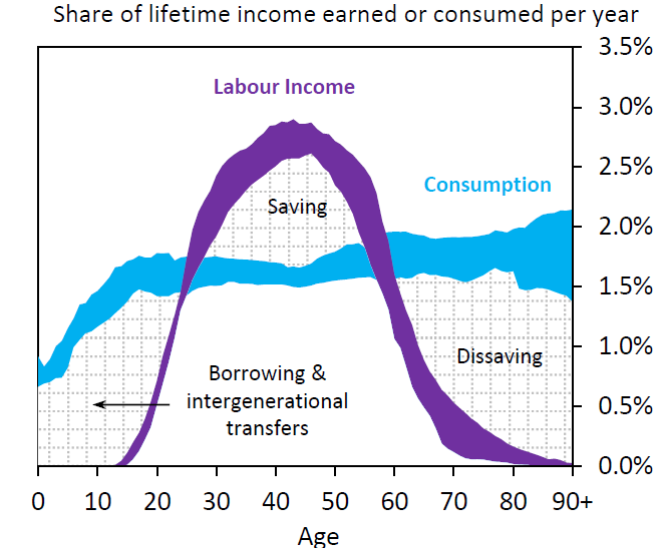
25th and 75th percentiles of the distribution across 23 advanced and emerging economics in percent of lifetime income earned each year (in purple) and percent of lifetime income consumed each year (in blue). Source: Rachel and Smith (2015).
We’ve seen a steady decrease worldwide in the fraction of the population under age 20 or over 65. Although the aging population is one well-known factor that would bring this fraction up, the fact that there are fewer young people dominates the ratio and explains why it has continued to fall. Given the observed relation between age and saving rates at the individual household level, Rachel and Smith calculate that this factor would result in a downward shift of the global savings schedule by about 90 basis points since 1980, though they acknowledge that there is substantial uncertainty about this and the other magnitudes estimated in the paper.
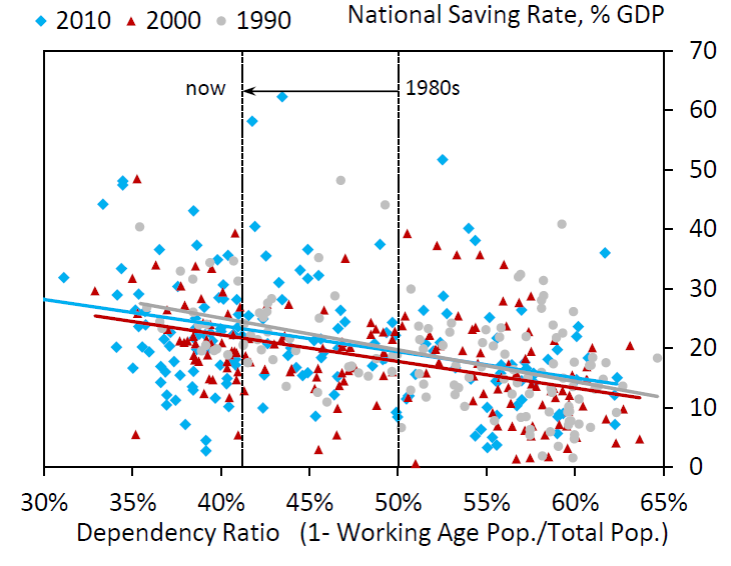
Gray circles represent average values for individual countries over 1990-1999 with saving as a percent of GDP on the vertical axis and the percentage of the population below 20 or over 65 on the horizontal axis. Red triangles are data 2000-2009 and blue diamonds the most recent data. Source: Rachel and Smith (2015).
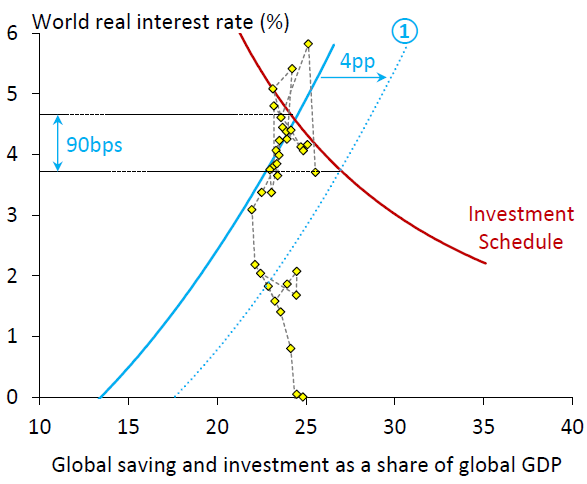
Change in global saving schedule predicted on the basis of changes in population age. Yellow diamonds correspond to observed values for saving rates and real interest rates for individual years. Source: Rachel and Smith (2015).
Another important change is growing income inequality. Anywhere in the world we observe that higher-income households spend a lower fraction of their income than poorer households. As the share of higher-income households has gone up, that would lead us to predict an additional 45-basis-point shift down in the world saving schedule.
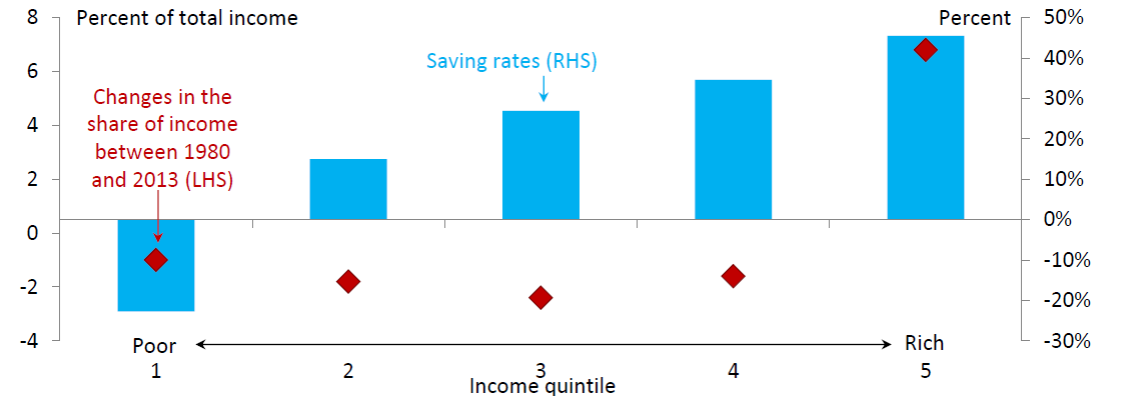
Blue rectangles: average saving rates (left axis) as a function of income quintile. Red diamonds: change in the share of income for that quintile between 1980 and 2013 (right axis). Source: Rachel and Smith (2015).
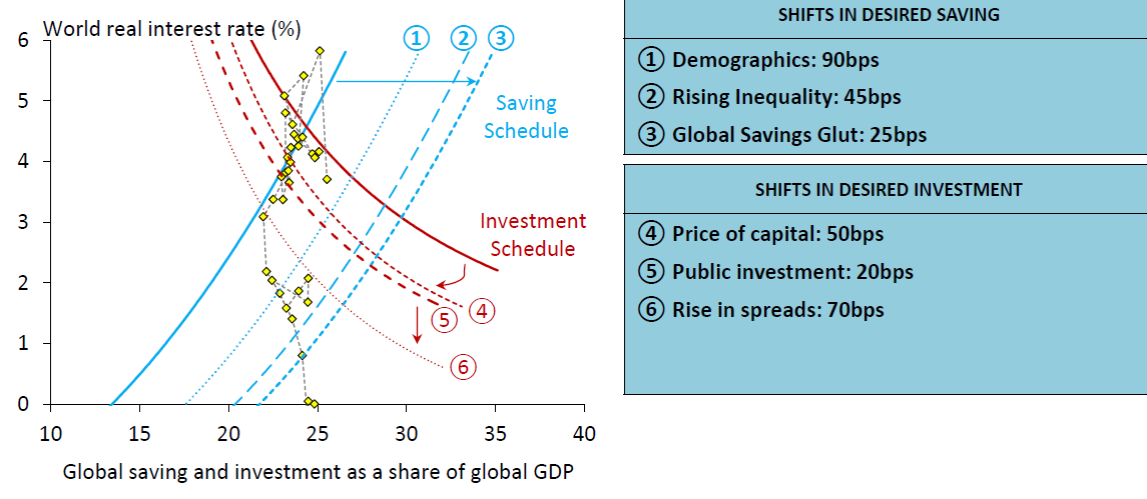
A final factor shifting the saving schedule down has been an apparent increase in desired savings rates on the part of emerging economies and the oil-producing countries, a development that Bernanke (2005) referred to as the “global saving glut”. Rachel and Smith estimate that this could have shifted the global saving schedule down an additional 25 basis points.
If the only changes had been these three developments bringing the saving schedule down, the result would be a movement down and to the right along a fixed investment schedule; interest rates would have dropped by less than 90 + 45 + 25 = 160 bp, and we would have seen an increase in global saving rates. The fact that the latter did not happen might then be attributed to separate factors shifting the investment schedule down. Rachel and Smith identify one of these factors to be a decrease in the relative price of investment goods. This allows firms to acquire productive capital with a lower fraction of GDP devoted to investment. The authors calculate that this might have shifted the investment schedule down by 50 basis points. In addition, there has been a decline in the fraction of world income devoted to public investment, which they think led to an additional 20-bp shift down in the investment schedule. Finally there has been an increased demand for government debt relative to productive capital, which has meant an additional 70-bp downward shift in the investment schedule as drawn here (with the real interest rate on government debt on the vertical axis). Putting all these factors together, Rachel and Smith can account for most of the decline in real yields in the face of little net increase in saving or investment.
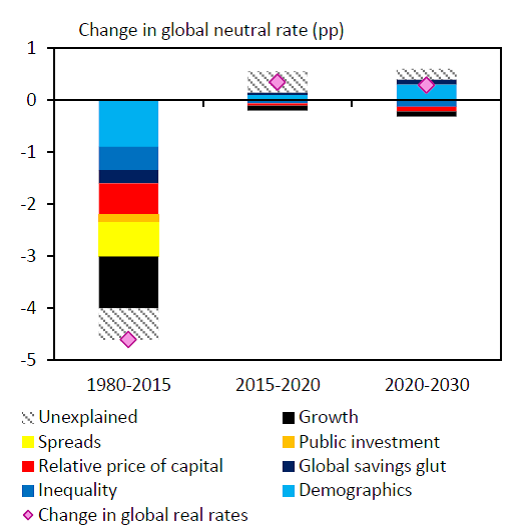
If this is the correct analysis, what does it imply for what we can expect in the future? The paper concludes:
most of these forces look set to persist and some may even build further. This suggests that the global neutral rate may remain low and perhaps settle at (or slightly below) 1% in the medium to long run. If true, this will have widespread implications for policymakers– not least in how to manage the business cycle if monetary policy is frequently constrained by the zero lower bound.
This is just a visceral reaction: with government debt skyrocketing (almost doubling under the Obama administration), it would certainly seem advantageous to governments to have interest rates at near zero. This greatly reduces the debt servicing costs compared with nominal 4% rates. It just seems like a fixed game that is designed to siphon money from savers. As long as governments continue to fund more and more social programs without actual revenue, the incentive to keep interest rates at zero or negative seems intuitive… but I can’t prove it.
But under Obama the deficit as a share of GDP fell from 10% to almost 2%.
That is the way you need to look at it and how the analysis in this blog looked at it.
Your basic premise is incorrect.
Bruce,
Your gut is hinting at the implicit 3rd mandate of the US federal reserve: keep the US federal government afloat.
The irony here is that if Congress had approved Obama’s infrastructure investment plans, the deficit/debt situation would have been ‘worse’ (sic).
“It just seems like a fixed game that is designed to siphon money from savers.”
or maybe you actually have to work for your money? low interest does not take away savings, it just makes it difficult to profit from savings. savers are not entitled to 6% interest risk free. it is almost as if there is a class of folks who feel entitled to guaranteed earnings off of their savings.
Zero rates assumes that the worlds resources will last forever at an infinite rate of consumption. Phhht!
Savings are about somebody going without the product of those resources for a while to allow someone else to consume or invest. In a more or less sustainable the price of savings should be what it takes to persuade someone to go without for a time. At the moment the policy is to just consume at a faster and faster rate…Nobody is allowed to save! Everybody must consume more and more. Screw those who are to come who will stand on our shoulders. What will be left for them?
zero rates mean there are not many good opportunities to invest for future returns. you fail to acknowledge we simply have too much savings relative to investment opportunities-or at least risk free investment opportunities. savers can invest in riskier options, but they are choosing not to do so. and they are not consuming more-they are simply getting what they deserve from risk free investments-zero return. again, why do we have so many, mostly boomers, who feel entitled to high rates of return for risk free investment? too coddled.
“This suggests that the global neutral rate may remain low and perhaps settle at (or slightly below) 1% in the medium to long run. If true, this will have widespread implications for policymakers– not least in how to manage the business cycle if monetary policy is frequently constrained by the zero lower bound.”
Gee, if only there were some way to increase the nominal interest rate to provide breathing space above the zero lower bound, but alas, the gods have proclaimed that the inflation rate must remain below 2% or the skies will fall.
A lot of Americans borrowed for a college education. Then, when they graduated, they ended up working at Starbucks or another low paying job. They’re paying back student loans and cannot buy a house. The homeownership rate continues to decline and hit a 50 year low this year.
China consumption is 35% of GDP. It’ll eventually rise to 60%, like Japan.
In the 1970s, when interest rates were high, it was caused by more than oil supply shocks. The Baby-Boomers had yet to enter “prime-age.” It was before the huge wave of low-skilled legal and illegal immigration. Union power was near its peak. Real wages seemed high and only one breadwinner seemed to be enough for each family household, although labor standards were lower. The quality of output seemed to decline, e.g. in automobile manufacturing. The U.S. was a closed economy with much less and balanced international trading. The costs of education and health care were lower. Of course, the country was much poorer in the 1970s compared to today. I think, we need to slow immigration substantially and find other ways to raise real wages, along with lowering compensation costs.
It looks richer because it has been able to use printed bits of paper (figuratively) to pay for all the extra goodies. They have a CAD running at 600B a year which they are able, so far, to pay for by printing up whatever they need.
The economics fraternity seem to be totally complicit in what essentially amounts to a con.
When I look at the first scatter plot of savings rates and then at the breakdown by years, I see data contaminated by reality, that has little power to predict why the results occur versus reflecting them. I think the idea that there is a unitary whole a somewhat absurd simplification given the data then plots individual countries and for a few reasons: when did it become such a whole? How much of a whole was it at the beginning of the data? And at a higher level, it says to me that it implies a directionality to the effect, a sign, derived from both the concept and any number of adjustments needed to make the idea sensible across the data time frame. With not very big adjustments, one could say there was an increase Odis one basis points.
“The ministers, gathering here for their monthly get-together, had hoped to move closer to agreeing upon a set of overhauls Greece must enact under its bailout, which could reach €86 billion, as well as a series of debt-relief measures from its European creditors. ”
http://www.wsj.com/articles/eurozone-finance-ministers-try-to-lure-imf-back-into-greece-bailout-1480954340
And from my plan from Feb. 2015:
“Under the scenario presented above, the amount of debt forgiven is €88 bn to 2040, equaling about one quarter of the Official Debt and around €3 bn per year. The Official Debt, under this plan, is discharged fully in 2040.”
http://www.wsj.com/articles/eurozone-finance-ministers-try-to-lure-imf-back-into-greece-bailout-1480954340
If you align the incentives, fixing Greece–or Portugal or Italy–is a piece of cake. On the other hand, if economists steadfastly refuse to acknowledge the central role of incentives, fixing any of these countries is close to impossible.
It can go on as long as the USD is accepted as the world reserve currency.
The article, in measuring and relying on the saving vs investment metric, assumes the US can continue to pump and extra 600B to a Trillion into the markets forever without any change. At the moment the Euro is pumping some E600 B, surplus to European requirement, annually into the world economy. So of course as long as there is a Trill or two being pumped into the world economy every year your savings vs investment metric is going top look as if you have a surplus of saving. It can go on as long as the USD, and to an extent the Euro, is accepted as the world reserve currency. There is developing across other important economies to have the USD knocked off its perch. It may take a while but with current policies that is inevitable. If/when it comes it will be quick.
Meanwhile the idiocy of negative RAT rates will go on with the aim of consuming more and more and more…..of the world’s resources as quickly as possible. Great policy!
“Finally there has been an increased demand for government debt relative to productive capital, which has meant an additional 70-bp downward shift in the investment schedule as drawn here (with the real interest rate on government debt on the vertical axis).”
Wait, the demand for government debt is the savings supply of loanable funds to the government bond market, not the investment demand for loanable funds. So, the increase in relative demand for government debt should shift the savings curve for private borrowing up and to the left, and the savings curve for government borrowing (the blue curve in the last diagram) down and to the right. So, this factor helps explain lower interest rates on an increasing quantity of government bonds, but it works against explaining low rates on private bonds. The latter is more interesting imho than the former, as the lowest rate for private investment should be constrained by the (risk-adjusted) marginal revenue productivity of physical capital divided by its purchase price, whereas government borrowing is limited (somewhat) only by the zero lower bound on nominal interest rates.
I haven’t done the formal empirical analysis, but I am under the impression that the real interest rate for private sector borrowing has been near or even below zero for some time. In equilibrium, the real interest rate should equal the marginal revenue product of capital per dollar of real capital purchased, minus an adjustment for the risk taken by the capital purchaser. Is the marginal productivity of capital worldwide really less than zero? I think not. [Incidentally, the decline in price of investment goods should only have increased the demand for them (and hence private investment demand for loanable funds) – unless you believe that the quantity of investment goods desired by the private sector is constrained for some reason.]
The puzzling thing to me is how the real interest rate for private investment can be at or below zero for an extended period without triggering an investment boom. Sure, competition from government bonds should depress this rate, but again, if the private rate is too low then you should get an investment boom (perhaps appearing as another housing bubble). Perhaps a post-2008 increase in the perceived riskiness of new physical capital investment?
Strat: The variable on the vertical axis is the real interest rate on long-term government debt. The variable on the horizontal axis for the investment schedule is the flow demand for investment goods as a percent of GDP. The latter depends on the real cost of corporate borrowing, which is the real cost of government debt plus the premium on corporate debt relative to government debt. When that premium goes up, it means for any given interest rate on government debt, the cost of corporate borrowing associated with that interest rate is higher, which translates into a downward shift of the investment demand schedule.