Today we are pleased to present a guest contribution by Yi Zhang, Ph.D. candidate at the University of Wisconsin-Madison. This post draws upon this paper.
Until the advent of the 2008 global financial crisis, the Federal funds rate was the Fed’s main policy instrument. Thereafter, with the Fed funds rate at the zero lower bound (ZLB), effective use of the policy rate was highly circumscribed.
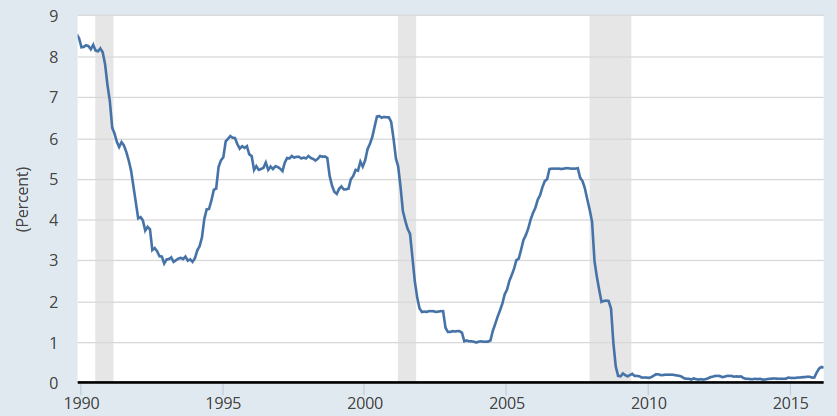
Figure 1: Effective Fed funds rate. Source: Board of Governors of the Federal Reserve System, retrieved from FRED, Federal Reserve Bank of St. Louis, https://research.stlouisfed.org/fred2/series/FEDFUNDS.
As a result, the Federal Reserve turned to unconventional monetary policy measures; i.e., large-scale asset purchases (LSAP) — also commonly called quantitative easing (QE). With these new policy tools, two questions arise naturally: First, how can we summarize the overall stance of unconventional monetary policy? Second, how can we measure the impact of unconventional monetary policy on the macroeconomy?
Conventional Approaches
A very popular method to summarize unconventional monetary policy is to estimate a shadow rate (usually using a term structure model), where the shadow rate is allowed to be negative. See, for example, Krippner (2012, 2013), Bauer and Rudebusch (2013,forthcoming), Lombardi and Zhu (2014), Christensen and Rudebusch (2015, 2016), and Wu and Xia (2016); the shadow rate from this last study is depicted in Figure 2.
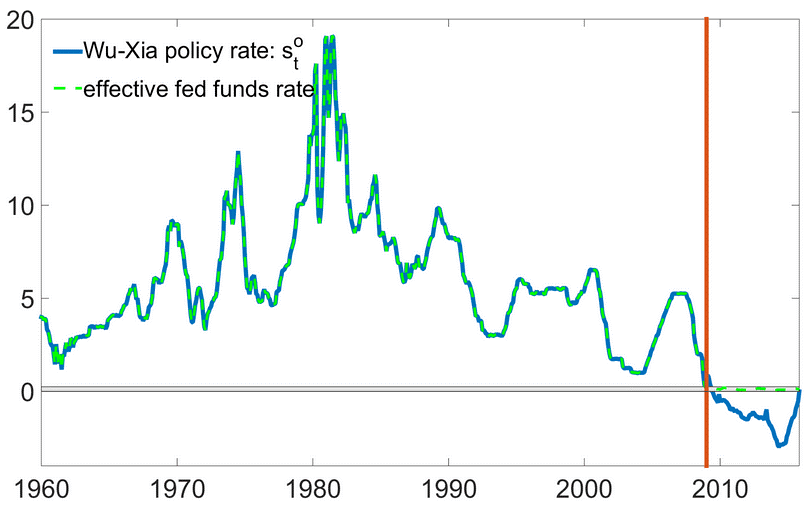
Figure 2: Green line: effective federal funds rate. Blue line: policy rate constructed by splicing the effective federal funds rate before January 2009 with Wu and Xia (2016)’s shadow rate since January 2009.
This paper shows that unconventional monetary policy manipulates the entire yield curve, rather than merely the short end. However, the shadow rate, by extracting only the short end, omits the rest of the information contained in the term structure, which as a whole, has a profound impact on the economy. Hence the shadow rate is not a sufficiently informative measure of unconventional monetary policy. I provide two supportive pieces of evidence:
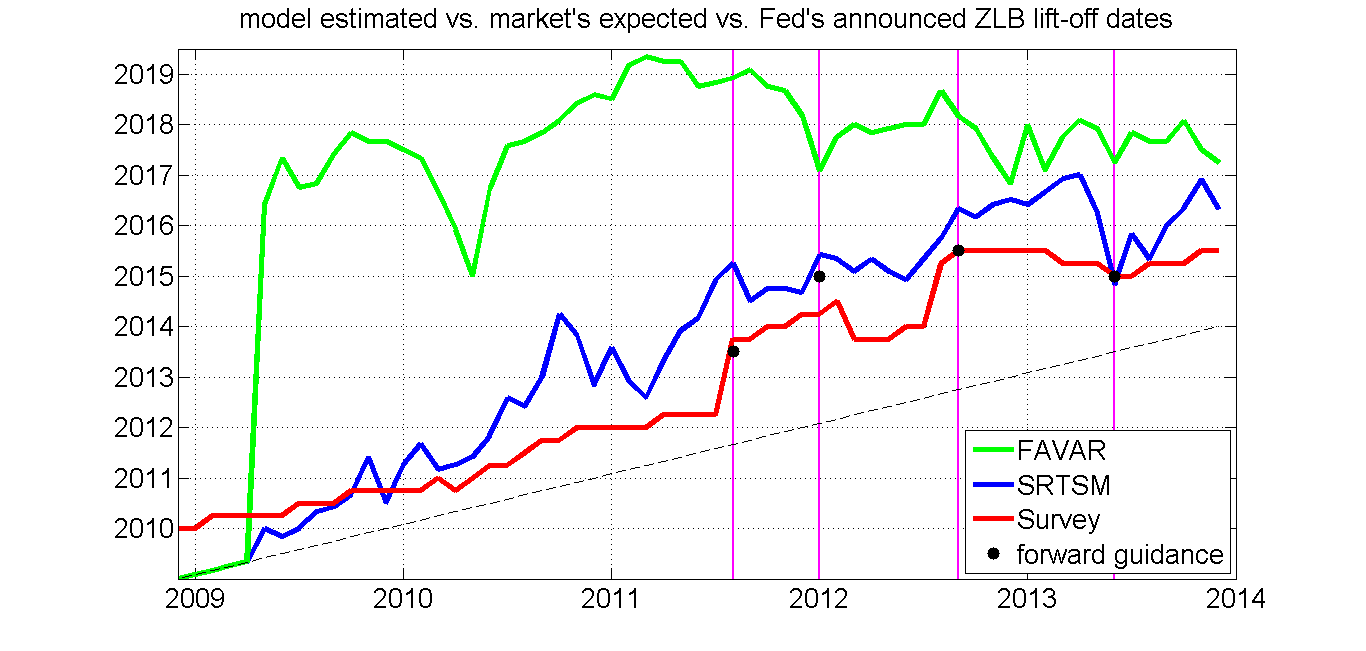
- The term structure model from which we extract the shadow rate can forecast a series of expected lift-off dates quite similar to the dates inferred from survey data; in contrast a standard Factor-Augmented Vector Auto-Regression (FAVAR) model that uses the very same shadow rate as the sole policy measure fails to forecast similar expected lift-off dates. This is shown in Figure 3.

Figure 3: Green line: the expected lift-off date series predicted by the traditional FAVAR model from January 2009 to December 2013. Blue line: the expected lift-off date series predicted by the shadow rate term structure model. Red line: the survey data series on expected lift-off date by Blue Chip Financial Forecast and the New York Fed’s Primary Dealer Survey. Four purple vertical lines mark the following months when forward guidance specified explicit lift-off dates for the ZLB: August 2011, January 2012, September 2012 and June 2013. The corresponding lift-off dates are in black dots. Black dashed line: the 45 degree line.The FAVAR estimates (in green) are highly implausible. For example, it is hard to believe that in 2009 any market participant anticipated that the ZLB period would last until late 2017, or that in early 2011 anyone ever anticipated the ZLB period would last until 2019. Such a dramatic contrast between the survey-based lift-off dates and those predicted by the FAVAR model demonstrates that forward guidance contains large amounts of information that the traditional FAVAR model (and the shadow rate) fail to capture.
- A standard FAVAR model that uses the shadow rate as the only policy measure delivers counterintuitive estimates of the macroeconomic effect of unconventional monetary policy.
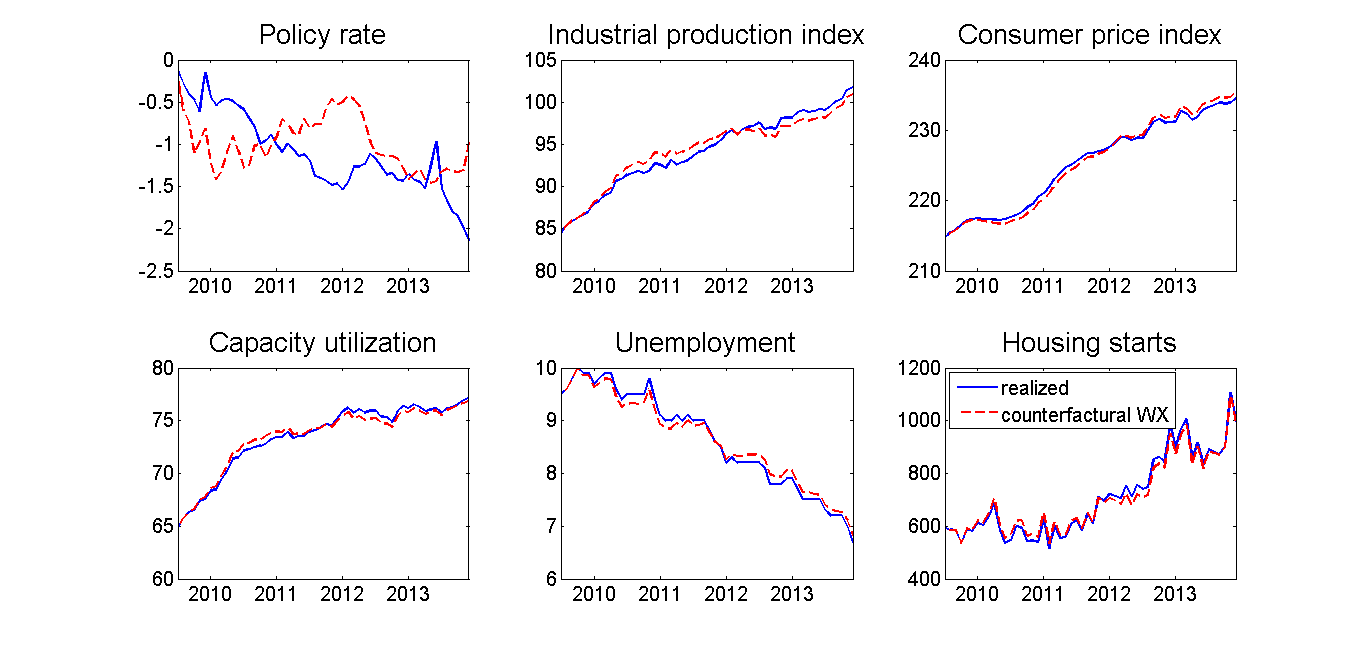
To measure the effects of unconventional monetary policy, an intervention analysis is conducted — i.e., a counterfactual analysis that simulates the paths of major economic variables if unconventional monetary policy innovations were “shut off”.1
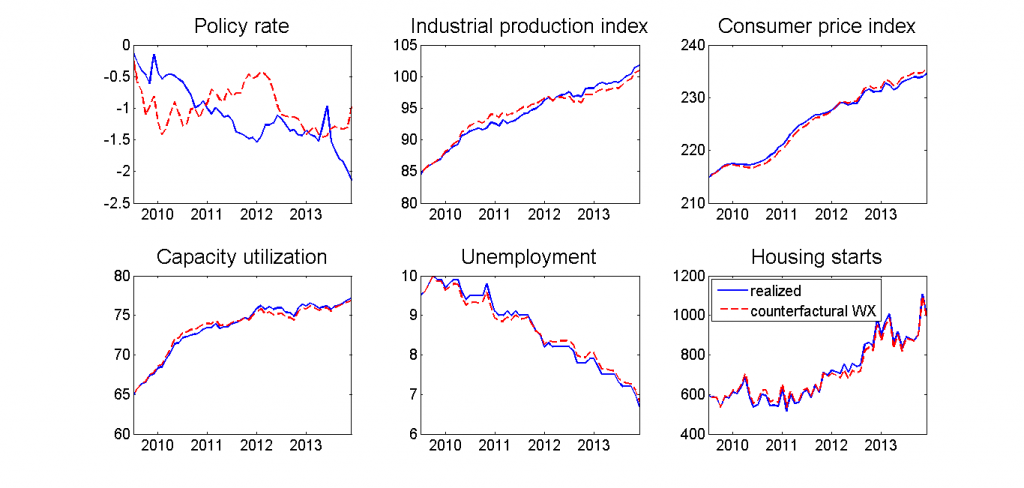
Figure 4: Blue lines: observed economic variables between July 2009 and December 2013, the policy rate is constructed from Wu and Xia (2016)’s term structure model. Red dashed lines: what would have happened to these macroeconomic variables, if all the monetary policy shocks were shut down.The above graph highlights two counterintuitive results:
- The constructed policy rate (blue solid line) is higher than the counterfactual policy rate (red dashed line) until early 2011, indicating that the Fed had adopted a contractionary policy until early 2011. This result contradicts our knowledge that the Fed was attempting to conduct expansionary monetary policy within this period. Indeed, the first round of quantitative easing (QE1) started from November 2008 to March 2010, and QE2 started from November 2010 to June 2011. By early 2011, QE2 is still under way.
- Unconventional monetary policy has a negligible effect on the macroeconomy. This conclusion is in stark contrast to the extant literature, which has found noticeable macroeconomic effects of the LSAP.
A Better Approach
To more accurately trace out unconventional monetary policy innovations and measure their corresponding macroeconomic impact, I introduce in addition to the shadow rate forward guidance information contained in survey data on expected lift-off dates; the latter is used as a proxy for omitted term structure information. I also develop a forward-guidance-corrected FAVAR (FGC-FAVAR) model to incorporate this forward guidance information.
After controlling for expectations about lift-off, I am able to decompose the (biased) FAVAR model monetary policy innovation into two components: (i) a forward guidance term that measures the information given out by period-t forward guidance, known at period t, and (ii) the model innovation that is estimated by the FGC-FAVAR model; these two components are on the right hand side of the below equation, and depicted graphically in Figure 5.
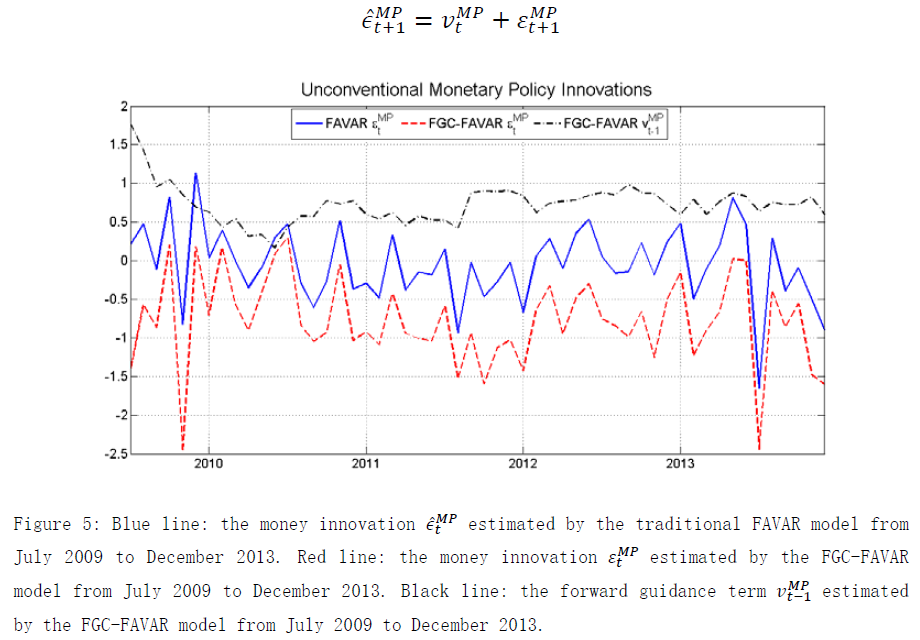
This decomposition shows that the standard FAVAR model confounds the period-t forward guidance information with the policy shock, and hence severely underestimates the aggressiveness of unconventional monetary policy in the post-crisis period. My analysis also indicates a status quo of U.S. unconventional monetary policy: On one hand, for a long time, the market continues to believe that lift-off is just around the corner (within a year or so). On the other hand, the Fed tries to convince the market that the Fed has shifted to a more accommodative policy approach and the expected ZLB duration would be longer than the market expects. To convince the market, the Fed surprises the market month after month (contemporaneous money shocks). After the market finds that the contemporaneous money shock is more dovish than it expected, the market would then slowly defer its expected lift-off date.
Then I measure the effect of unconventional monetary policy in the FGC-FAVAR model by simulating the paths of major economic variables if unconventional monetary policy innovations were shut off, as shown in Figure 6.
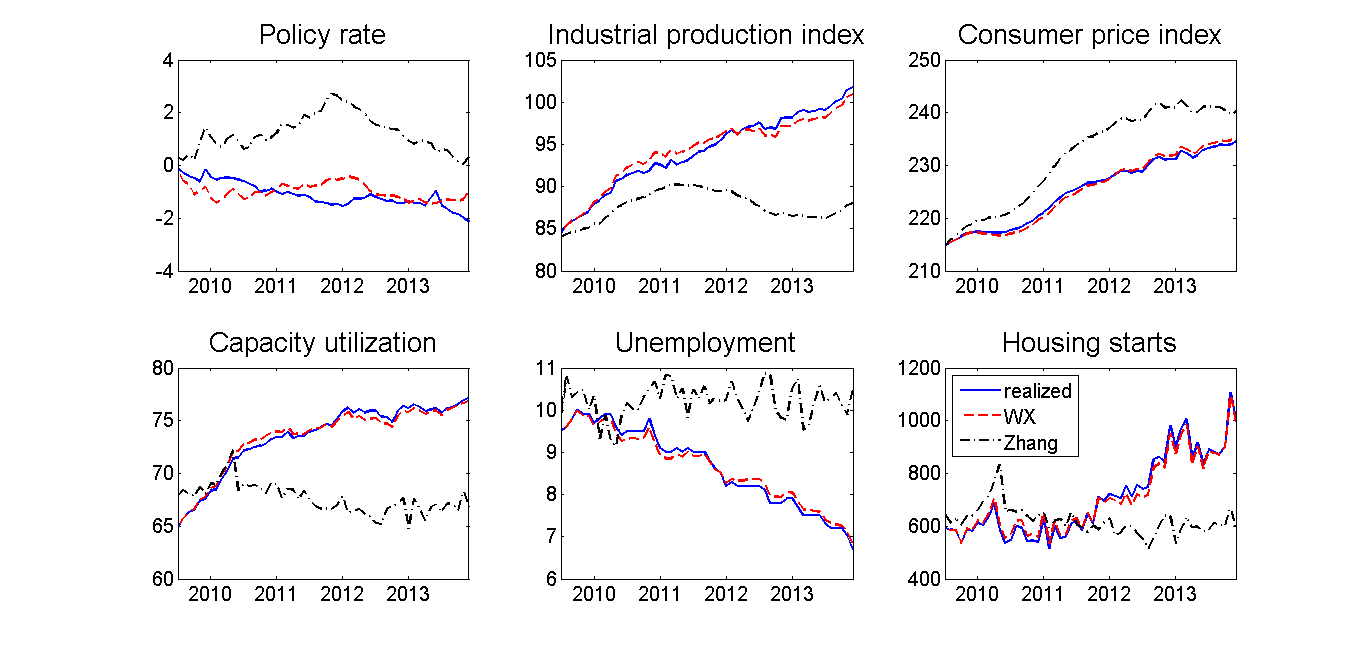
Figure 6: Blue lines: observed economic variables between July 2009 and December 2013, the policy rate is constructed from Wu and Xia (2016)’s term structure model. Red lines: FAVAR model’s intervention analysis if all the monetary policy shocks were shut down. Black lines: FGC-FAVAR model’s intervention analysis if all the monetary policy shocks were shut down.
The counterintuitive estimated effects found in a standard FAVAR model disappears in my FGC-FAVAR model. In particular, the constructed policy rate is always lower than the counterfactual policy rate (black dashed line), indicating that the Fed was implementing an expansionary policy during this period.
Conclusion
The efforts by the Federal Reserve to stimulate the economy since July 2009 succeeded in reducing the unemployment rate in December 2013 by 3.8 percentage points and elevating real output (as measured by industrial production) by 15.6%. These effects are noticeably larger than the estimates reported in the literature.
Endnote
1. Since we are using Wu and Xia (2016)’s data and the standard FAVAR model, this graph is merely a replication of Wu and Xia (2016).↩
This post is written by Yi Zhang.
Please include the references cited in the text at the end of the post.
Shawkat Hammoudeh: The referenced articles are hyperlinked to, in lieu of a reference list.
Yi Zhang You probably got asked this question in some thesis defense grilling, but do you know if the results are robust to other economies that tried some version of QE; e.g., Japan or the Bank of England?