Civilian employment and nonfarm payroll employment both decline.
Here is Wisconsin NFP employment compared to Minnesota and the US.
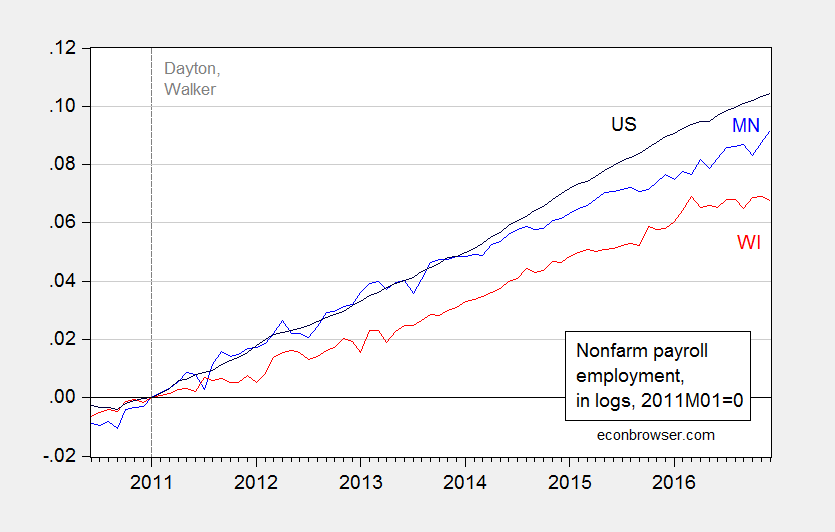
Figure 1: Minnesota nonfarm payroll employment (blue), Wisconsin (red), US (black), all seasonally adjusted, in logs 2011M01=0. Source: BLS, MN DEED, WI DWD, author’s calculations.
Here is what the DWD press release notes about the establishment data:
Based on preliminary data, the state added a statistically significant 28,700 total nonfarm jobs and 28,900 private-sector jobs from December 2015 to December 2016, with a one-month gain of 900 private-sector jobs and significant one-month gains of 3,000 in Manufacturing and 2,700 in Construction.
The unemployment rate in Minnesota is 3.8%, In Wisconsin, it’s 4.1%.
In my lovely home state of New Jersey (motto: “Come to the Fiscal Death Spiral State”), it’s 5.0%; NY is 5.1%, CA is 5.3%.
Unemployment rates:
MI: 3.8%
WI: 4.1%
NJ: 5.0%
NY: 5.1%
CA: 5.3%
Nov. 16
Well, looks like the slow learners are needing yet another one of Menzie’s posts on fixed effects. Ugh.
So from the DWD press release : http://www.dwd.wi.gov/dwd/newsreleases/2016/unemployment/170119_december_state.pdf
I find this: there were 3,137,200 people in the civilian labor force in Nov 16 (seasonally adjusted numbers) and there were 3,009,900 employed. While in Dec 16 there were 3,132,900 people in the labor force and 3,007,900 employed. So there were 4,300 fewer people in labor force and 2,000 fewer employed.
And we get the following tweet from Gov. Walker: “Unemployment rate in WI lowest in 16 years plus great new revenue numbers for state = future’s so bright ”
Those numbers might indicate to me that there are fewer jobs in the state and a potential cause for concern.
4K out of 3 million is not enough to be statistically significant.