The way in which the Federal Reserve controls the short-term interest rate today is completely different from the way things worked ten years ago. I was looking for a good description of how the current system works and couldn’t find one, so decided to write my own.
Ultimately a central bank’s ability to control the interest rate comes from its power to credit banks with new deposits held in their accounts with the central bank. It’s easiest to understand how that power gives the central bank effective control over the interest rate on short-term loans between banks by starting with the current system used by many central banks outside the United States, such as the European Central Bank.
At each meeting the ECB sets two key interest rates. The first is a rate at which it offers to make short-term loans to banks. The ECB can lend as much as it wants because to extend a new loan, the ECB simply credits the bank with new funds in the bank’s account with the ECB. An offer by the ECB to lend as much as banks want at a fixed rate puts a ceiling on the interest rate on short-term loans between banks. Why should I pay 2% interest to borrow from another bank when I could borrow from the ECB for only 1.5%? The second interest rate that the ECB chooses is the interest rate it pays to banks on funds left in their account with the ECB overnight. This essentially put a floor on the interest rates on loans between banks. Why should I lend to another bank for 0.5% if I could get 1% by just leaving my funds with the ECB? If the ECB sets a lending rate of 1.5% and a deposit rate of 1%, short-term loans between banks should take place at a rate somewhere between the 1.5% ceiling and 1% floor.
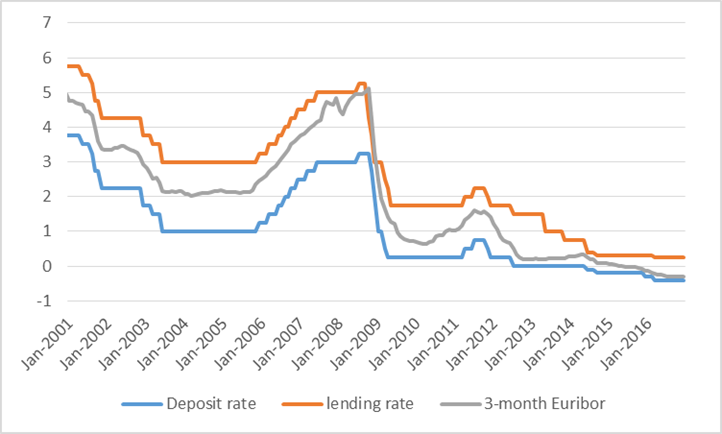
Average interest rate over the month on 3-month interbank loans (in gray) and end-of-month values for ECB deposit rate (in blue) and lending rate (in orange), January 2001 to December 2016.
Since June of 2014, the ECB wanted to bring interest rates into negative territory. It did so by charging a fee instead of paying interest on deposits with the ECB. Today European banks are willing to pay the borrower for the privilege of being able to make a loan, because by passing the ECB deposits along to someone else they could avoid the charge from the ECB (more details here). If you weren’t paying attention to the units on the vertical axis, you’d think the system is functioning just as it always did, with the equilibrium interest rate on loans between banks falling between the ceiling and a now-negative floor.
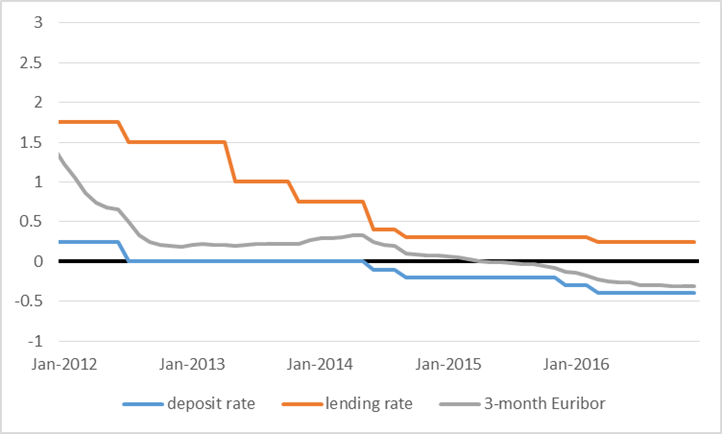
Average interest rate over the month on 3-month interbank loans (in gray) and end-of-month values for ECB deposit rate (in blue) and lending rate (in orange), January 2012 to December 2016.
In the new regime of U.S. rate hikes beginning in December 2015, the Federal Reserve at each meeting has also been announcing two key policy rates. One is an interest rate that the Fed will pay a bank for excess funds left overnight in the bank’s account with the Fed. Since March 16 that number has been 1% at an annual rate. The second policy rate is an interest rate that the Fed will pay on reverse repo operations. These are essentially collateralized overnight loans from financial institutions to the Fed– see this discussion for more details. The reverse repo rate has been 0.75% since March 16. The effective fed funds rate, a volume-weighted average of brokered overnight loans of Fed deposits between financial institutions, is currently at 91 basis points, in between the reverse repo rate and the interest rate on reserves.
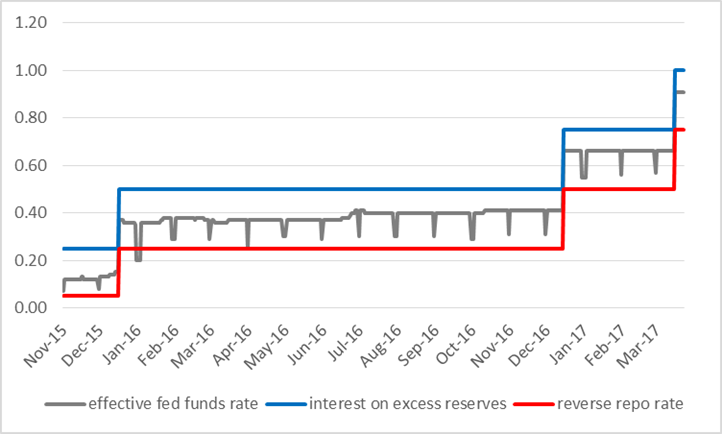
Daily interest rate (quoted at an annual rate) paid by Fed on excess reserves (in blue) and on reverse repos (in red) along with daily effective fed funds rate (in gray), Nov 1, 2015 to March 23, 2017.
The last graph looks similar to the ECB system, but there’s a profound difference. The blue line in all three figures is the interest paid by the central bank (either the ECB or the Fed) on deposits left overnight with the central bank. But whereas this functions as a floor in the European system, it appears to be the ceiling in the U.S.! Returning to the logic of the European system, why would a bank lend to another bank for 91 basis points when it can earn 100 just by leaving the funds in its account with the Fed?
The answer is, for the most part they don’t. Most of the institutions lending fed funds today are not private banks, but are instead government-sponsored enterprises (GSEs) such as the federal home loan banks. The GSEs have accounts with the Fed but don’t earn interest on their reserves. The GSEs can lend those funds to other financial institutions over the fed funds market, or they can lend those funds to the Fed through the Fed’s reverse repo operations. For this reason, the 75 bp reverse repo rate, not the 100 bp rate for interest on reserves, functions as the effective floor for the fed funds rate in the current U.S. system.
But isn’t there a money-making arbitrage opportunity here for private banks to borrow from the GSEs at 91 bp and earn 100 bp by holding those funds overnight in their account with the Fed? It turns out this isn’t the golden deal it might appear to be as a result of some regulatory details. One is that the Federal Deposit Insurance Corporation assesses banks a fee based on their total assets (which include deposits in the banks’ accounts with the Fed). If a bank borrows from a GSE and holds the funds as Fed deposits, it will have to pay more to the FDIC. A recent study by Fed economists Ayelen Banegas and Manjola Tase found those fees averaged about 11 basis points in 2011 and 7 basis points in 2014. So a private U.S. bank can’t make money borrowing fed funds from a GSE unless it can get them for about 90 basis points.
What about foreign banks, some of which also hold U.S. Federal Reserve deposits and could earn the full 100 basis points, but don’t have to pay the FDIC fee? They have been playing an increasing role in borrowing from GSEs on the U.S. fed funds market. But their ability to arbitrage turns out to be limited by other regulatory constraints such as Basel III. If a foreign bank borrows more fed funds, its calculated risk-exposure may increase, forcing it to adopt other costly measures to stay within capital or liquidity requirements. So they too aren’t interested in borrowing fed funds from the GSEs unless they can get them at a discount from the 1% interest on reserves.
An interesting detail is that whether a bank satisfies the Basel requirements is based on its balance sheet as of the last day of the month. The result is that the willingness to try to arbitrage the fed-funds interest-on-reserves differential is far lower on the last day of the month than it is on every other day of the month. Banegas and Tase found that foreign banking organizations borrow 40% less fed funds on the last day of the month than other days. This is why the effective fed funds rate drops precipitously on those days, getting much closer to the effective floor posed by the reverse repo rate.
How the Federal Reserve controls the fed funds rate today is thus a fairly complicated story. And I guess that’s why it’s hard to find (or write) a simple description of exactly how it works.
Doesn’t a negative ECB rate more than 2 years running signal monetary failure there?
I would say this version is a bit incomplete.
The feds major effort is the 2.4 Trillion in treasuries. Treat that as a loan to a member banks and it is backed by excess reserves and you have the European and Canadian system exactly. In fact, you have standard currency banking exactly. Loan to deposit flow is a circulation of floated funds used for price discovery.
It is not obvious, because it is masked by the siegniorage flow. It seem odd because the one member bank doing all the borrowing is bankrupt and the 30 of the member banks with deposits are betting the bankruptcy.
“An interesting detail is that whether a bank satisfies the Basel requirements is based on its balance sheet as of the last day of the month.”
Seems that a better rule would be to have the Basel requirements based on a running 30-day average balance instead of the last day of the month.
A useful summary. One might note that since 2014, the effective federal funds rate is a volume-weighted median instead of mean, an interest. Also, in a further post, perhaps you could discuss why the Fed is also publishing the overnight bank funding rate (OBFR) in addition to the EFFR.
Yes.
But who’s counting?
The Journal of Economic Perspectives ran an essay on the Fed’s new methods for monetary control, in just the past two years.
Some Federal Reserve economists published a paper on this more than one year ago. See “Rewriting Monetary Policy 101: What’s the Fed’s Preferred Post-Crisis Approach to Raising Interest Rates?” by Ihrig, Meade, and Weinbach, in the Journal of Economic Perspectives, Fall 2015. A working paper version is posted on the Fed’s website at this link: https://www.federalreserve.gov/econresdata/feds/2015/files/2015047pap.pdf
This article (which is also the JEP piece cited by BB above) is very helpful. It has been used in rewrites of some Money and Banking undergraduate textbooks, and it has been used at as a reading assignment at some colleges, such as Swarthmore.
Great write up. Here are my thoughts and a write up I did about some risks to the QE program. I saw Dallas Fed’s Kaplan last week in Chicago and he did not know what the Fed would do in response….
As a consequence of the QE program, currently there are about $2.5 trillion in excess reserves. These reserves are from the printed dollars that the Fed exchanged for securities that the banks held. It was the intention inflate asset prices while also giving banks money meant to be lent out after ensuring their solvency. However, they have not lent like was intended because today the Fed funds rate = .75 – 1.00 (currently bid at .91%) < The rate on required reserves and excess reserves = 1.00%. The fed funds rate is below the rate on reserves because of market forces due to the fact that GSE’s do not participate directly with reserve deposits at the Fed and that US subsidiaries of foreign-owned banks are not subjected to the FDIC fee and operate with a different formula than US banks. Simply, why would a US bank holding excess reserves lend to another institution at a rate of .91% when they can receive 1.00% from the government?
When the fed raises interest rates, as they are now, they move both the upper and lower bound up. The upper bound is the interest rate on excess reserves (IOER) and the lower bound is the overnight reverse repo rate (ON RRP). The IOER is paid on the amount of excess reserves, as well as required reserves, while the ON RRP is currently paid on a maximum of $300 Billion and the limit can be expanded if it becomes necessary to maintain the floor.
These two interest rates paid comes from the US Treasury who in turn taxes the US citizen. So it is the US citizen who is ultimately on the hook for Federal Reserve’s QE program.
Currently this is not a problem because of the profitability of the QE program thus far. The profitability of QE comes from the way most banks makes money: from the spread between the return on its assets and the interest paid on its liabilities. The Fed’s liabilities are principally made up of currency in circulation, which pays no interest, and reserves mentioned above, the cash that commercial banks keep on deposit at the Fed. The difference between these small cost liabilities and the average return of about 3.5% on its bond holdings explains the whopping “seigniorage”, or what the profit the Fed earns from printing money is called.
http://www.economist.com/news/finance-and-economics/21570753-what-happens-when-fed-starts-losing-money-other-side-qe
As of October 2014, the Fed stopped buying large quantities of assets and since then it has kept the size of their balance sheet constant by only replacing maturing securities.
https://www.brookings.edu/blog/ben-bernanke/2017/01/26/shrinking-the-feds-balance-sheet/
Here are the holdings as of March 8, 2017 (and the exact securities can be found on the tabs from the link below):
https://www.newyorkfed.org/markets/soma/sysopen_accholdings.html
Most holdings are of US Treasury Notes and Bonds followed by Agency Mortgage-Backed Securities, US treasury inflation-Protected Securities, some Federal Agency Securities, and some US Treasury floating rates notes.
Again the average return on the securities is 3.5% with a lot of the higher yield coming from MBS’s. Thus far the QE program has profited the taxpayer $700 billion from the aforementioned seigniorage.
If the overnight rate goes above this 3.5% level (or whatever the average becomes after rolling over the securities) without draining reserves from the system then the program could begin to pay more money than it receives.
Here is the current spread on the IOER to the different maturities of treasuries:
The biggest risk to the QE program’s profitability is if the yield curve inverts. That is if the front end of the curve were to go above the longer end of the curve. This means the overnight rate will be higher than the market rate that the Fed can roll over existing holdings.
Granted this is a relatively rare event, but it does happen. There were only 8 years (10% of the 80 years of data) when the average weekly yield curve status was inverted for the year: 1927, 1928, 1929, 1966, 1969, 1980, and 1981.
There were 17 years (21% of the 80 years) when there was at least one week of inverted yield curve: 1927, 1928, 1929 1930, 1959, 1966, 1967, 1968, 1969, 1970, 1973, 1974, 1979, 1980, 1981, 2000, and 2006 (but 9 of those 17 years had a positive average for the year).
http://seekingalpha.com/article/23870-an-80-year-yield-curve-history-and-its-implications
During most of these times there was either stagflation or deflation. I would not rule out either possibility especially, stagflation, with our new president Trump and some of his suggested policies. The potential for tax cuts, infrastructure proposals, and defense spending have moved up the market based expectations of inflation, but the prospect of tighter trade and lower immigration could lead to higher prices and unemployment as the economy slows.
There is similar risk from deflation in the US still today after the crises. After the 1970’s it is clear that prices have gone up too fast for the “real” purchasing power of the middle class wages to keep up.
http://www.advisorperspectives.com/dshort/updates/2015/09/23/median-household-income-growth-deflating-the-american-dream
We can see that the headline “nominal” wage has gone up, but so have consumer prices, which erodes the “real” wage, to the point where “a nickel ain’t worth a dime anymore”. In fact since the 1970’s a quarter’s value has fallen to that of a penny in terms of purchasing power. Simply put the majority of new consumers coming into the market today do not have enough income to pay for today’s higher, inflated prices. After the typical consumer has paid for their fixed expense like housing, food, automobile, insurance, medical, etc. there is little left over for savings or any household disposable income. Unlike the recover after the great depression, this great recession has seen less deleveraging. With prices high and incomes struggling to keep up, absent a correction through deflation you can expect at least lower growth until this partial equilibrium corrects.
Conclusion
The current tools at the Fed’s disposal may not be enough in the face of stagflation or serious deflation where the yield curve becomes inverted and even possibly negative towards the long end. Ultimately the Fed could move rates lower but in the face of stagflation this would be counter to their mandate of inflation targeting. In the face of a serious deflation worry and a negative long end of the curve, the Fed could fire up the printing press and helicopter drop money. However, this solution is widely thought to cause inflation.
A loss of confidence in the dollar and the full faith a credit of US government could prove to be disastrous to QE and the taxpayer that backs the government and program. If the taxpayer starts to suffer losses from the reinvestment risk (or capital losses during the unwinding faze) of the QE program the whole Federal Reserve system could be called into question where Congress could then take control of monetary policy. History has shown this never goes well when policymakers are placed in charge of a central bank because they are subject to short-term political influence and may face pressures to overstimulate the economy to achieve short-term output and employment gains that exceed the economy's underlying potential.
https://www.federalreserve.gov/faqs/why-is-it-important-to-separate-federal-reserve-monetary-policy-decisions-from-political-influence.htm
Think Weimar Republic, Mugabe’s Zimbabwe, and most recently Maduro’s Venezuela.
https://en.wikipedia.org/wiki/Hyperinflation#Notable_hyperinflationary_episodes
Consumer prices will likely level off as the core tightens throughout the year while nominal wages hit past cycle levels. I suspect the reacceleration of real wages will be a big theme this year as government data catches up.
Simply, why would a US bank holding excess reserves lend to another institution at a rate of .91% when they can receive 1.00% from the government?
Great write up on this. I have say the one thing I find banks lending to one another is based on trust. If you remember the Great Recession when banks were refusing to lend to one another because of the fear they may not get repaid that caused the spread on the LIBOR yield to skyrocket ( if I am remember correctly).
Indeed the FED will have a balancing act to prevent inflation in relation to QE wind down.
so we have a faction in politics that would like to close down the GSE’s. if they were to be successful in their efforts, what impact would it have on the fed and monetary policy? if the GSE’s disappear, would our system return to the behavior seen by the ECB? or do we have some built in structural changes that would need to occur for the system to operate properly?
As always, quality blogging.
I thought Cecchetti & Schoenholtz had a pretty good explaination in their blog post from yesterday:
“In the new system, the IOER rate functions as a ceiling for the federal funds market and the ON RRP rate as a floor. On the first, the most important thing to understand is that with large quantities of excess reserves, virtually no commercial bank needs to borrow in the federal funds market. Banks with excess simply leave it at the Fed and receive the IOER rate. But, while they also have the privilege of depositing funds at the Fed, government-sponsored entities (GSEs) like Fannie Mae, Freddie Mac, and the Federal Home Loan Banks cannot receive interest on their deposits. So, these nonbanks are willing to lend to banks at a rate below the IOER rate, and it is this lending—from nonbanks to banks—that determines the market federal funds rate when the system is awash in excess reserves.”
“The last graph looks similar to the ECB system, but there’s a profound difference. The blue line in all three figures is the interest paid by the central bank (either the ECB or the Fed) on deposits left overnight with the central bank. But whereas this functions as a floor in the European system, it appears to be the ceiling in the U.S.! Returning to the logic of the European system, why would a bank lend to another bank for 91 basis points when it can earn 100 just by leaving the funds in its account with the Fed?
The answer is, for the most part they don’t. Most of the institutions lending fed funds today are not private banks, but are instead government-sponsored enterprises (GSEs) such as the federal home loan banks. The GSEs have accounts with the Fed but don’t earn interest on their reserves. The GSEs can lend those funds to other financial institutions over the fed funds market, or they can lend those funds to the Fed through the Fed’s reverse repo operations. For this reason, the 75 bp reverse repo rate, not the 100 bp rate for interest on reserves, functions as the effective floor for the fed funds rate in the current U.S. system.”
This seems misleading. If I am reading this correctly, IOER and ON RRP should both be considered deposit rates for the ECB graph.
I think the lending rate should be the discount rate.
https://www.frbdiscountwindow.org/en/Pages/Discount-Rates/Current-Discount-Rates.aspx