In response to my assertion growth expectations popped up post-election, and have subsequently receded, Reader Neil writes:
Did the consensus ever price in an economic boom in the US? Growth expectations in the US for 2017 did not shift, at least according to Blue Chip – essentially flat at 2.2%. …
I was intrigued by this comment, so I followed up. In particular, I focus on 2018, presumably when anticipated fiscal and/or other policies would kick in (the ten year-three month yield curve pertains to a year ahead):
I didn’t have Blue Chip handy in a nice digital form, but the Wall Street Journal does do a monthly survey. I’ve exploited those surveys to generate this density plot corresponding to the October 2016 (pre-election), December 2016 (post-election) and July 2017 (latest) surveys.
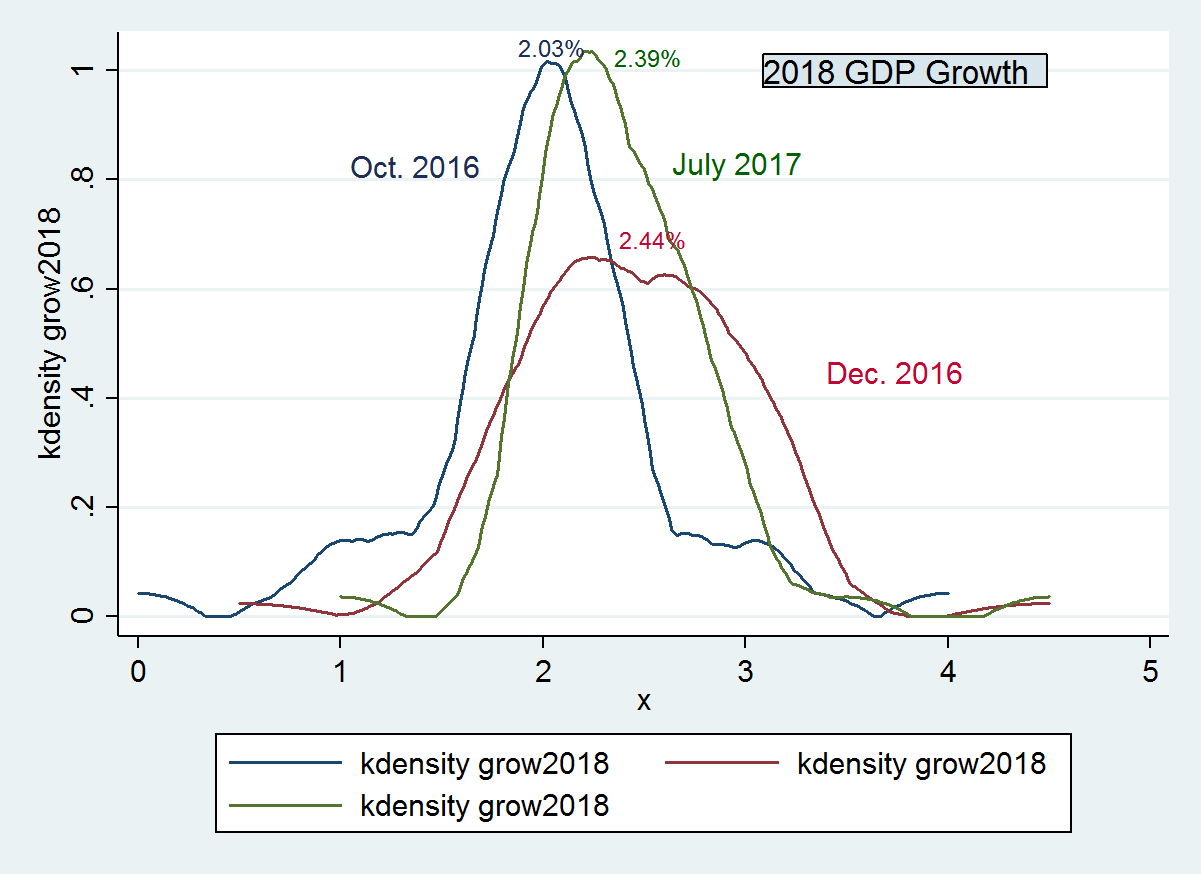
Figure 1: Annual growth rate forecasts for 2018, Kernel density plots from October 2016 survey (dark blue), December 2016 (dark red) and July 2017 (green). Figures indicate mean growth rates. Source: Wall Street Journal, various surveys.
Two observations:
- The mean growth rate noticeably shifted up post-election, but with a much flatter distribution.
- The mean growth rate fell going from December to July.
In essence, there was an upshift in expected growth for 2018 with the election, but increase in dispersion of forecasts. Since December, there’s been a slight downshift, but a shrinking of the dispersion. High forecasts have been shaved off, as have some low.
The mean growth rate for 2017 rose from 2.17% in October, to 2.40% in December, and back down 2.28% in July 2017.