It looks even worse than shown in this post.
Reader Bruce Hall muses:
It might be interesting to take a longer view of Kansas’ economy: https://fred.stlouisfed.org/series/KSNGSP
2005-08 was a period of unusual growth for Kansas’ GDP while the 2009-10 recession was unusual decline. So, if you are using 2005-10, it may or may not be a good representation of what might be considered “normal” GDP change. Perhaps a better baseline trend might be prior to 2005. If, for example, PeakTrader’s point that wheat rose in price from $3 to $10 per bushel between 2005-09, perhaps the data could be “normalized” by looking at the prices for the prior and subsequent period for a better representation of the economy.
Here is a graph of Kansas real GDP, with 1987-2004 period based on annual data quadratic interpolation (which should not affect the long term trend). The green line is the stochastic trend estimated over the 2005-2010 period shown in this post. The pink line is the stochastic trend estimated over the 1987-2010 period. To my knowledge, official annual state level data does not go back further. (I use stochastic trends because for the longer sample, I cannot reject a unit root using an ADF, but can reject a trend stationary null using KPSS test).
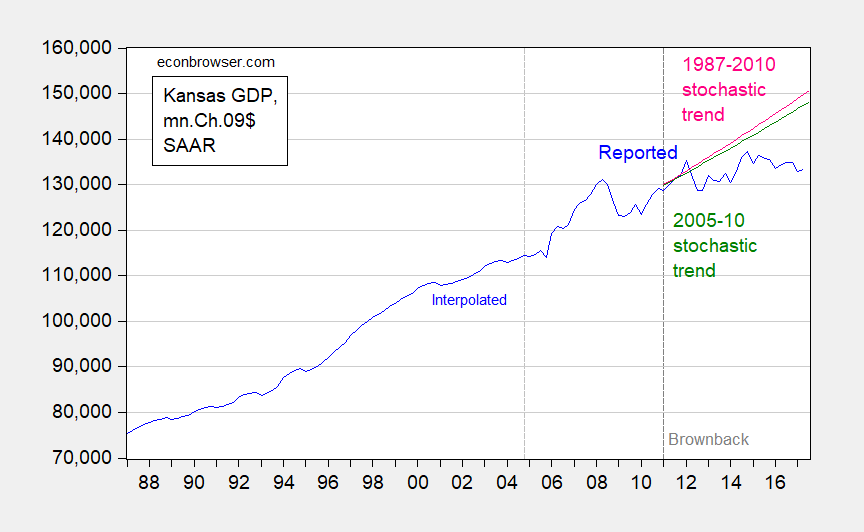
Figure 1: Kansas GDP in million Ch.2009$ SAAR (blue), stochastic trend estimated by regressing log first difference on constant over 2005-2010 period (green), and over 1987-2010 period (pink); all on vertical log scale. Annual 1987-1996 data spliced to 1997-2015 data using overlap in 1997, converted to quarterly using local quadratic fit; quarterly data 2005 onward. Source: BEA and author’s calculations.
As the graph indicates, performance under the Brownback regime looks even more dismal compared over this longer trend.
So now Bruce Hall has his answer.
(By the way, if one were interested, one could estimate an error correction model of cointegrated Kansas GDP and US GDP, with one lag of first differences, up to 2010Q4, and then dynamically forecast over the 2011Q1-2017Q3 period using ex post realizations of US GDP. Kansas GDP would then by 5.8% lower than predicted, in log terms.)
Is it fair to say that Brownback envisioned himself as the real Wizard of Oz but ended up being Toto?
I think more the witch that Toto spilled water on.
What’s Connecticut’s excuse? (I’ve been there, you can’t blame it on the scenery):
“Meanwhile in Connecticut, the state twice raised taxes to address a budget deficit. Unfortunately, these tax hikes did not create long term revenue growth. What’s more, after the most recent rounds of tax hikes, the state experienced a corporate exodus highlighted by GE and Aetna. The state capital of Hartford is also flirting with bankruptcy.”
Chart – Real GDP:
https://fred.stlouisfed.org/series/CTRGSP
Chart – Real GDP Kansas
https://fred.stlouisfed.org/series/KSRGSP
Of course, the mainstream media is biased and manipulative.
PeakTrader: I don’t know what you are trying to assert with this graph. My graph is essentially the same as yours, except at higher frequency, plotted on a log scale, and including two estimated stochastic trends.
Menzie Chinn, Connecticut may be more representative of the U.S. economy – where’s the media hysteria?
peak trader, why change the subject away from the failure in kansas? own up to it.
“Connecticut may be more representative of the U.S. economy”.
I see you have never been to Connecticut. Wow – you found a single state where real GDP did worse than Kansas, I’d call your efforts here Supreme Trolling.
It’s the same subject. I stated without Kansas tax cuts, its economy may be even worse.
And, yes, I’ve been to Connecticut – it’s beautiful, from what I saw. You’d know you’re not in Kansas anymore 🙂
“I stated without Kansas tax cuts, its economy may be even worse.”
standard conservative argument. take an unsubstantiated opinion and treat it as actual fact! then argue from that position. pathetic. or as the donald would say, SAD!
Thanks. I was looking at the St. Louis Fed chart which is not seasonally adjusted and the slope looked significantly different. A straightedge would say that the slope was almost a straight line through 2016 or the past 20 years. But their data only went back to 1997. https://fred.stlouisfed.org/series/KSNGSP
Bruce Hall: That FRED graph plots annual data, so no need to seasonally adjust…
But remember, a straight line is consistent with a constant percent growth rate if the Y-scale is logarithmic. That is in fact the reason I use logs or log-scales…
A straight line when the Y-scale is in units implies declining growth rates.
For more, see this post.
Menzie, I understand. Guess I was fooled by the linear scale that is also used on both your chart and the St. Louis Fed chart which purport to show dollar changes rather than percentage changes. I presume that if those charts were converted to a log scale y-axis, they would have a lower slopes and curve downward as you suggest (but I haven’t actually recharted them). As they appear now, the charts seem to show dollar changes, not percentage changes. https://i.investopedia.com/inv/articles/site/logvslinear.gif
I think your notation “mn.Ch.$09” probably slipped by me if that means monthly change in constant 2009 dollars. But if it is meant to show percentage change, shouldn’t it have a log y-axis indicating percentage change?
If you are using Excel, there is a formatting option for the y-axis to convert linear to logarithmic scale. Here is an example with the formatting box open (Macbook). https://www.dropbox.com/s/c8h61m7wt4ivrbw/Linear%20vs%20Log%20Scale.png?dl=0
Bruce Hall: My mistake, I omitted the fact that the y-scale on my graph is a log scale. You can see that is true because the gap between 70,000 and 80,000 is bigger than that between 150,000 and 160,000. I will fix that omission.
Bruce Hall: “mn.Ch.09$” is “millions of Chained 2009$”.
I’d just like to add a clarification to this. The data Menzie Chinn is using are for the real state GDP in 2009 from the BEA. He’s right that they don’t go back past 1987 – if you look at the series, you see all these (NA) signs for them. However, if you are willing to use the SIC data, as opposed to the NAICS data, and you can live with the discontinuity in 1997, when the BEA switched over, AND you can live with nominal as opposed to real (2009) dollars, you can go back to 1963. My attempt to do this is in
https://www.bea.gov/itable/iTable.cfm?ReqID=70&step=1#reqid=70&step=10&isuri=1&7003=200&7035=-1&7004=sic&7005=-1&7006=20000&7036=-1&7001=1200&7002=1&7090=70&7007=-1&7093=levels
Remember that these are nominal dollars, so they aren’t discounted for inflation. To do so, you have to do your own calculations, with some index you devise, which will be off a little bit. But it will still show you some handsome growth, which had nothing to do with the Brownback program. For example, if we look at 1963 to 1964, which were years of low inflation no matter how you slice it, Kansas GSP (gross state product) in the All Industry total grew from 6,135 million dollars to 6,418 million dollars, a very handsome 4.6% growth rate, which will not shrink to the Brownback levels for any reasonable measure.
PeakTrader is misrepresenting what’s wrong with Connecticut:
http://www.slate.com/articles/business/metropolis/2017/06/something_is_wrong_with_connecticut.html
“Connecticut exploited that trend to build itself into an economic powerhouse. It offered enormous tax breaks to lure trading floors to Stamford, Connecticut. Its posh suburbs drew high earners out of New York. But the state was more dependent on the firms than the other way around, and the incentives never stopped. Eventually, low business taxes meant the state came to rely disproportionately on its wealthy residents.”
Pgl, you’re the one misrepresenting by excluding the high cost of living, huge unfunded state pension liabilities, high taxes, including income and property taxes, and huge budget deficits. You haven’t disputed my comments and chart above. The future of Connecticut doesn’t look good, in large part to government mismanagement, and people are fleeing the state.
Did you cut and paste your latest from a Sean Hannity show? But yea – the mismanagement was to provide tax subsidies for the well to do. Just the opposite of what you are spinning.
So, your spin is not giving rich people subsidies causes them to stay in Connecticut – did you cut & paste the latest from the Socialist party?
It’s not just a mismanagement of subsides – it’s a train wreck of mismanagement.
peak, here is a little hint. calling somebody a socialist or communist is old-from the 80’s and beyond. only old people living in the past use this attempted insult anymore. you are out of touch with today’s world, and living in the past…
Menzie one could estimate an error correction model of cointegrated Kansas GDP and US GDP, with one lag of first differences,
At the risk of being a bit pedantic, one could only do this if both the Kansas and the US time series were integrated of order 1. Of course, at quarterly frequencies it’s probably a safe bet that both time series do contain a unit root.
As to the seasonality issue, I’ve always been a little leery of applying out-of-the-box unit root tests to seasonally adjusted data because you don’t always know how the seasonal and trend filtering might have affected the serial correlations in the data. And of course there’s always the possibility that the raw data could contain seasonal unit roots.
2slugbaits: Points well taken. for the sample periods I have, I can’t reject unit roots in both KS and US GDP, so ECM seems to make sense to me. Could do an ARDL if I were uncertain.
Re: seasonality: not sure what unit root test to apply given there is no such thing not-seasonally-adjusted KS and US GDP. Am willing to learn, though.