The Brownback-Kansas experiment, that is. Revised employment data for Kansas shows that employment was flat for nearly a year and a half, before crashing in mid-2017.
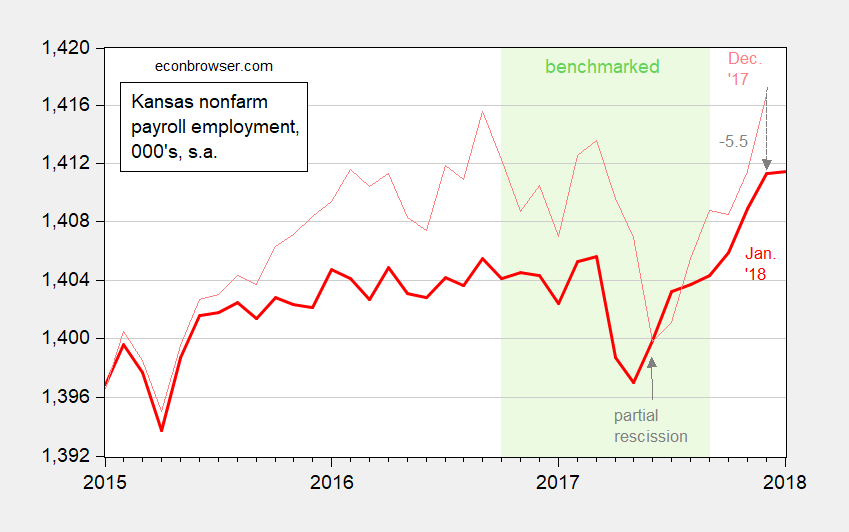
Figure 1: Kansas nonfarm payroll employment, January release (thick red), December release (pink), 000’s, s.a., on log scale. Light green shading denotes period in which data revised/benchmarked. Source: BLS via FRED, ALFRED.
A longer term perspective shows the extent of the deterioration. Kansas was trending faster than Missouri before Brownback’s terms.
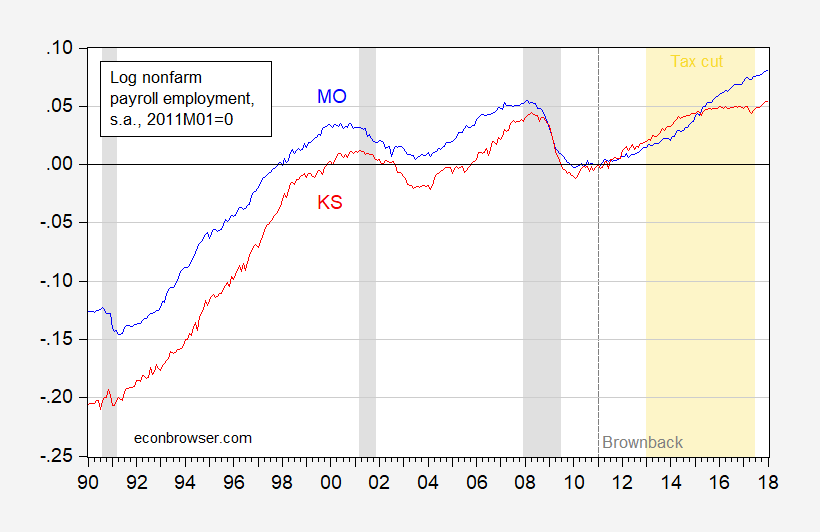
Figure 2: Kansas nonfarm payroll employment (red), Missouri (blue), 000’s, s.a., on log scale. Light orange shading denotes period in which tax cut in place. Source: BLS via FRED, ALFRED.
The recovery in employment occurs only with the partial end of the tax cuts implemented in 2003.
“The recovery in employment occurs only with the partial end of the tax cuts implemented in 2003.”
Right. So we have the policy formula: the tax cuts should not only partially end, but they should even increase taxes say by 500% to make the recovery in employment really strong. Or even more: the state of Kansas should confiscate (100% tax rate) all earned and unearned income to make the recovery in employment much stronger. And in addition they should double down: they should announce that they will apply 100% tax rate for the next 30 years of all income, so that the recovery in employment can be much stronger for a much longer period of time. Because we want the recovery in employment to last a long time, thus, we need very, very high taxation for a long, very long, time. I would say – infinite time, forever.
Because when we have very high and very strong taxation, only then we have a recovery in employment. It’s the new economic thinking.
Or you can read Menzie’s comment to suggest that a raise in tax cuts don’t necessarily lead to higher unemployment. But then you couldn’t go on a free associative rant.
Meant to say rescinding tax cuts doesn’t necessarily lead to higher unemployment.
Or, Manfred, using your line of thought, just eliminate taxes altogether and rely on voluntary contributions for necessary public services. Or simply eliminate public services.
Or, more to the point, before deciding on what level of taxation is necessary, don’t tell citizens you’re embarking on a “real live experiment” to determine that level. And, further, don’t bellow out nonsense like “Look out Texas, here comes Kansas,” because you’re positive your “experiment” will be so successful that you don’t have tens of thousands of your own citizens calling their own state “Brownbackistan.”
Yeah! Just like when a doctor says take 2 aspirin, it means taking 200 aspirin would be even better!
Once again giving credence to the Bugs Bunny Theory on large construction project finishing timelines, and revised economic indicators. Actually, in this case that’s not the root cause, but it gives me an excuse to but the Bugs Bunny link up again.
https://youtu.be/D1xqrdtJs8w?t=6m57s
Selected Local Area Unemployment Statistics BLS
Some of the states often written about here plus a few I through in. May help with perspective of Charts by Menzie especially if rates are are still dropping or beginning to level off. Statistics are
State
%unemployed
Rank out of 51
North Dakota
2.6
2
Iowa
2.9
4
Nebraska
2.9
4
Vermont
2.9
4
Colorado
3.0
7
Utah
3.1
10
Wisconsin
3.1
10
Indiana
3.3
12
Minnesota
3.3
12
South Dakota
3.4
15
Kansas
3.5
16
Massachusetts
3.5
16
Virginia
3.6
18
Missouri
3.7
19
Texas
4.0
23
California
4.4
31
Mississippi
4.6
37
Michigan
4.7
39
New Jersey
4.7
39
New York
4.7
39
Washington
4.7
39
Illinois
4.8
44
Pennsylvania
4.8
44
Nevada
4.9
47
District of Columbia
5.8
49
Just note when in discussion of statistics, Wisconsin, Indiana, Minnesota, and Kansas are well ahead Michigan, California. New Jersey, New York, and Illinois. Missouri
is sort of in between. There is a trend that more populous states have higher rates, which I refer to Menzie’s charts for clarification. But it remains the first states listed should show leveling off as they have reached or below natural, historical rates.
Ed
Problems galore, Ed, but I’ll concentrate on unemployment in small states as opposed to larger ones, specifically California.
You do realize that North Dakota has a population of about 725,000, making it smaller than the city/county of San Francisco? That if you combine san Francisco and San Mateo counties, you have a population larger than that of both South and North Dakota? And that if you add in Santa Clara County, if have combined population larger than that of South Dakota, North Dakota, and Nebraska combined? Larger than either Iowa or Kansas too?
Or that the nine county greater Bay area has a combined population of over 7 Million, making it larger than either Indiana or Wisconsin? Or that this area has a GDP larger than that of the Netherlands?
I ask because the unemployment data in these areas hovers near or below those states you’ve highlighted . The larger SF-San Mateo Metro area had a 2.2 to 2.5% unemployment rate in January. San Jose-Santa Clara “jumped” from 2.7% to 3%.
The areas of relatively high unemployment here are those with less diverse bases that depend largely on agriculture. That would be the lower Central Valley, parts of the Sacramento Valley, Imperial Valley, and the northeasten Sierra. The congressional districts represented by Nunes and McCarthy are above 8%, about 4X that of the district represented by economic evildoer and resident congressional job killer Pelosi.
There are, as you may or may not realize, several geographic/cultural/economic regions in a state with nearly 40,000,000 people. Try to keep that in mind when making simple comparisons.
nonec
Read it again if you can stand it, I do not believe I made any simple comparisons, or for that matter, any comparisons. My central point was that it is expected that extremely low unemployment states charts should flatten out.
Oh, and by the way, unlike many here that root against red states, I do not root against the blue.
Ed
Gee, Ed. You said certain above states are, in terms of statistics, we’ll ahead of…California, in simple state by state terms, sure. But you can’t honestly compare Wisconsin(5.8 Million) or Kansas (2.8 Million) or Indiana (6.3 Million) with California.
There are fewer people in Kansas than there are in San Diego County, which has an unemployment rate of 3.3% with far more economic diversity. Kansas may be well ahead of California, but it clearly regions surpassing it in both population and economic diversity.
Combine San Diego and Orange counties with Wisconsin where combined population is similarand you still get numbers that Wisconsin trails.
A more honest comparison—of state unemployment numbers—would be California and Texas, which is not “well ahead” of California, unlike the other named states which in comparison, you claim are.
nonec
Just read for a change. I wrote;
” There is a trend that more populous states have higher rates, which I refer to Menzie’s charts for clarification.”
Maybe that’s too hard for you to understand.
Menzie’s chart have great value, and in case of comparison large to large small to small, is no exception. His charts just don’t and can’t tell the whole story.
Ed
nonec
Just read for a change,. I wrote,
” There is a trend that more populous states have higher rates, which I refer to Menzie’s charts for clarification.”
Or maybe it is just too hard for you.
Menzie’s charts have great value, such as comparing the large with the large and the small with the small, and the agricultural with the agricultural,. But they don’t and can’t tell the whole story. Besides my small points of assertion such as ‘leveling off’, among my other purposes includes giving a wider perspective.
Ed
So, you need not have written “…when in discussion of statistics, Wisconsin, Indiana, Minnesota, and Kansas…” are well ahead of…” the larger states you then mention. That seems a clear comparison, which you say you didn’t make.
Far better, to avoid backpedaling, to have begun with “There is a trend…” which is not what you lead sentence says.
nonec
Yes, I did need to write that line. It fits the leveling off perspective, but I also see how you read it. Chalk it up to best I could write at the time.
Ed
Sorry for the anonymous post, but my son told me I had to manage my cookies better, and forgot that was how we are remembered here at econbrowser.
Ed