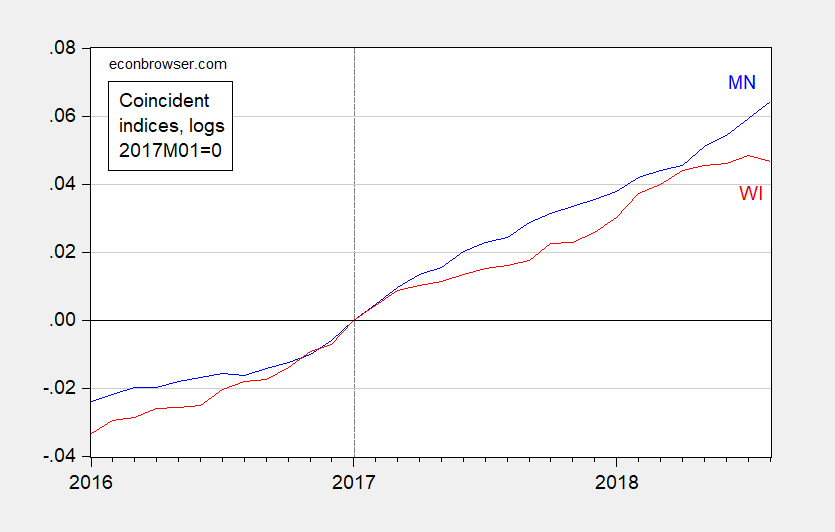
According to the Philly Fed coincident indices.

Figure 1: Log coincident index for Minnesota (blue), for Wisconsin (red), both 2017M01=0. Source: Philadelphia Fed, author’s calculations.
According to the Philly Fed coincident indices.

Figure 1: Log coincident index for Minnesota (blue), for Wisconsin (red), both 2017M01=0. Source: Philadelphia Fed, author’s calculations.
Interesting. What happened in April to cause the “flatline”?
Bruce Hall: Not sure; agriculture contributes -0.49 ppts of 1.2 ppts real growth in Q1.
Hard to find any details.
Bruce Hall: As described in the link to the Philadelphia Fed coincident index, included just below the graph of the coincident indices:
Since the unemployment rate rose 0.1%, and NFP employment rose slightly, this suggests the other two indicators must have fallen slightly.
For more details on how the coincident indices link up with overall economic activity measured by GDP, see this post, which you may recall you commented on several times.
Menzie, thanks. I meant, however, that I couldn’t find current data on what aspects of agriculture had declined in Wisconsin. I suspect that soybeans are not as important as dairy production in Wisconsin and, if so, the overall decline in agriculture could be attributed mainly to a decline in the dairy sector.
Bruce Hall: Absolutely; soybeans are minor in WI. Dairy is first. See here and for soybeans here. Monthly stats for WI ag production are not findable by me.