Bruce Hall takes issue with my post on Wisconsin’s employment growth, and writes (sarcastically):
Looks as if every state in the midwest is doing fine except Wisconsin.
Mebbe the unsarcastic interpretation is more correct. I let readers assess, based on these graphs.
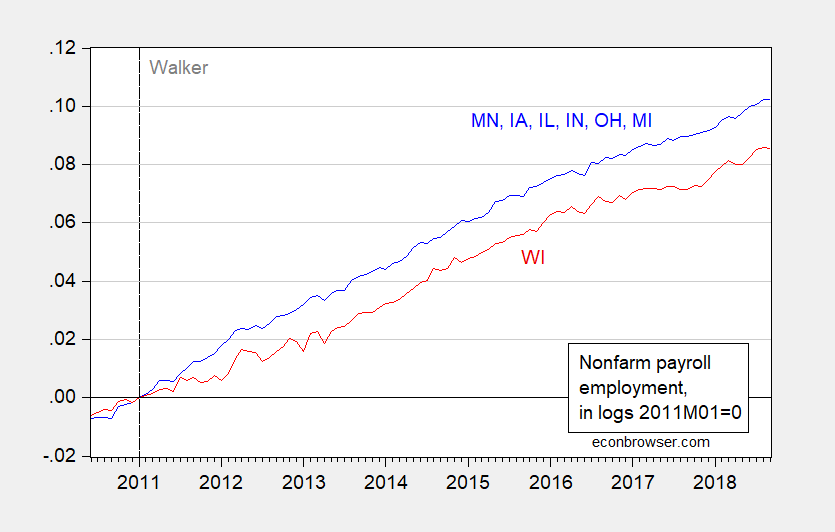
Of course Bruce would call this unfair as his metric is the last year’s annual change. He cannot consider anything shorter than that (as in the growth in the last few months) or anything longer than that as in going back to 2011. In fact, it is not fair to Bruce to draw graphs that show the entire time series. After all Bruce learned from the Stephen Moore school of deception and presenting a fuller picture is just too much honesty for his taste.
et al,
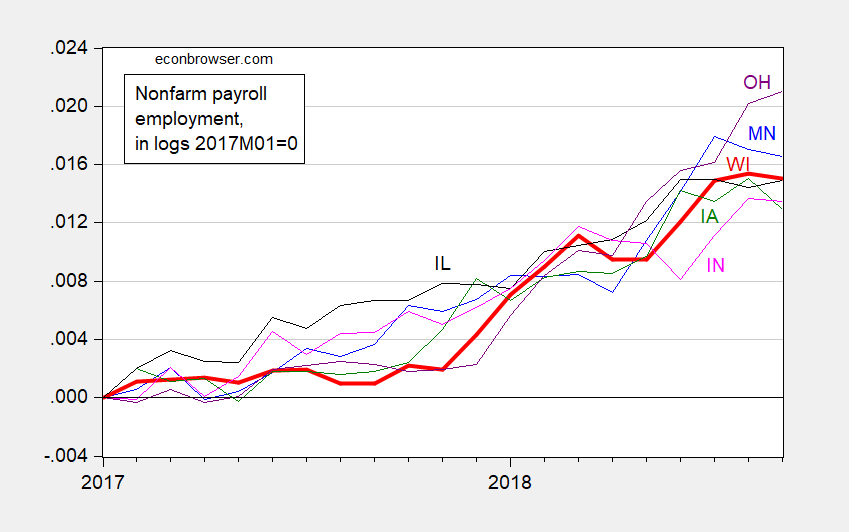
Just go back to the dropbox link I provided. Starting points are important. And pal, the graphs are from the BLS time series beginning January 2017.
The point, which seems to be conveniently overlooked, is that Wisconsin is perfectly representative of the Midwest during that period. I was making that point because Wisconsin was being compared with total U.S. changes (see Menzie’s original post). Apple to apples rather than apples to oranges.
I’m traveling so this is my only comment.
Sorry dude but you had your 15 minutes of fame. Move on.