Today, we are pleased to present a guest contribution written by Iván Kataryniuk (Banco de España) and Jaime Martínez-Martín (European Central Bank) summarizing their chapter in the book International Macroeconomics in the wake of the Global Financial Crisis edited by L. Ferrara, I. Hernando and D. Marconi. The views expressed here are those solely of the author and do not reflect those of their respective institutions.
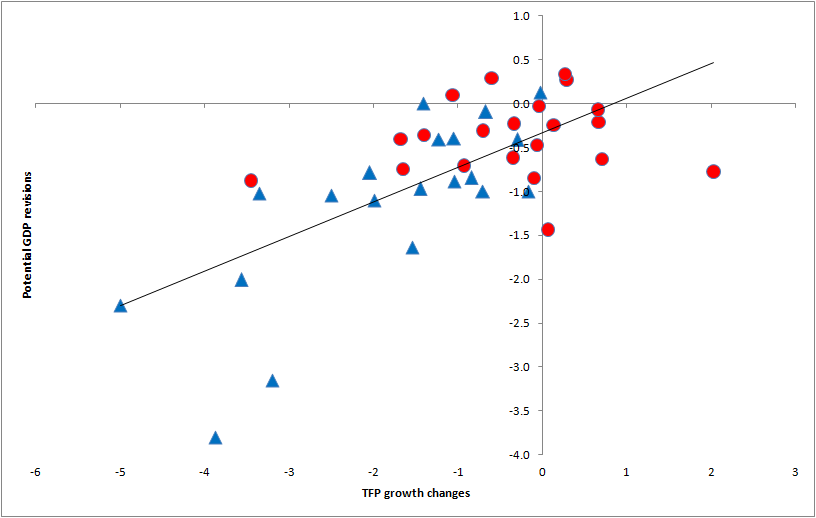
Total Factor Productivity (TFP) is the residual obtained after subtracting from output the measured contribution of labor and capital. It has been identified by authors back to Robert Solow as the driving force of long-run economic growth, especially once growth by means of factor accumulation (labor and capital) is subdued. Since the onset of the Global Financial Crisis, many advanced and emerging economies have experienced a process of adjustment of their potential output growth, which coincides with a decline in current TFP growth (See Figure 1).

Figure 1. Potential GDP growth revisions (2011 vs 2015) and % of TFP growth (2003-2007 vs 2010-2014). Sources: IMF (2015) and own calculations. Notes: Triangular points refer to EMEs and circle points to advanced economies.
One of the main suspects behind downward revisions in potential output growth would be a global slowdown in TFP growth, both in advanced and emerging economies. We contribute to the current debate by computing and decomposing TFP growth at an aggregate level for a panel of 41 emerging and advanced economies, based on a standard growth accounting framework. To this end, we construct original series of labour and capital, both public and private, and use this framework to capture structural and cyclical determinants of the deceleration of TFP growth in the most recent years. Two challenges remain to researchers aiming to explain these differences: on the one hand, TFP growth becomes empirically hard to measure; and on the other, model uncertainty hampers consensus on its key determinants.
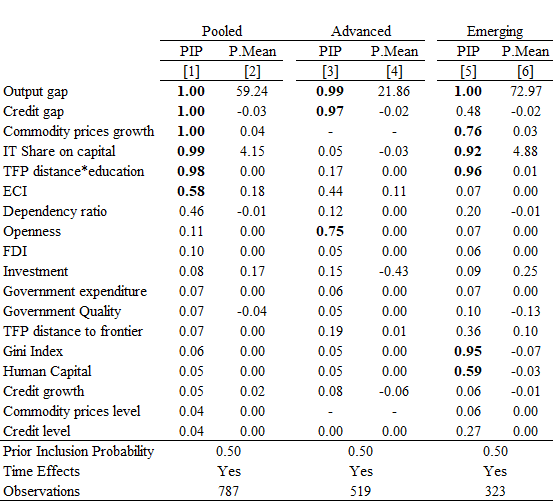
With the aim of capturing the main determinants of TFP growth, we select the most important predictors from a pool that follows the empirical literature. In Table 1 we summarise the main results of the estimation. We use a statistical technique called Bayesian model averaging. This empirical framework allows us to assign a probability of inclusion of a variable in the “true” model to explain TFP (measured by the posterior inclusion probability (PIP)). For example, column 3 in Table 1 shows that there is a 99% probability that the model of TFP growth for advanced economies includes the output gap. In light of these results, the selected “optimal” model considers six variables (in bold). Thus, as an empirical result, we can choose a statistical model out of several coexisting theories and build the contribution of the drivers of TFP growth over time.
In addition, we arrange the most important factors in a “cyclical vs. structural” ex ante classification and estimate a panel model for both the full sample of countries and by two subsamples of advanced and emerging economies. The cyclical factors are supposed to be those that cannot be affected by the economic structure or economic policy in the long run, such as the output gap or commodity prices. We find that there is a strong cyclical behaviour in TFP growth, characterised by the high inclusion probability of the output gap. The credit gap is included with a negative sign, meaning that TFP growth behaves counter-cyclically with respect to the credit cycle, especially for advanced economies . This behaviour could be explained by, for example: (i) in emerging economies, the catching-up effect of countries with underdeveloped financial systems; and/or (ii) in advanced economies, the presence of credit bubbles in sectors with low productivity growth or the destruction of low productivity jobs during recessions. The growth of commodity export prices for commodity-exporting countries is also included with a relatively high probability.
With respect to the structural factors, we find a higher probability of inclusion for a variable that takes into account both the distance to the TFP frontier and the level of education. This result suggests that there is a cut-off point (around 20-25% of the population with secondary studies in our sample) above which a country starts to converge to the global frontier. The two proxies for innovation, the growth of IT capital and the Economic Complexity Index (ECI), also enter the model with a probability greater than 50%, although they are not robustly included when splitting the sample.

Table 1: Empirical determinants of TFP growth. Notes: Columns [1] and [2], refer to the determinants of overall TFP growth of emerging and advanced countries while columns [3] and [4] summarise the results of TFP determinants of advanced countries and [5] and [6] of emerging economies. PIP refers to the posterior inclusion probability of a particular predictor. The sample includes yearly data from 1980 to 2013. Given the prior inclusion probability is equal for all the variables (i.e. 0.5), those regressors with PIP above 0.5 are considered as robust drivers of TFP growth; P. Mean refers to the posterior mean conditional on the inclusion of a given regressor in the empirical model, which is a weighted average of model-specific coefficient estimates with weights given by the model-specific R-squares.
The results indicate that a substantial share of the TFP deterioration in recent years may be explained by a negative business cycle (as predicted by the importance of the output gap and time-specific effects). However, other cyclical factors have contributed to the recent weakness, such as the credit gap for advanced economies – which may be explained by excessive leverage in such economies – and the decline in commodity prices for commodity exporters.
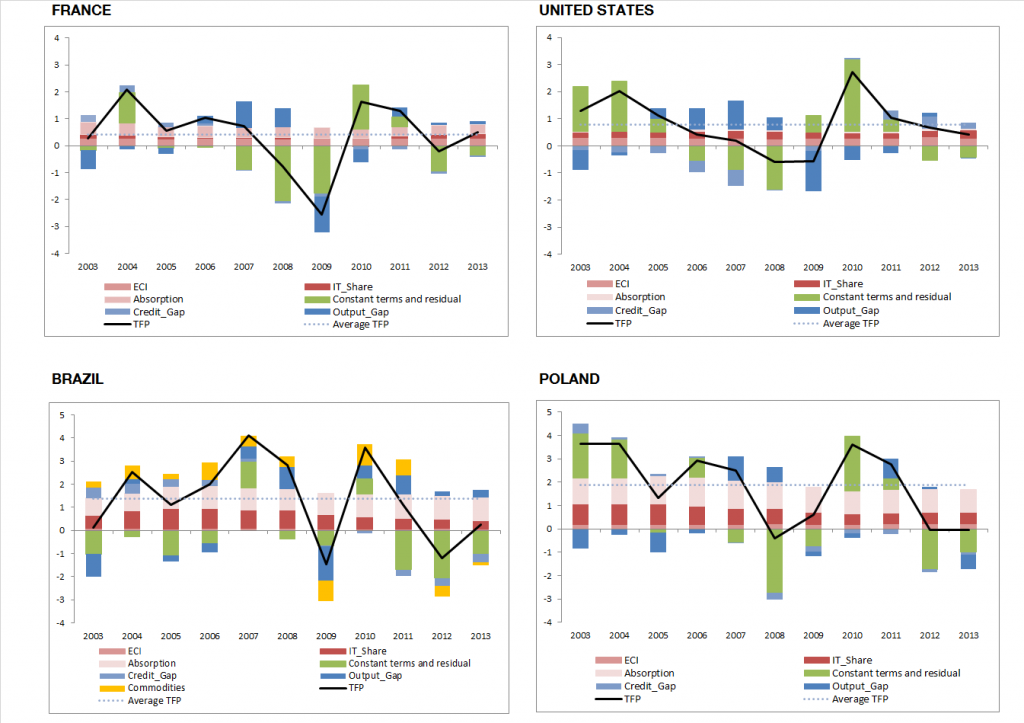
Figure 2 evidences the heterogeneity of our panel when plotting the TFP growth decomposition for selected countries over the 2003-2013 period. Red-shaded bars refer to structural factors and blue-shaded bars refer to cyclical factors. We illustrate some representative cases of advanced economies such as the USA (a frontier advanced economy) and France (a non-frontier advanced economy). Additionally, we show TFP growth contributions of an emerging economy such as Poland and an emerging commodity-exporter such as Brazil.

Figure 2. TFP growth and contributions. Notes: Contribution of each component to TFP growth over the 2003-2013 period.
Several conclusions can be extracted from Figure 2. First, the importance of cyclical factors in all countries, as much of the time variation is explained by the time dummies and the output gap. Moreover, in the case of Brazil, there is evidence that the so-called “supercycle” (the huge increase in commodity prices during the 2000’s) contributed to a higher measured TFP, as seen by the contribution of commodity prices to TFP growth. Second, the key structural driver of TFP growth in advanced economies is related to the complexity of the economic structure and the incorporation of new technologies. In the previous example with regard to the USA, the addition of structural predictors such as IT capital and the economic complexity indicator (ECI) accounts for a TFP growth of 0.6% per year on average during the 2003-2013 period, compared to an observed TFP growth of 0.8% per year on average (incl. cyclical factors). Additionally, it is worth mentioning the relevance of TFP convergence processes of emerging market economies (measured by the “absorption”, i.e the variable interacting the distance to the TFP frontier and education levels in Table 1), whose TFP levels are far from those of the frontier. This is particularly acute for a country with high education levels like Poland. In the case of the USA, a country close to the productivity frontier, such driver becomes irrelevant.
In short, some of the deterioration of the TFP growth outlook in recent years may be explained by a negative business cycle, but structural weaknesses remain behind the slowdown in medium-term growth, especially for emerging countries. However, there is still room for improvement in several structural determinants, such as investment in IT technologies and in human capital.
This post written by Iván Kataryniuk and Jaime Martínez-Martín.
If there was a serious supply-sider out there (I know, I know – that is a real Laffer aka laughter) – the last sentence gives a clue to policy:
‘there is still room for improvement in several structural determinants, such as investment in IT technologies and in human capital.’
So what does the give tax cuts to the rich do for this kind of investment? It reduces it. Off to the Hamptons!
“His economic team offered sharply conflicting advice, with moderates like Treasury Secretary Steven Mnuchin counseling compromise, while hard-liners like Peter Navarro, the White House director of trade, urged him to double down on his pressure. The moderates tried to exclude Mr. Navarro from the trip. But at the dinner in a Buenos Aires hotel, he was there at the table, seated between the national security adviser, John R. Bolton, and the chief of staff, John Kelly.”
Rather than have an economic team – Trump puts together a 3 ring circus and clown show. I’m glad US farmers are getting a little relief but I bet those steel workers feel stabbed in the back. So what did we get for all of this chaos? We heard it was about China allegedly “stealing” IP but we have seen no concessions on this issue from China. None and don’t hold your breath for any in the future. Trump is a fraud.
This is the kind of thing that is true supply side economics, not that Art Laffer garbage.
Their choice of proxies for innovation (viz., IT capital share and ECI) struck me as less than obvious. For me the obvious choice would have been the number of patents granted each year. You’d think that the IT capital shares variable might be strongly correlated with the output gap, so it might not be clear cut how much of the change in IT is due to innovation (i.e., updating with new and more powerful IT) and how much is due to holding off investment because of weak consumer demand.
Finally, I think the “Openness” parameter deserves a little more discussion given all of the current hoopla over tariffs and Brexit. It seems strange that Openness would be important for advanced economies but virtually neutral for emerging economies.
I don’t have any criticisms here, nor do I have any real insights that I don’t think others haven’t already noticed. I’d like to add something here or say something intelligent related to this post, but I’m not getting anything. I mean I think the paper is useful and could/does add useful things in observing important things to economies in general. But my brain is failing to come up with any original observations that haven’t already been noted by the authors. It appears all I am good for in this blog is smart-ass comments. Who knew??
I do like the post though and I’m glad Menzie got them to share with us. I will try to read the research paper more focused on TFP in emerging economies if time allows. Thanks to the authors.
An additional factor that could be considered but is very hard to incorporate into a model is the likelihood of diminishing marginal returns to research and innovation. Robert Gordon’s recent book The Rise and Fall of American Growth documents a series of US examples. In my own area on the economics of agricultural research I am regularly finding diminishing returns to that research.
There is still scope for countries and firms to catch up to the technological frontier but the frontier is now moving much more slowly and requiring much greater research resources to gain those marginal increments.