Analysis of current economic conditions and policy
Treasury Spreads and Measured Economic Policy Uncertainty for 2018
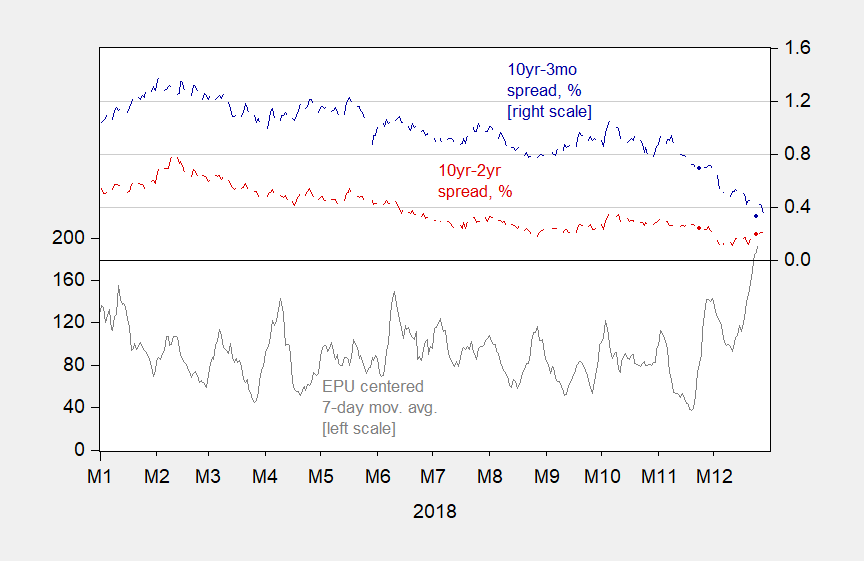
A correlation shows up in the last month or so:
Figure 1: Baker Bloom and Davis Economic Policy Uncertainty index, centered 7 day moving average (gray, left scale), and ten year – three month Treasury spread, % (blue, right scale) and ten year – two year spread, % (red, right scale). Source: policyuncertainty.com, FRED and author’s calculations.
2 thoughts on “Treasury Spreads and Measured Economic Policy Uncertainty for 2018”
pgl
Mattis’s farewell message calls for the troops to defend the Constitution – a laudable goal!
“Danny Blanchflower: “Hey Stephen Moore you need to withdraw this lie NOW: ‘Pay gains in real terms this year are now estimated at 3 percent—one of the biggest increases in two decades’. Real hrly earnings rose 0.8% real weekly 0.5%…”
Or maybe Stephen Moore does not know the difference between nominal wages increases v. real wages increases. He is incredibly stupid when it comes to basic economics!
Mattis’s farewell message calls for the troops to defend the Constitution – a laudable goal!
https://news.usni.org/2018/12/31/mattis-farewell-message
But defend against whom? Trump perhaps. Could this be a call for a U.S. military coup!
Stephen Moore cannot stop lying:
https://twitter.com/D_Blanchflower/status/1080095155213029376
“Danny Blanchflower: “Hey Stephen Moore you need to withdraw this lie NOW: ‘Pay gains in real terms this year are now estimated at 3 percent—one of the biggest increases in two decades’. Real hrly earnings rose 0.8% real weekly 0.5%…”
Or maybe Stephen Moore does not know the difference between nominal wages increases v. real wages increases. He is incredibly stupid when it comes to basic economics!