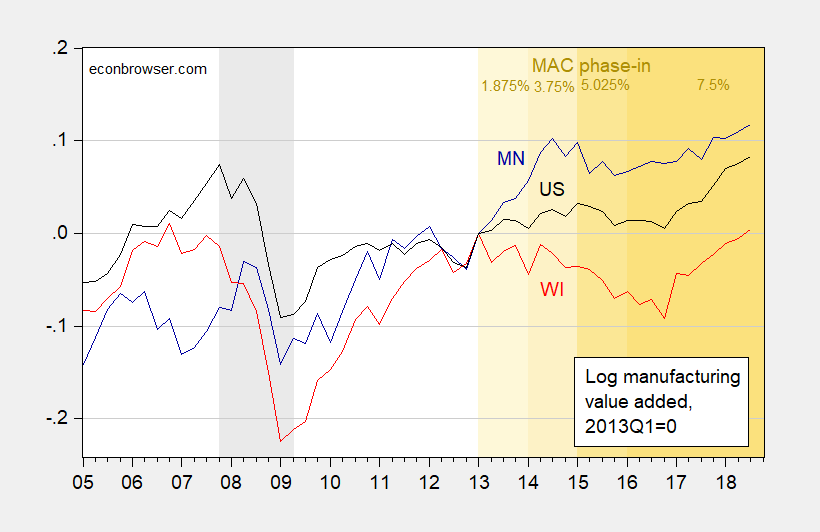
Has manufacturing value added increased above what was expected, in response to the (costly) Manufacturing and Agriculture Credit? Comparing against Minnesota (which did not implement such a measure) suggests no.
Figure 1: Log manufacturing value added in Minnesota (dark blue), Wisconsin (dark red), and US (black). NBER defined recession dates shaded gray. MAC phase in shaded orange. Source: BEA, NBER.
This picture is merely suggestive. In order to answer the question posed in the title, one needs to generate a counterfactual. I use the first differences relationship between real manufacturing value added, Wisconsin GDP, US GDP, and (lagged) real exchange rate for Wisconsin.
Δmfgt = -0.006 + 1.35ΔyWIt + 1.71ΔyUSt – 0.117Δrt-1 + ut
Adj. R2 = 0.79, N = 31, DW = 2.29. bold denotes significant at 5% MSL, using HAC robust standard errors. Coefficient on Δr significant at 12% MSL.
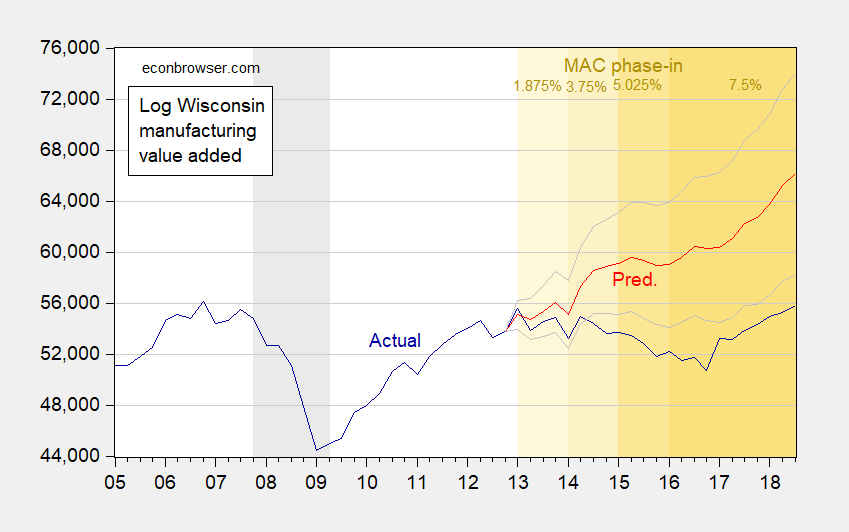
Using this equation to dynamically forecast out of sample yields the following counterfactual.
Figure 2: Wisconsin real manufacturing value added (mn. Ch. 2012$, SAAR) (blue), dynamic forecast (red), 90% prediction interval (gray). Source: BEA, NBER, author’s calculations.
Wisconsin manufacturing value added actually underperforms what one should expected on the basis of US, WI GDP and Wisconsin-specific real exchange rate. (See an assessment of manufacturing employment here)


Republican Majority Leader Scott Fitzgerald: “…….. job creators”. Whenever a Republican fits that usually false description into a sentence, brace for impact of a large piece of cow crap to hit your head from about 20 stories up.
A nice plain language summary here: https://madison.com/ct/news/local/govt-and-politics/wisconsin-s-sweeping-manufacturing-and-agriculture-tax-credit-reaches-full/article_21300bb8-3ea3-5210-9596-b1a0ad287f0e.html
I’m waiting for the Heritage Foundation excuses as to why this turned out to be nothing but a bigger welfare check for the wealthy.
Thanks for this link which begins with:
“Wisconsin’s sweeping tax credit that shields manufacturers and farmers from paying state income tax hits its apex this tax year following a three-year implementation plan of progressive rate hikes. The manufacturing and agriculture tax credit reaches 7.5 percent in the 2016 tax year, four times its rate three years ago. The credit is among the broadest on the books in Wisconsin and has drawn ire from those who say it boosts the state’s richest at the cost of investing in other public services including universities and roads. It is widely heralded among businesses groups who say it has given the state an advantage in attracting job-creators to the state’s largest industry sector and enabled businesses to grow.”
A big give away for the wealthy! Of course supporters pull the job creators canard. Menzie’s post suggest the amount of job creation was zero.
Off-topic This is completely unrelated to the blog post, but I do like to put up comments with information that might be useful or fun for Menzie’s more regular readers, as kind of a supplemental thing to let them know there’s much to be learned on this blog. China is confusing to many people, for good reason, because it’s a very complex place. This “infographic” is something I found via Twitter and a guy named Anthony Cheung, and I think it helps alleviate some of that confusion over how China does things.
http://fairbank.fas.harvard.edu/wp-content/uploads/2017/10/Pre-19th-Party-Congress-Infographic.pdf
Interesting.
Newly-released QCEW shows that Walker Admin overstated manufacturing jobs by nearly 13,500 before the November elections.
https://jakehasablog.blogspot.com/2019/03/confirmed-walker-admin-overstated-wiss.html?m=0
In addition, Wisconsin continued to have the lowest avg weekly manufacturing wage in the Midwest.
Yeah, I think $280 million a year can be used in a more productive way in Wisconsin.
[ in angry tone ] Alright Mister!!!! Quit trying to fly your kite with Menzie’s wind!!! (teasing/joking). Yeah, interesting stuff, thanks for the link. I got your RSS feed but sometimes don’t check on all of them.
No surprises via the Walker policies, but still good to have it verified with the data and math. FACTS we used to call them I think. Some of us old white guys like those.
Perhaps part of the difference can be explained by the type of manufacturing done in each state and where the national growth sectors are (figure 2):
Minnesota: https://www.nam.org/uploadedFiles/NAM/Site_Content/Data-and-Reports/State-Manufacturing-Data/State_Manufacturing_Data/January_2018(1)/Manufacturing-Facts—Minnesota.pdf
Wisconsin: https://www.nam.org/uploadedFiles/NAM/Site_Content/Data-and-Reports/State-Manufacturing-Data/State_Manufacturing_Data/January_2018(1)/Manufacturing-Facts—Wisconsin.pdf
Just suggesting that the growth opportunities for computer and electronic manufacturing might be greater than construction equipment and motor vehicle parts.