The gap between long-term and short-term interest rates has narrowed sharply over the last year and is now dipping into negative territory. Historically that’s often been a signal that slower economic growth or even an economic recession could lie ahead.
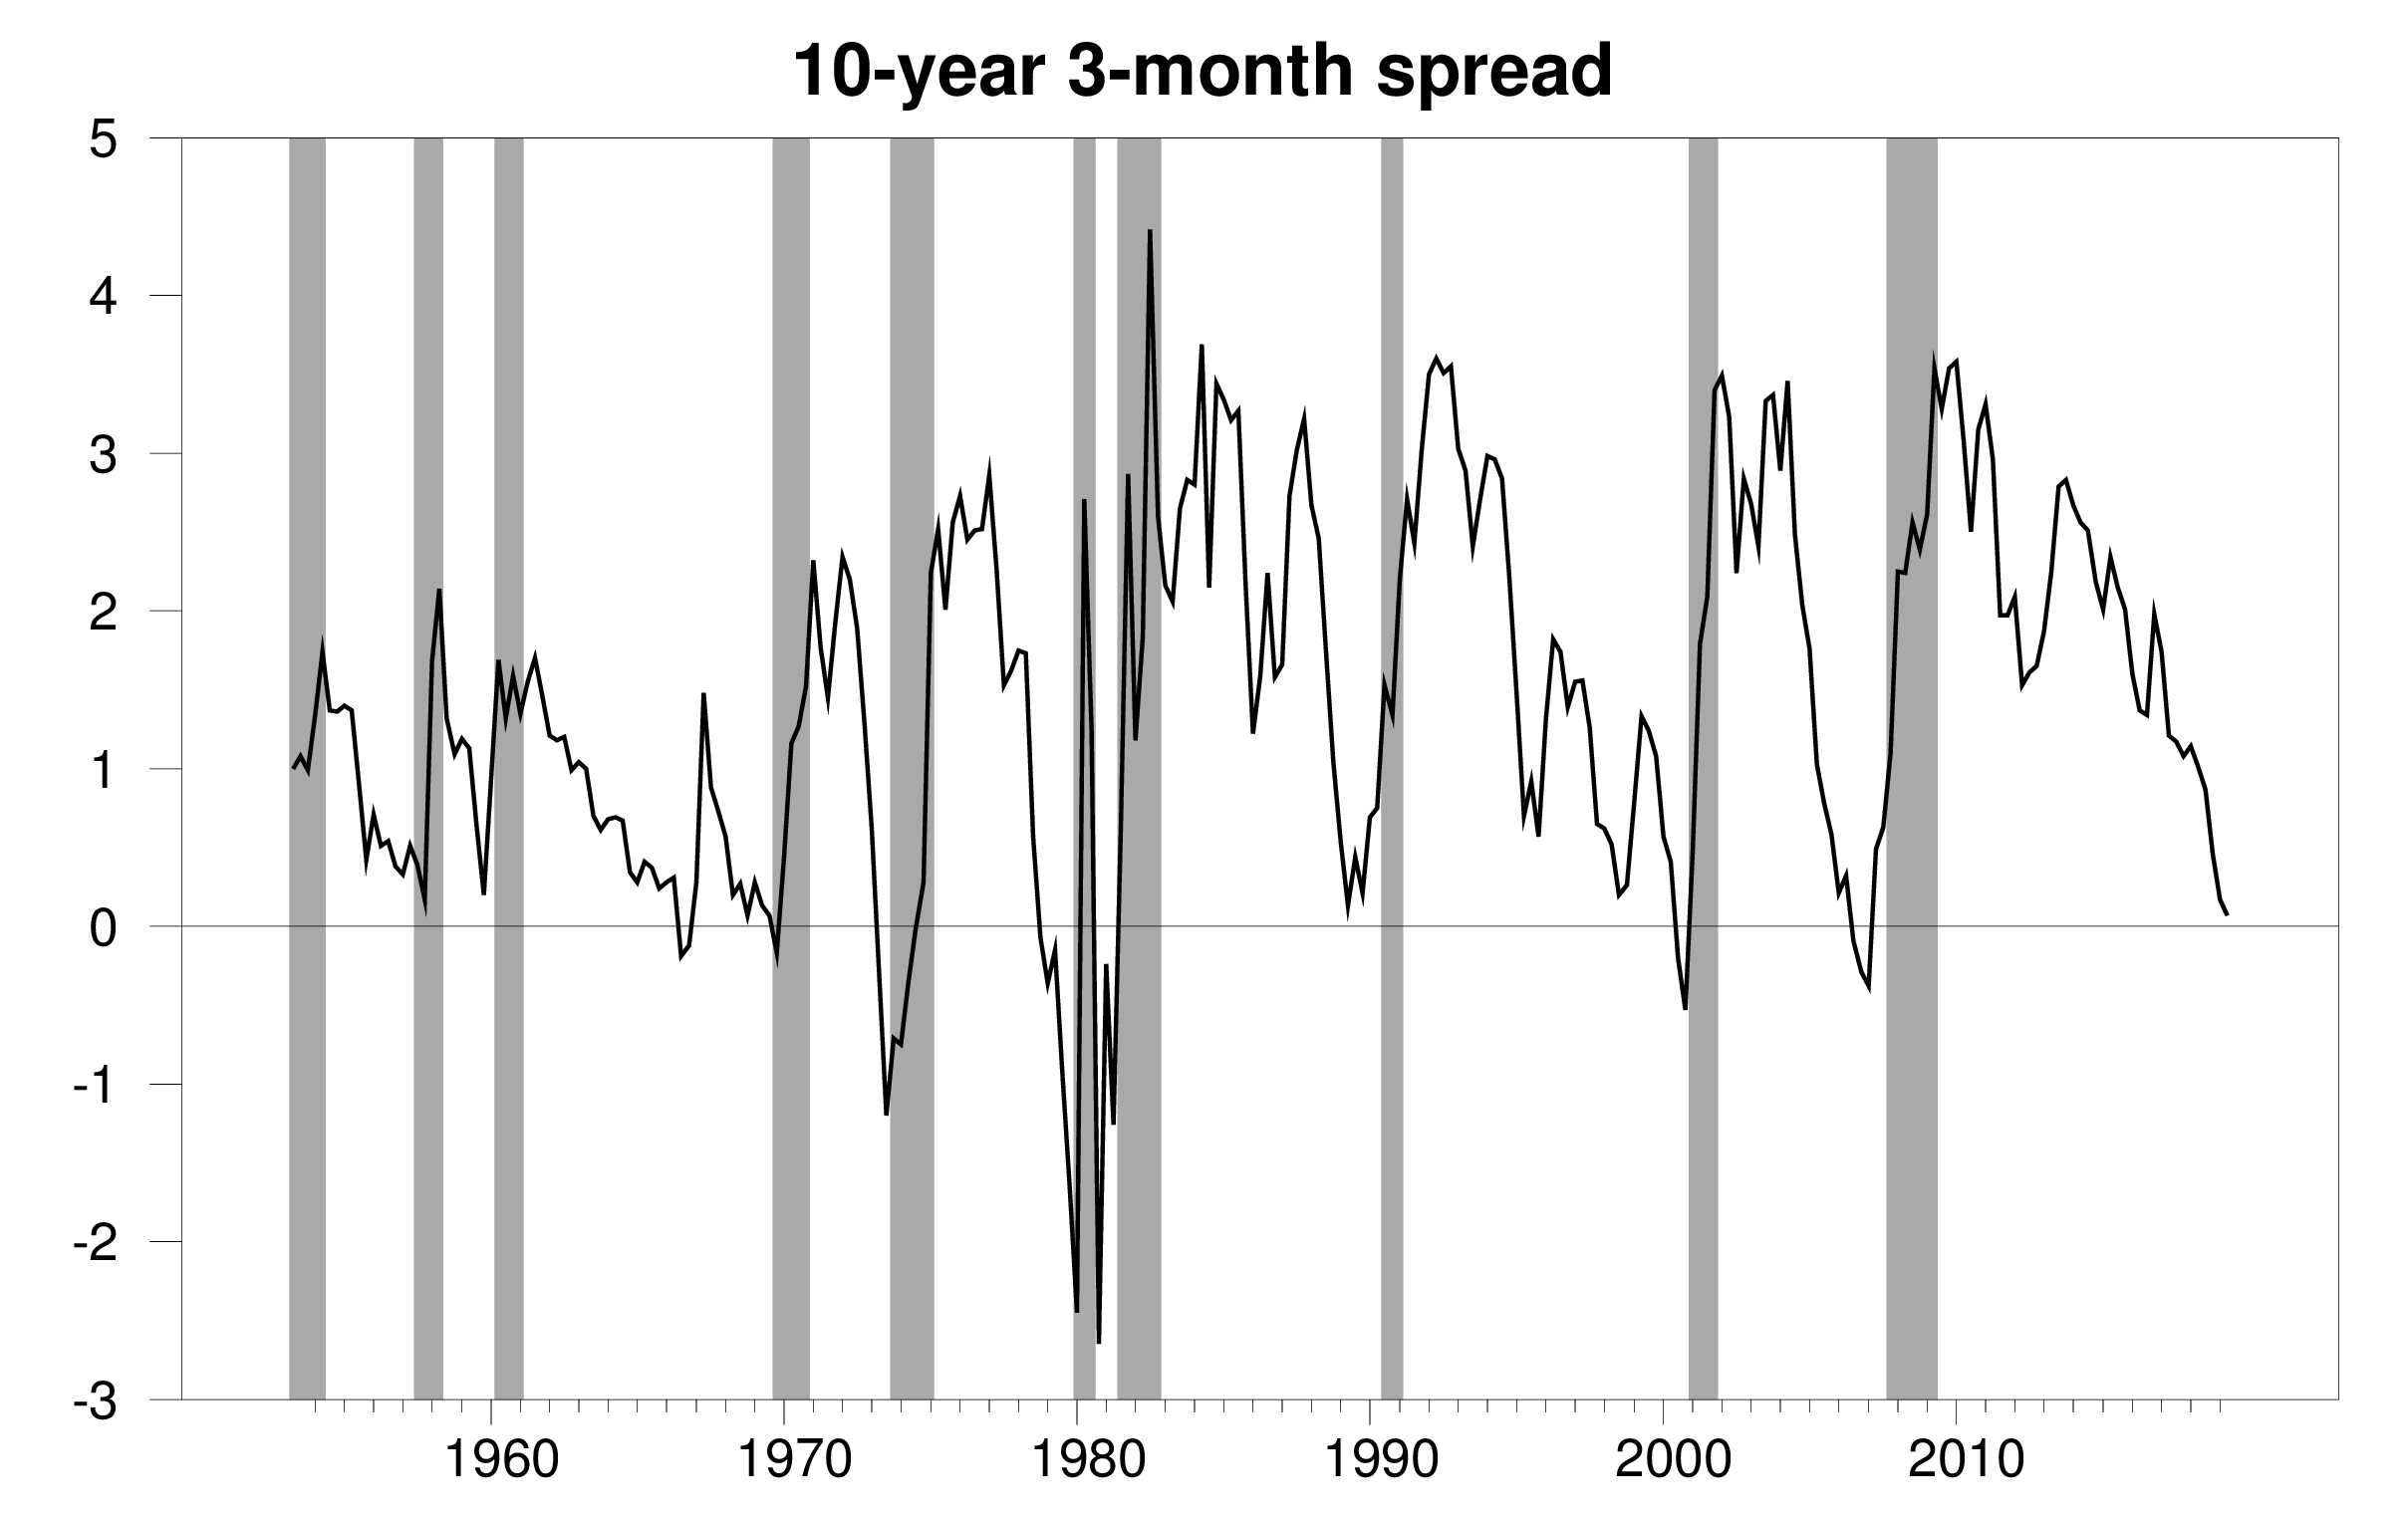
Gap between average interest rate on 10-year Treasury bond and 3-month Treasury bill during the last month of the quarter (1953:Q2 to 2019:Q1) and May 1-24 for 2019:Q2. NBER dates for U.S. recessions shown as shaded regions.
This relation is sometimes summarized with a regression that tries to predict average real GDP growth over the next year as a function of recent GDP growth rates and the current interest-rate spread (t-statistics in parentheses):
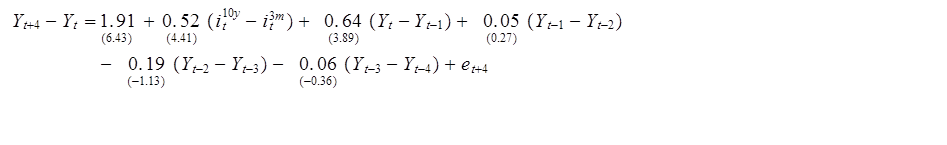
Here Yt is 100 times the natural log of real GDP in quarter t and i10y and i3m are the 10-year and 3-month interest rates, respectively. The coefficient of 0.52 on the interest-rate spread means that the fall in the spread of about 200 basis points since the end of 2015 would lead us to expect about 1% slower GDP growth over the next year than we otherwise would.
The picture is pretty scary. But the graph invites us to conclude that a positive spread between long-term and short-term rates is the normal condition, and that it’s an unusual situation if the spread disappears. The historical experience is certainly consistent with that conclusion; the spread has averaged nearly 150 basis points since 1952. A positive average spread means that investors will usually earn a higher return by holding long-term bonds rather than short-term bonds, presumably as compensation for some kind of risk.
Modern finance theory interprets risk premia in terms of the covariance of the asset’s return with other developments that affect investors’ overall income. In the 1970s, inflation was a key risk factor for bonds and other assets. Most assets, and bonds in particular, did poorly in response to the inflation shocks of the 1970s. In that environment, bonds did especially badly in the state of world when investors were most keen to preserve their wealth. That presumably was one factor in the extra compensation that investors demanded for holding long-term bonds in the 1970s.
By contrast, in the current environment, an important risk factor is deflation. A downturn in global real economic activity that brings inflation down will hurt almost every investment you could make, with one exception– long-term bonds will do well. By investing in long-term bonds, you’re actually buying insurance against a possible bad outcome on other investments. If bonds pay off in the one state of the world where you really want to preserve your wealth, they might actually offer a lower expected return than an investment like a short-term Tbill, if people are willing to sacrifice some expected return in order to have insurance against a deflationary shock.
If you have a model that predicts future interest rates, you could use it to calculate the term premium, defined as the extra return you can expect to earn from holding long-term compared to rolling over short-term securities. Of course, that calculation is very sensitive to the model that you use to predict returns. One model that’s very popular among academic researchers and practitioners was developed by Tobias Adrian, Richard Crump, and Emanuel Moench. One reason for its popularity is that anybody can download daily updates. Below is a plot of the Adrian, Crump and Moench estimate of the term premium on 10-year Treasury bonds. It was very large and positive in the 1970s. In other words, this was a period when, according to the model, on average you’d do much better investing long term. But the term premium has become negative in the most recent data. According to the model, your expected annual return today is actually higher if you buy a Tbill rather than make a long-term investment.
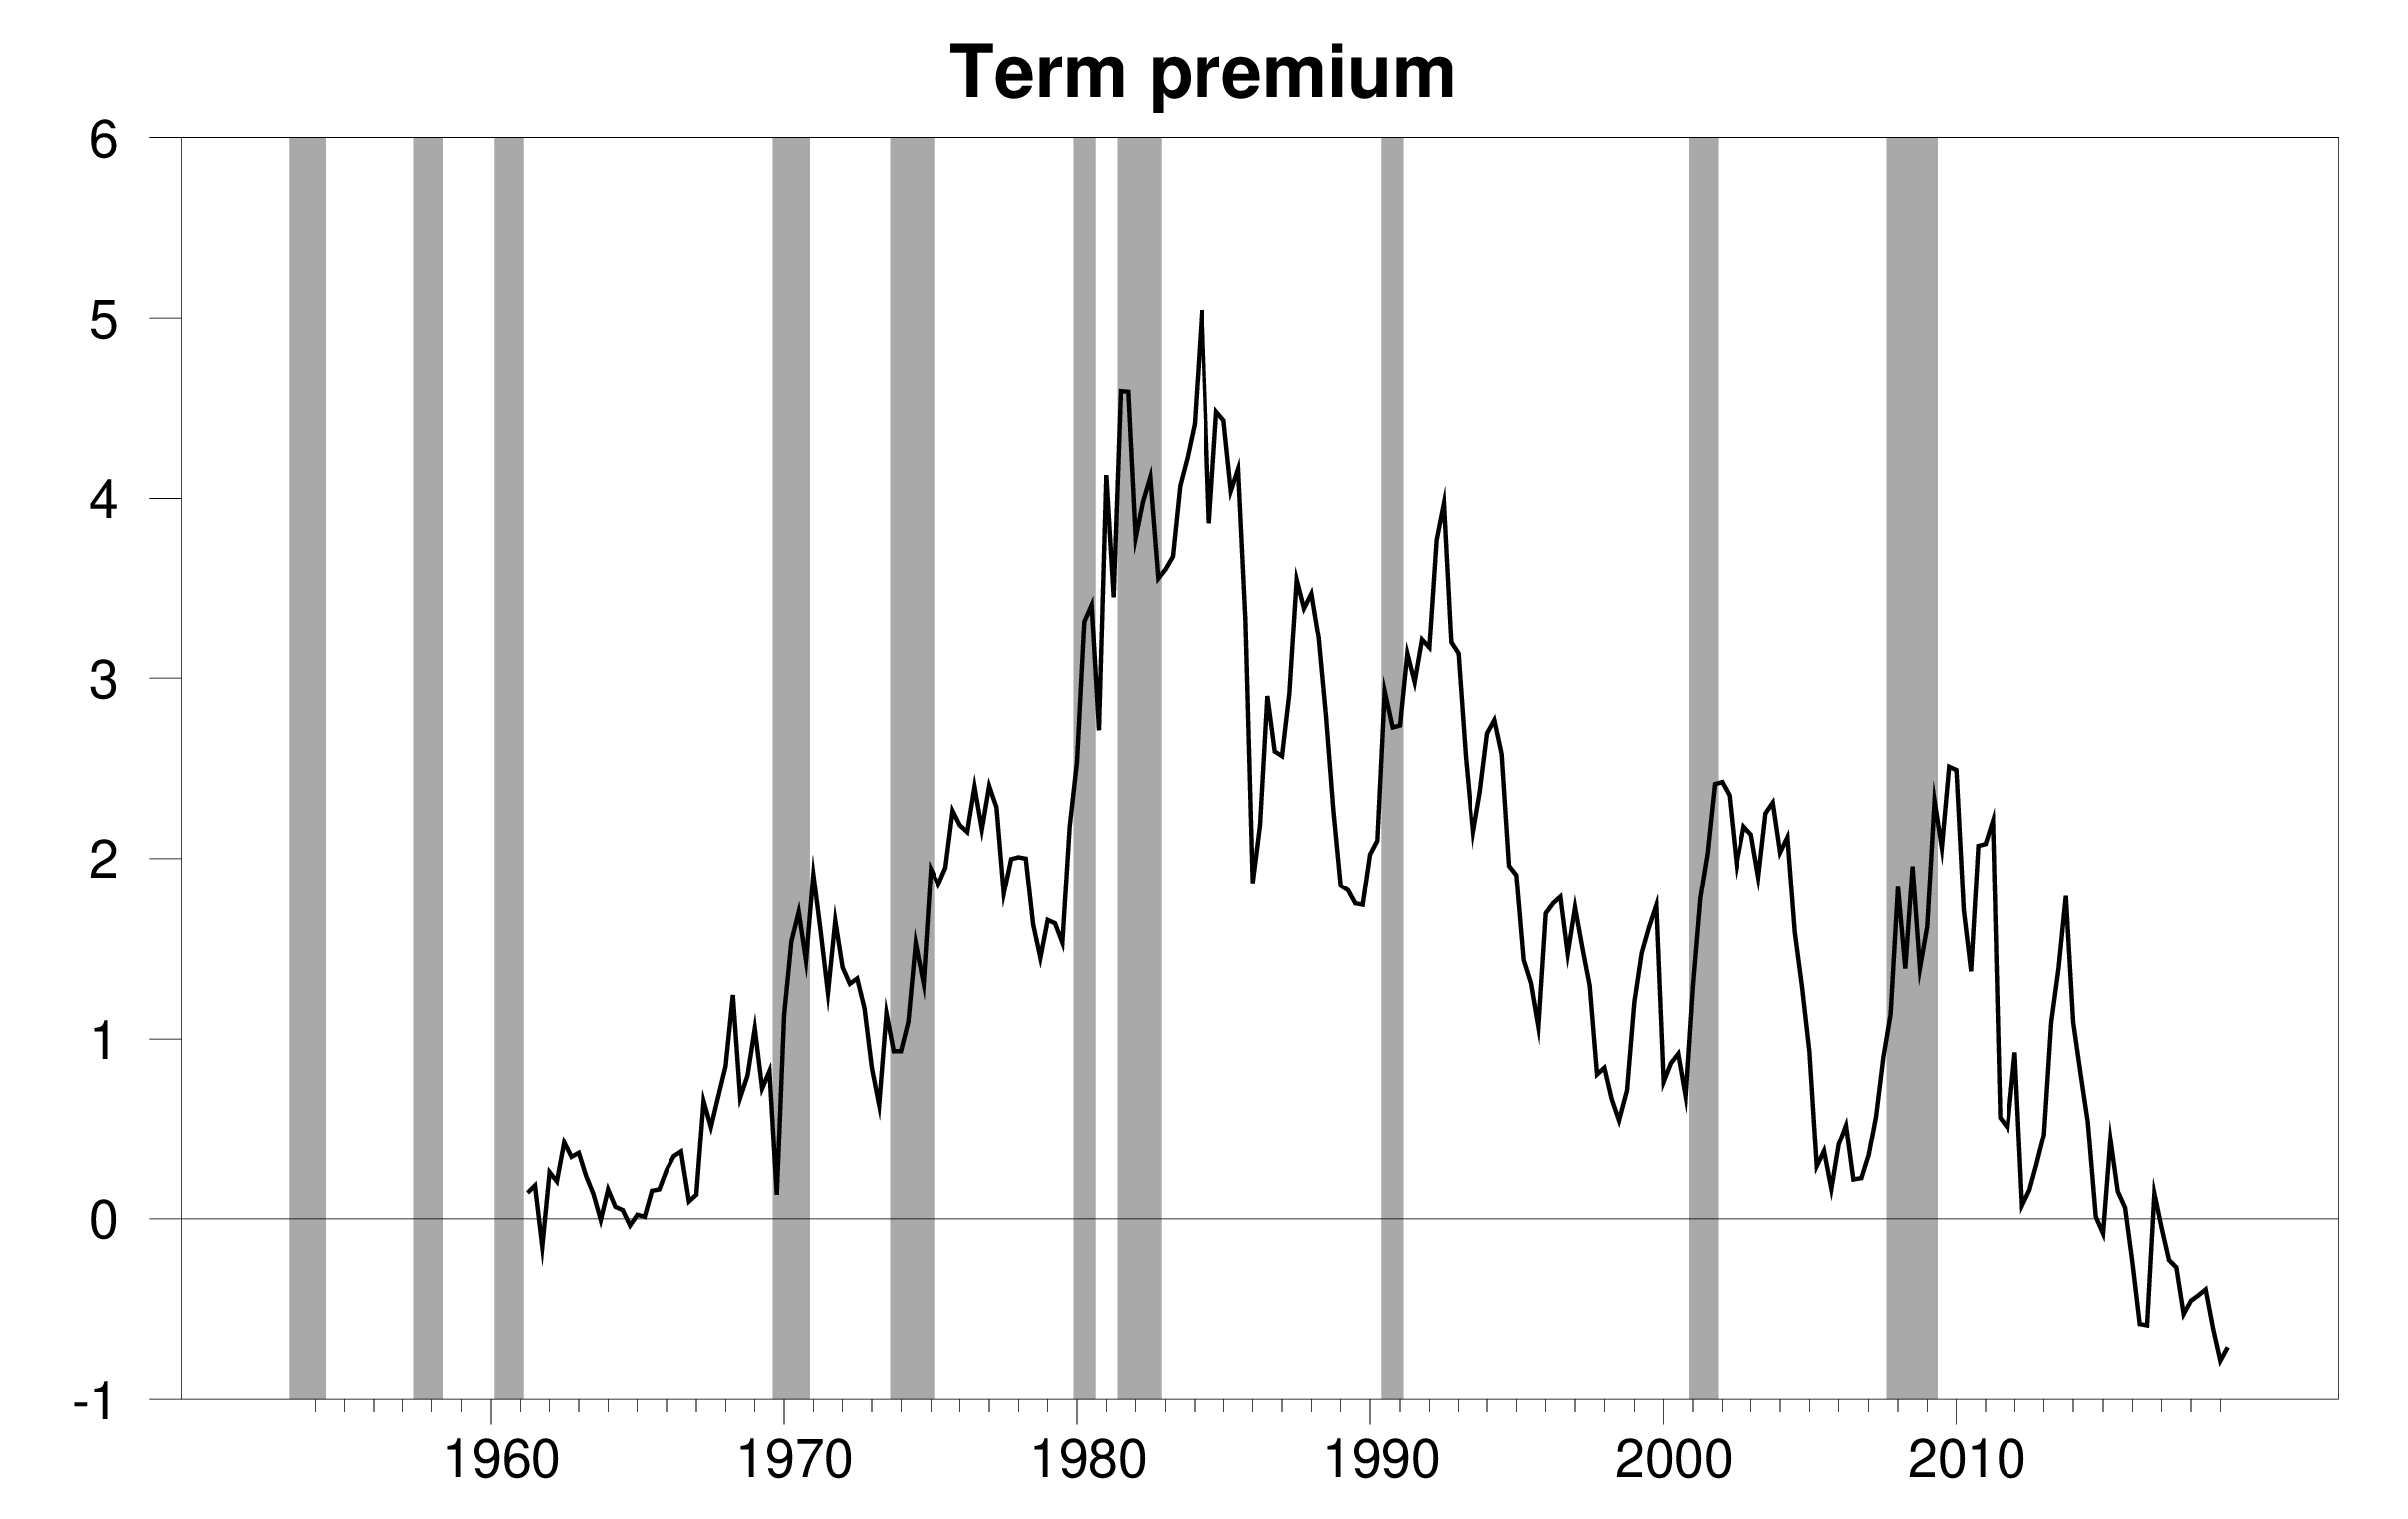
Term premium on 10-year U.S. Treasury bond during the last month of the quarter (1961:Q2 to 2019:Q1) and average over May 1-24 for 2019:Q2. Data source: Federal Reserve Bank of New York.
One way to investigate the importance of this issue is to estimate the regression above not with the full sample of data, but instead with a subsample of the most recent 10 years of data observed as of the year before date T + 4 for T + 4 running from 1963:Q2 through 2019:Q1. The coefficient on the spread in these regressions is plotted in the graph below. The spread was a much more useful predictor of GDP growth in the 1970s than it has been over recent decades.
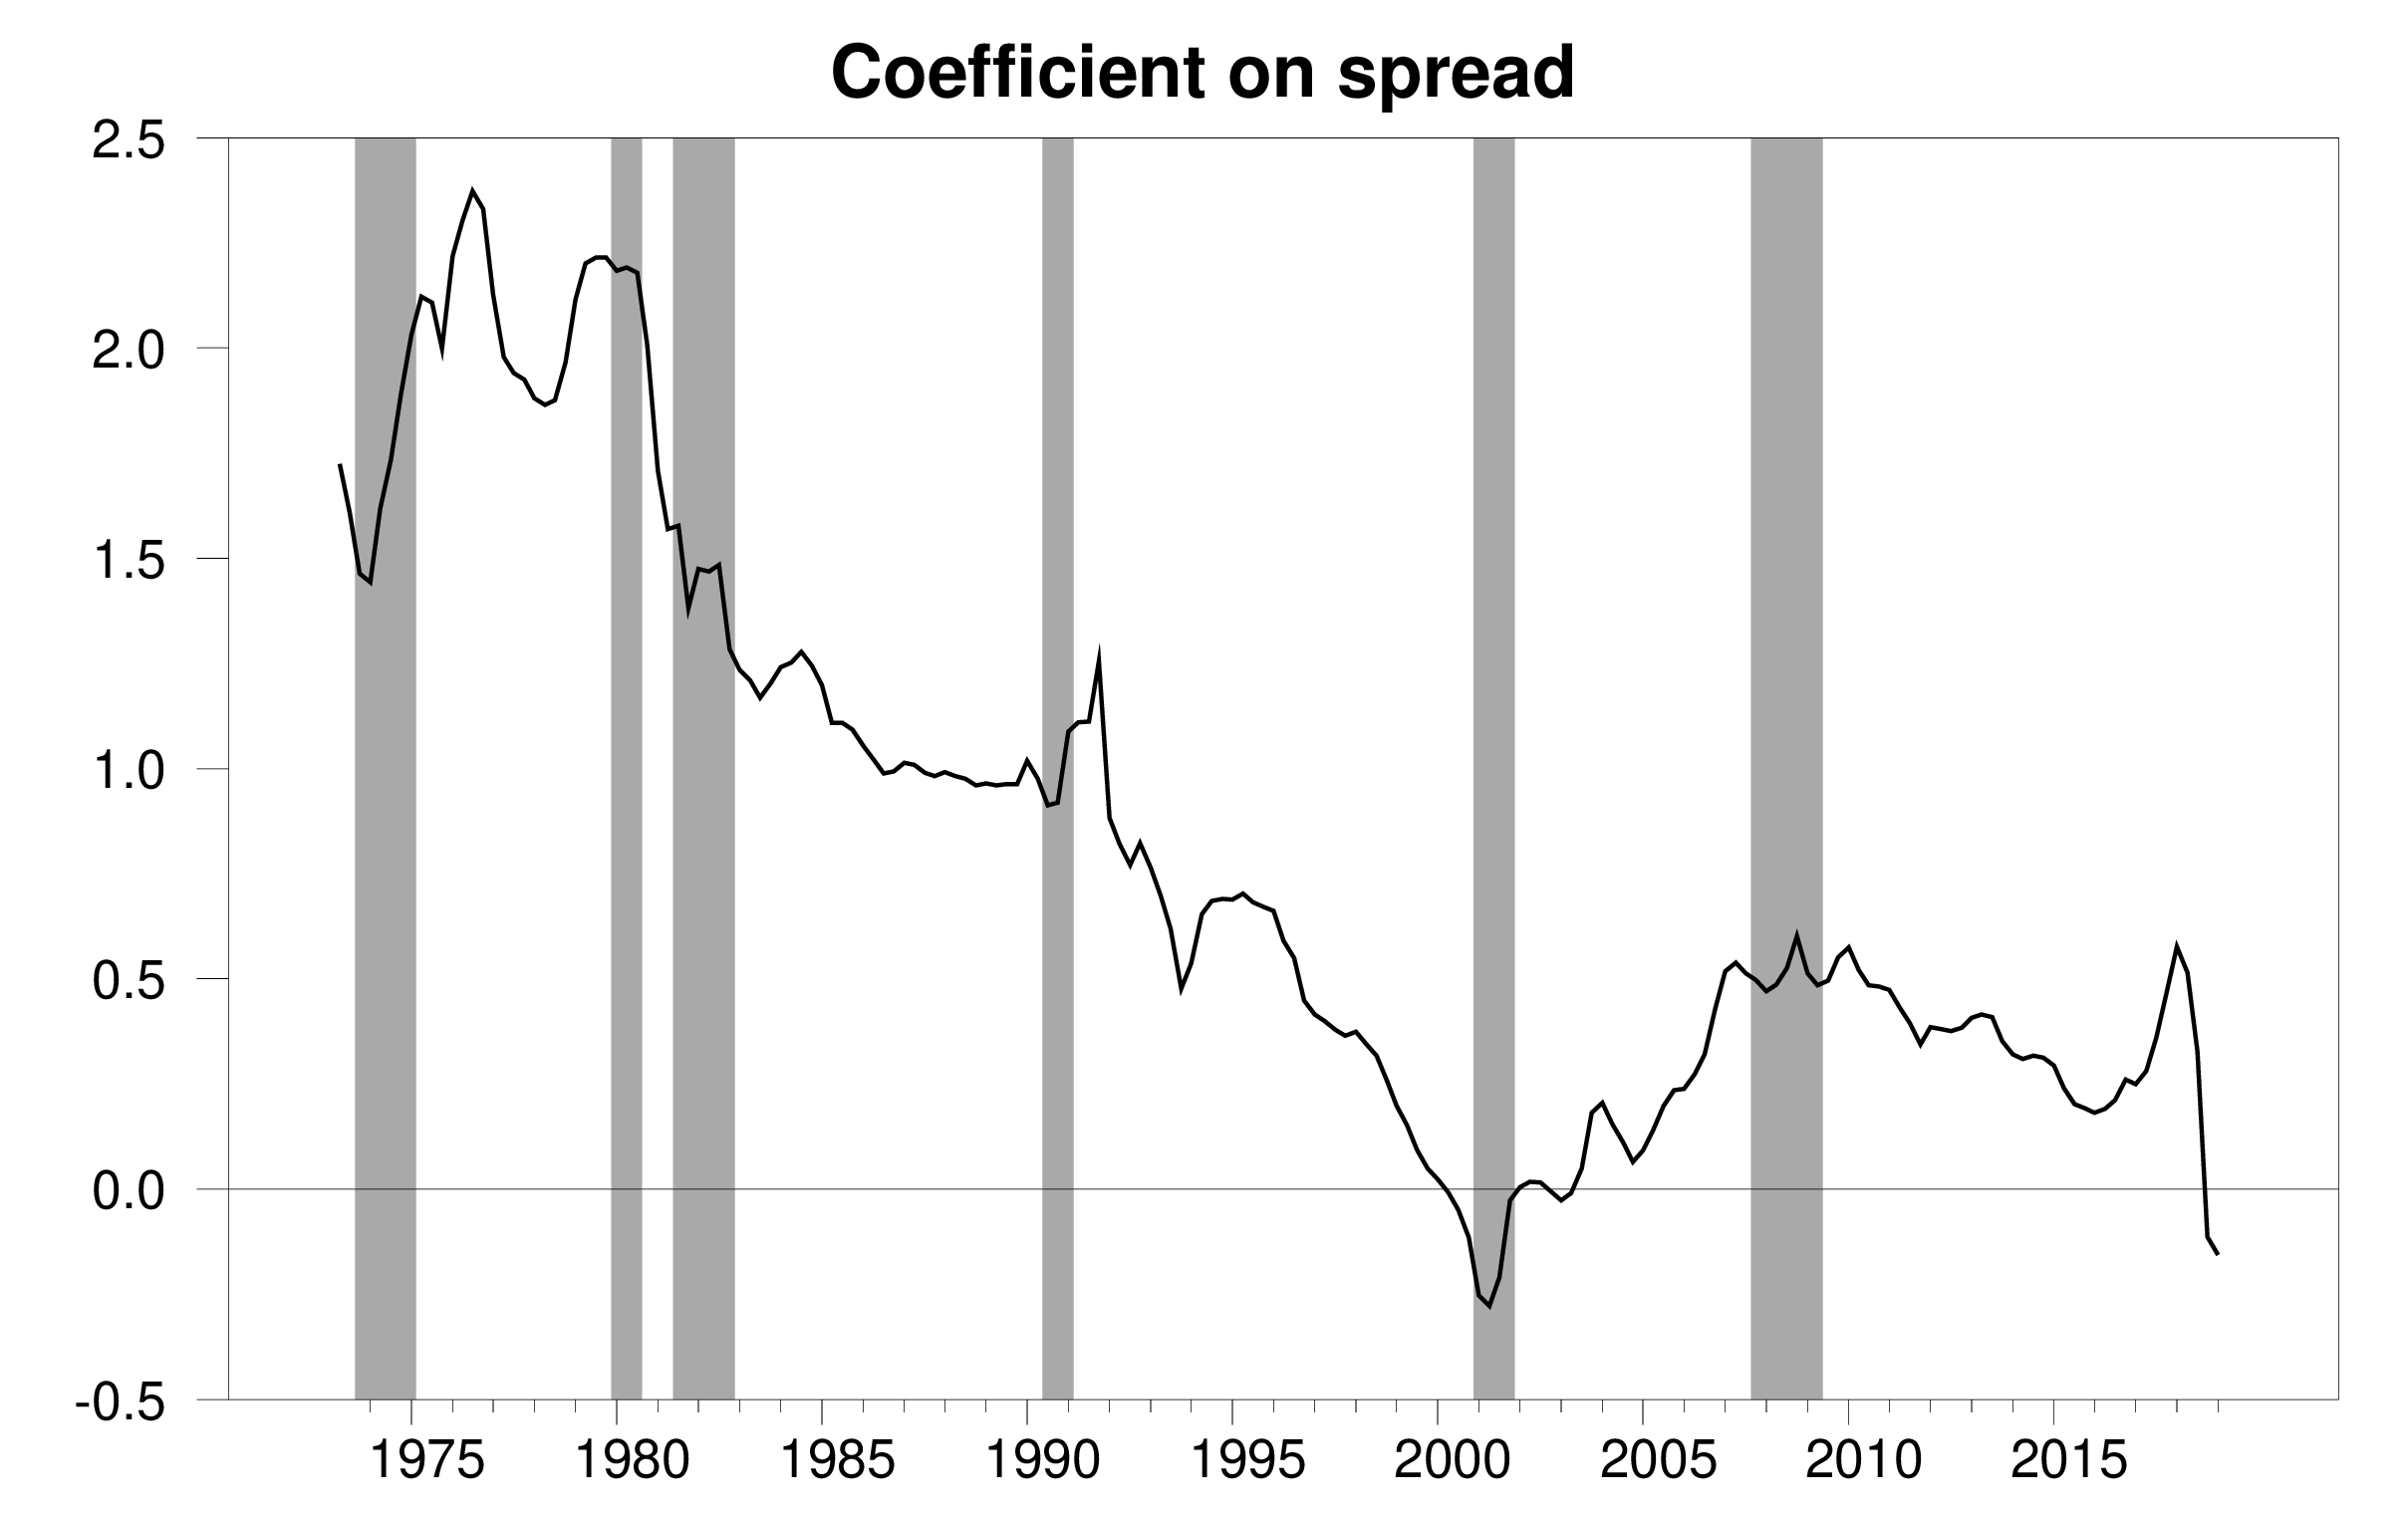
Coefficient on spread for regression using the most recent 10 years of data as of each indicated date.
In fact, if you used only the most recent observations, the coefficient is actually negative. Taken literally, it means that when the yield curve inverts you’d actually expect faster GDP growth. However, the effect is completely insignificant statistically.
Another way to express this visually is to subtract the term premium from the spread, as is done in the graph below. This measure reached negative territory before each of the last 6 recessions. But we still have another 80 basis points to go before we get there this time around.
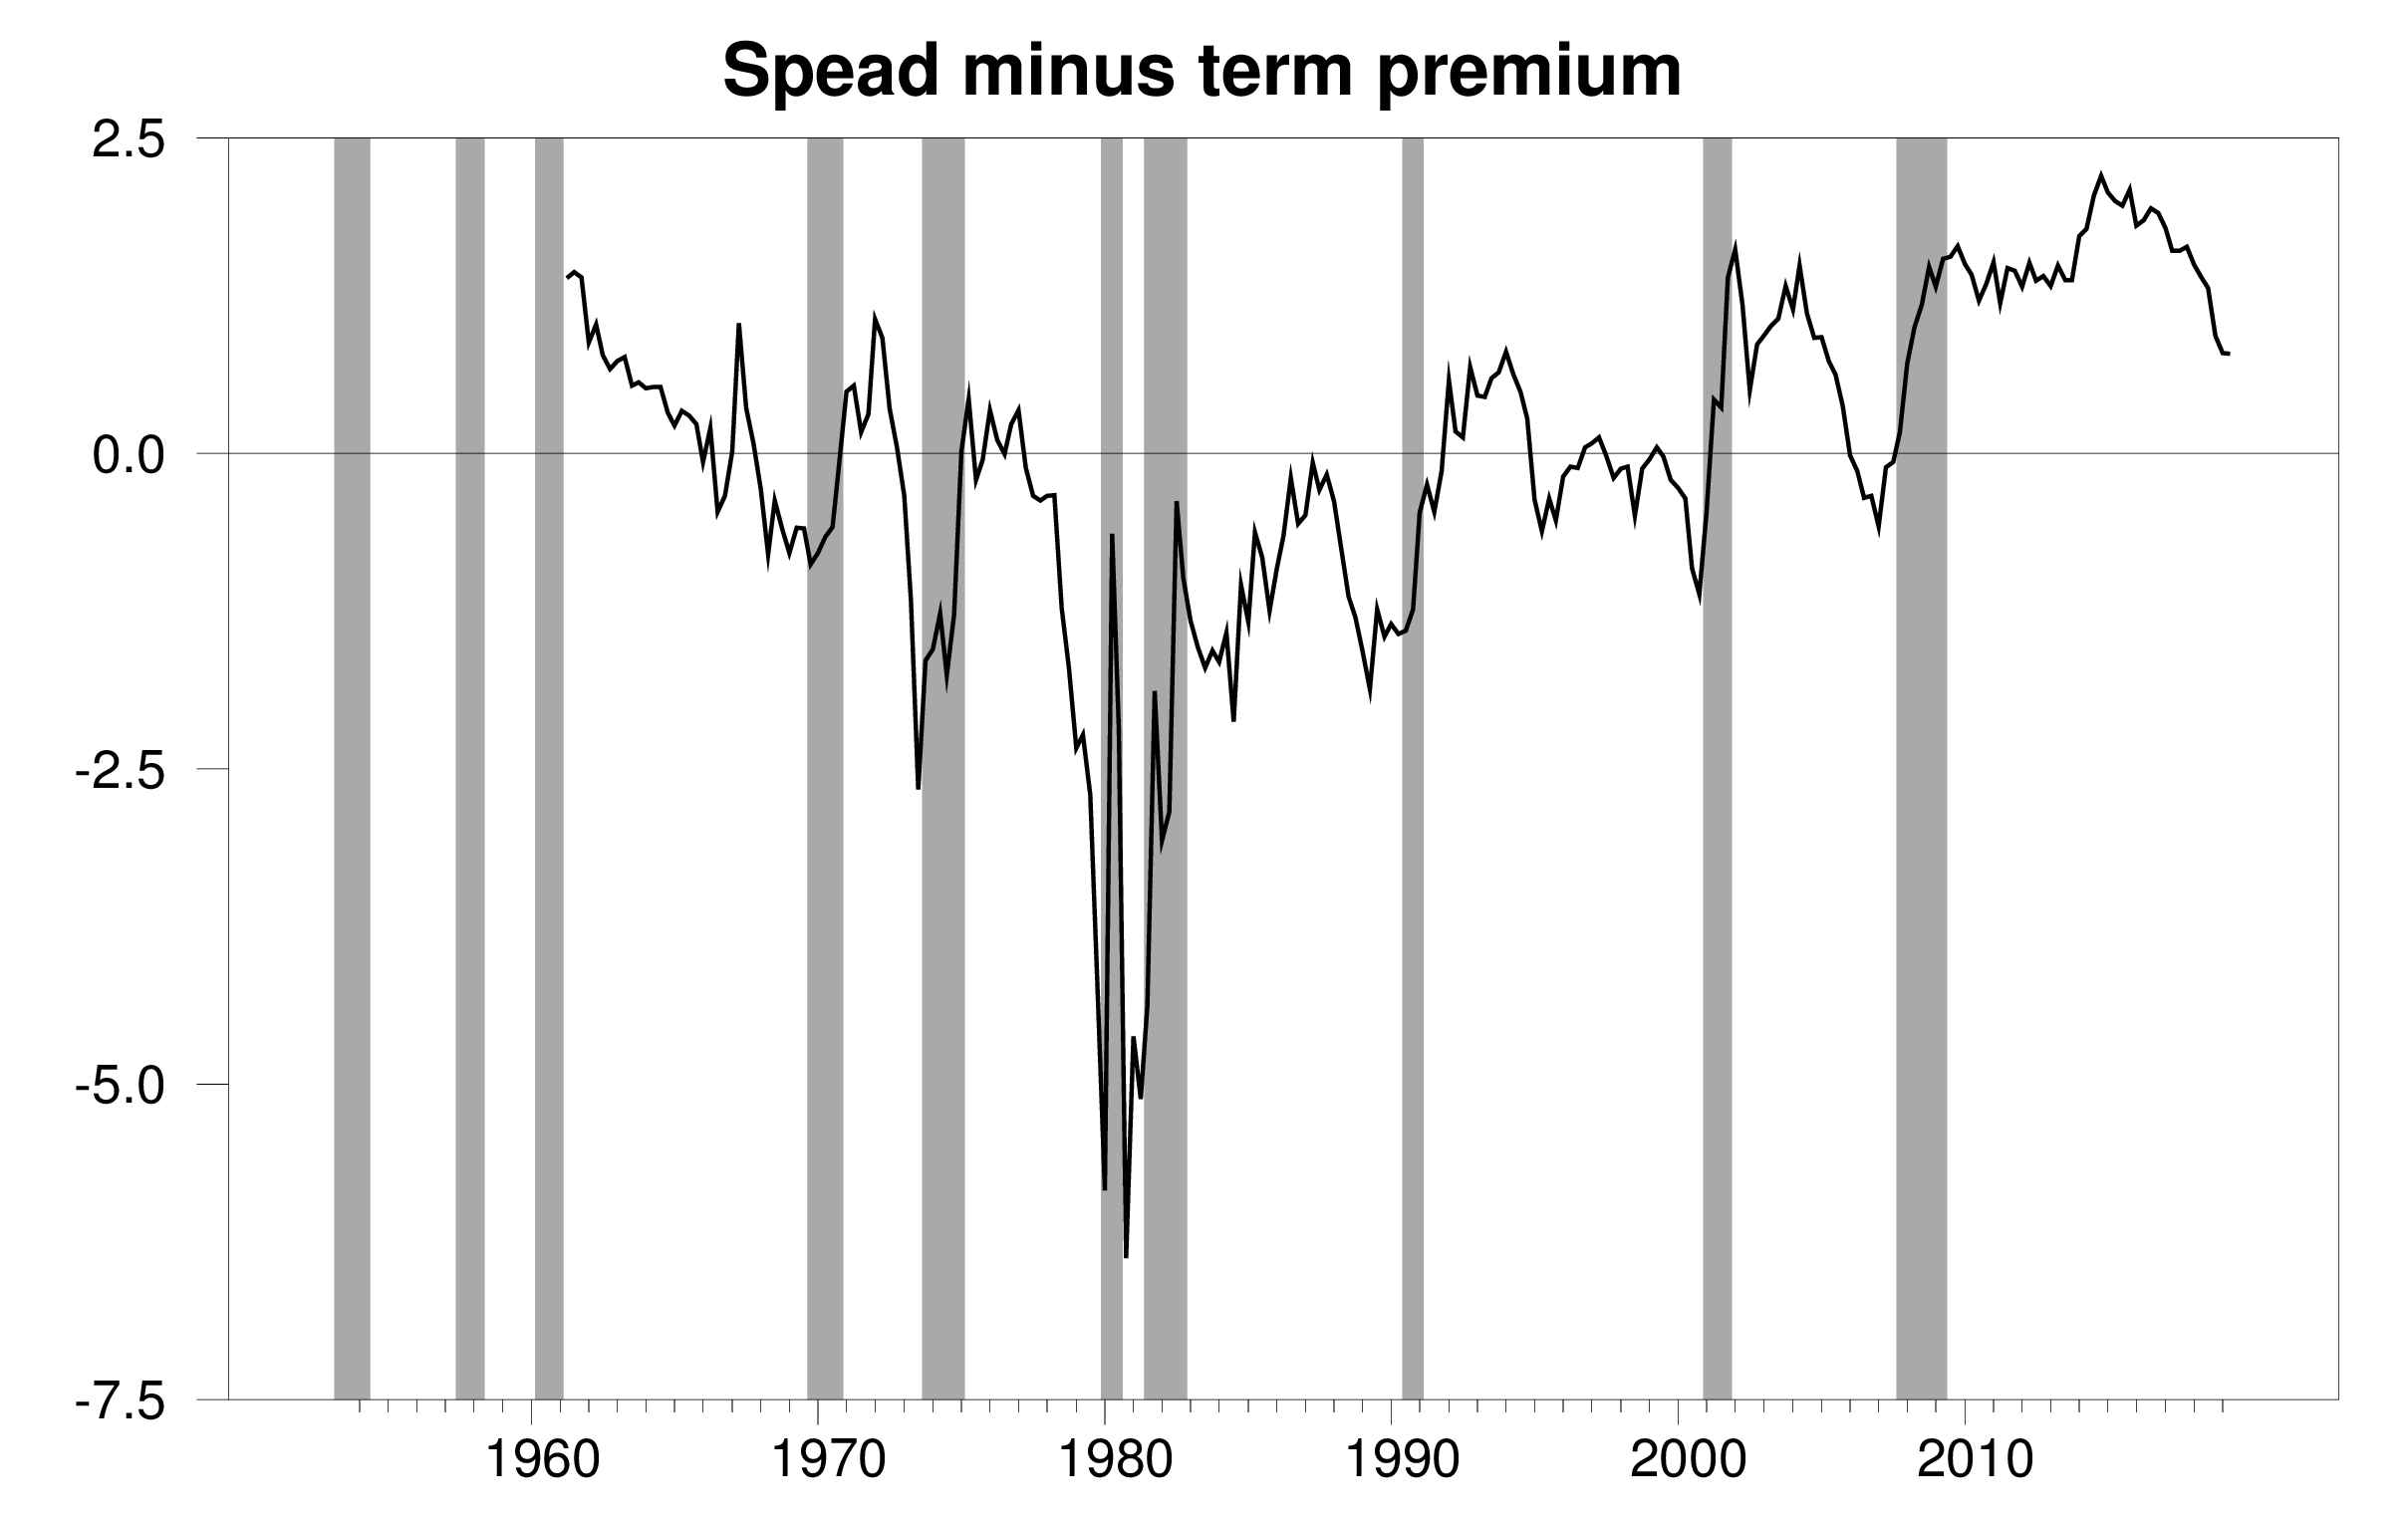
The graph plots the difference between the variables plotted in the first two graphs, with i10y in the first graph replaced by the predicted 10-year rate from the ACM model.
Let me emphasize that I do not believe the negative coefficient in the most recent data, and I think it would be imprudent to completely dismiss the evidence from the first graph and the full-sample regression. The current flat slope of the yield curve may well signal slower growth during 2019. But it is not as clear and not as dire a signal as some analysts might have you believe.
Great post, and great links. Interesting* even.
*All bad and groan worthy puns are copyright of Degenerate Slacker White Dude LLC
No joke, appreciate the post, has some insights.
Carefully and cautiously and reasonably presented and summarized, Menzie. Congratulations.
* Jim
Barkley
Except that this post was JDH’s, not Menzie’s. Must be that creeping Pelosi dementia! 🙂
Oooops! Yes. Thank you, Jim. Sorry about that. Yes, that dementia may be galloping rather than creeping…
Hamilton
From a yield curve junkie down under if the inversion occurs because the central bank is raising the short term rates then expect a slowdown at the very least. however if the inversion occurs because ten year bond yields have fallen below short term bills then take a bex because not much wil occur
Is an inversion in a low rate economy like we have now more significant than an inversion in a high rate economy? I can think of reasons either way. In addition, looking at the charts, it occurs to me that the economy now is more like it was in the 1960s than in more recent times. We are into a rate spread that preceded several recessions in the late 1950s and early 1960s.
JDH Your last graph looks more than a little weird. The spread is negative throughout the entire 1980s and is negative through the latter half of the roaring 1990s. Also, the regression strikes me as a bit peculiar as well. The GDP values represent the log of real GDP, but the interest rates are all nominal rather than real. So the higher the expected long run inflation the greater expected GDP growth is one year from now. Okay, but if this is a commonly used approach to relating GDP growth to interest rate spreads, then presumably rational actors would also use this regression to anticipate a Fed rate hike, which would affect the interest rate spread and next year’s GDP growth rate. It’s also not clear what time “t” actually represents. The “t” in GDP obviously represents the quarterly GDP growth rate and there’s only one of those per quarter. So that’s unambiguous. But the “t” in the interest rate is unclear. Does it represent some kind of average spread or a closing period spread or a weighted average of Treasury transactions, or something else? There can be quite a bit of spread in the spread over 90 days. Also, the last three GDP growth rates on the right hand side don’t add any value to the regression. It basically comes down to the current period’s growth rate (i.e., Yt – Yt-1) plus a constant (so far a random walk plus drift) plus the interest rate spread at some ambiguous time “t” within the last 90 days and the usual error term. Without looking at any diagnostics, my initial reaction is that it just doesn’t seem like a very convincing regression. And quarterly GDP data is really noisy, which is bad since the last three quarterly rates on the RHS of the regression do almost nothing to dampen that noise. The coefficients are small and the t-statistics are insignificant. And what should we make of a constant of only 1.91 and a tight t-stat of 6.43? Wouldn’t you expect the constant to be closer to the long run average GDP growth rate?
The regression is also a very different approach from the kind of thing that Menzie’s been doing. The regression tries to predict growth rates, which has the nice advantage of not being binary and is sensitive to the difference between an outright recession and slow growth but not quite a recession; e.g., the kind of thing we saw in 2015/2016. OTOH, the advantage of a probit or logit approach is that you end up with probabilities of a recession, which gives you a different intuition from the GDP growth rate regression.
2slugbaits: (1) When you subtract a positive number like 4 (the term premium in 1981) from a positive number like 2 (the spread in 1981) you get a negative number like -2 (the value plotted in the last graph for 1981). I guess you are saying that you think the ACM conclusion that the term premium was 4 in 1981 is too big a number. (2) As stated in the post, it is the average interest rate during the last month of quarter t. (3) The explanatory variable is not the nominal interest rate but the difference between two nominal interest rates. You’re correct to think this has something to do with expected changes in future inflation. You’re incorrect to think that expected changes in future inflation should be unrelated to real variables. The Phillips Curve, for example, is often viewed as a relation between the change in the inflation rate and the level of unemployment. (4) The intercept in a regression of y on x is not the average value of y but the average value of y minus b times the average value of x. (5) The regression is of course essentially identical when the additional lags of GDP growth are dropped.
JDH Thanks for clarifying the interest rate as being the average over the last quarter. I see that now in the caption.
I might not be understanding your Spread minus term premium graph, but the paragraph immediately above the graph says “This measure reached negative territory before each of the last 6 recessions. But we still have another 80 basis points to go before we get there this time around.” And it does look like the graph fell into negative territory shortly before those recessions. But unless I’m misunderstanding, it was also negative during some of the economic booms of the 80s and 90s. Doesn’t that call out for an explanation?
(3) The explanatory variable is not the nominal interest rate but the difference between two nominal interest rates. You’re correct to think this has something to do with expected changes in future inflation. You’re incorrect to think that expected changes in future inflation should be unrelated to real variables.
I probably didn’t make myself clear. What I was getting at was that we should probably expect some reaction from the Fed to slow economic growth if the term spread indicates inflation ahead? If the spread suggests higher expected growth and an uptick in inflation, then wouldn’t you expect the Fed to then act to narrow the spread by raising short term rates? I’m definitely not arguing that expected changes in inflation are unrelated to real variables; in fact, I’m arguing that the expectation of expected Fed actions is likely to confound the relationship between term spreads and real variables. If the kind of regression you posited was well known, then presumably rational actors would be a step ahead, which might defeat the predictive power of the regression.
(4) The intercept in a regression of y on x is not the average value of y but the average value of y minus b times the average value of x.
Right, but if the average value of “x” is close to zero, then “b” times “x” is even closer to zero if “b” is less than 1.00. I was just doing some quick back-of-the-envelope sanity checks. On the face of it you wouldn’t expect the 10yr/3mon spread to have the strong effect needed to get you to the long run real GDP growth rate of ~2.8% since 1952 given that the long run average spread was 150 basis points. A coefficient of 0.52 was unexpectedly large. My naïve expectation would have been that the intercept would have gobbled up more of the 2.8% average growth rate with a much smaller 10yr/3mon coefficient.
2slugbaits: I guess you may be saying that the usual spread (the variable in the first graph) looks like a better predictor of recessions than the spread adjusted for the term premium (the variable in the last graph) due to false positives of the latter in the 1980s. I’m not claiming that either one is a completely reliable predictor. My position is that that the apparent reliability of the usual spread is spurious. The relation is not stable over time, and I think this is because it depends in part on the role of the term premium, whose behavior has changed a great deal over time.
On (3), this is simply a forecasting relation. If the Fed changes its behavior over time, that’s another reason why the forecasting relation may not be stable.
On (4), check your math. The average 4-quarter GDP growth rate is 3%, the average 1-quarter growth rate is 0.75%, and the average spread is 1.5%. 3 – (0.5)(1.5) – (0.64+0.05-0.19-0.06)(0.75) = 1.91.
By the way, I perhaps should have said that the basic regression whose stability I explore has been used in many, many studies going back a long, long time. Here are a few:
Bonser-Neal, Catherine, and Timothy R. Morley. “Does the Yield Spread Predict Real Economic Activity? A Multicountry Analysis.” Federal Reserve Bank of Kansas City Economic Review”, (Third Quarter 1997), 37-53.
Dotsey, Michael. “The Predictive Content of the Interest Rate Term Spread for Future Economic Growth.” Federal Reserve Bank of Richmond Economic Quarterly 84 (Summer 1998), 31-51.
Haubrich, Joseph G., and Ann M. Dombrosky. “Predicting Real Growth Using the Yield Curve.” Federal Reserve Bank of Cleveland Economic Review 32 (First Quarter 1996), 26-35.
Kozicki, Sharon. “Predicting Real Growth and Inflation with the Yield Spread.” Federal Reserve Bank of Kansas City Economic Review 82 (Fourth Quarter 1997), 39-57.
JDH Thanks for the publicly available references. For the GDP growth rate I just did a quick and dirty look at the long run annual growth rate between 1952 and 2018; i.e., I just took the 66th root of the difference between the 2018 and 1952 GDP values. I did not take an average of the quarterly rates. For my purposes I was less interested in an exact number than in a ballpark number. My intent was to question the magnitude of the coefficient for yield spread because it seemed to exert a lot of leverage in predicting the year ahead GDP. The naïve expectation is that a variable that exerted that kind of forecasting influence should be a fairly reliable predictor. The higher GDP growth rate of 3% only worsens that concern. For convenience I ignored the last three terms based on the insignificant t-stats.
I’m not claiming that either one is a completely reliable predictor. My position is that that the apparent reliability of the usual spread is spurious.
Yes. I don’t have a lot of confidence in any of the models that connect yield spreads to recessions. Some of them work for a while, but then fail ever after. Over time we see different regimes (e.g., operation twist, QE, M2 targeting, interest rate targeting, etc.) at the Fed, so I would not expect a long run stable relationship between yield spreads and GDP. And surely the growing reliance upon overseas savings and sovereign wealth funds has affected the slope of the yield curve. Also, I don’t have a lot of confidence in models that work for one country but no other developed country. I can promise that if I ever stumbled upon a reliable way to predict recessions I would not share that knowledge with anyone.
If term premium is a reflection of a particular perceived risk – inflation in one period, deflation in another – then a yield spread ex-term-premium should (not is, but should) lead future real economic growth only to the extent that inflation and growth are positively correlated – I think.
Historically, inflation and growth have been positively correlated, but the correlation has been pretty variable – stagflation messes things up. Do we expect they will maintain a strong enough correlation that a term-premium-free spread will tell us much about the growth outlook?
It’s relatively safe to assume that when rates are higher (or at least “quite” high, as they were in the early ’80s) that the term premium is going to be larger as well, is it not?? Or is that some kind of “false assumption”??
agree, and it seems as though looking at the spread while accounting for the actual rate magnitude is necessary. with low rates, it seems to me you can have more things impact the spread going negative (and it could probably happen quicker, since the Fed moves in similar rate increments when it changes, irregardless of the actual magnitude of the current rate??-say .25% increments?). using the spread with both the term premium and current rate magnitude probably helps to understand the differences in low rate and high rate eras, rather than spread alone. as others have indicated, there is probably a difference in behavior from negative spread based on whether it occurs because the short term rises, or the long term drops.
@baffling
Thanks for the response. I find it mildly humorous, that I’m sure there’s a portion of readers on this blog are certain I view myself as a “know it all”, yet when I ask sincere/genuine questions everyone clams up.
I’m guessing when Professor Hamilton read that question he slightly cringed, as it’s probably way too general an assumption. For example why couldn’t you have an inversion when rates are high?? There’s probably no reason you couldn’t, and other factors like the business cycle would play a part, and there’s just so many variables. Still, in a general way, it seems it would be true. But it’s nice to see someone had similar thoughts and that I am not completely in a fantasyland chain of thought on this particular topic.
One of the reasons why I was asking was, it could help explain why you would have a term premium in 1981 of 4, which to some folks might seem very high, not viewed in the economic context of that particular time. My father was going through some tough times there personally, partly (though not all) related to some of these things, so I remember that time relatively clearly for that age.
Looking at the last graph, it looks like the spread minus the term premium had to be greater (in absolute terms) before it presaged a recession as you move from 1960 to 1980 (as inflationary expectations rose?), then smaller from 1980 onward (as inflationary expectations shrank?) so that the next recession could be presaged by a difference (spread – term premium) that is still positive.
Thanks to the blog authors engagement with commenters, is the reason I keep coming back. I don’t come back for the engagement of commenters with commenters. Sometimes some signal passes through but most of the time a high noise level.
If the value of long term bonds is that they provide a shield against a depression, then the relative value of long term bonds increasing indicates the market thinks a depression is more likely. Hardly a reason to say not to worry about a downturn.
That last graph is showing huge secular changes over time and that particular spread is not useful for predictions unless you can figure out a way to de-trend it. Something that “predicted” a depression from 1975 to 1992 and that the Great Recession was going to be a hiccup is not remotely accurate.
So, nothing here to change the usual interpretation that the yield curve inversion is a significant warning signal, but not a guarantee, for a downturn.
Faireconomist: You’re missing the subtle distinction between an objective expectation and a risk-adjusted price. The former is like a sample average, the latter is like a weighted average, where you put more weights on some possibilities than is warranted by the objective probabilities. I’m claiming that the market is putting more weight on the possibility of deflation than the objective probability, because investors are willing to lose money on average in order to be insured against one possible outcome.
It’s like when you buy an insurance policy. What you pay isn’t your expected loss from a fire. You pay the insurance company more on average than they pay you because you really need the money if your house burned down.
If there was no difference between an objective expectation and the risk-adjusted price, the series for the term premium that I plotted above would exactly equal zero at every date.
Or to put it another way, if all you care about is the objective expectation, there’s no way you should be buying long-term bonds at the moment. You’ll do better staying short-term if all you care about is expected return.
No matter how you slice it, you have to conclude that the market estimation of the chance of an economic downturn has increased substantially lately. That’s not a good thing.
Also, you’re saying that the price of long bonds was elevated before the inversions because – the market was worried that the chance of deflationary depression was already elevated. That’s not a good thing either!
The only thing you can extract is that, perhaps, the probability of having *some* slowdown is worse than with a comparable curve in the 20th century because the severity of a slowdown might be much worse today. To repeat myself, that’s not a good thing either.
Nobody says it’s an infallible predictor, and I think almost anybody would acknowledge that with big changes in the debt markets (massive central bank holdings, less borrowing from creditworthy companies, and the general asset overhang) an predictor based on the old situation is somewhat less reliable. But it’s still a strong signal.
Not exactly; if you think another great recession is likely in the near future the long term bonds make more sense (because you’re expecting short term rates to be 0 for years in the future). Based on what actually happened after the last market crash, expecting a full-on depression seems unlikely (the central bank controlled a really nasty financial crash) so it’s hard to see current long bond demand to be heavily influenced by a high likelihood of that. Much more likely would be something like 2008-15; and assuming the bond market is rational (iffy, I will grant) the current bond rates make sense only with a fairly high likelihood of that kind of scenario.
Fair Economist: Not necessarily. The long-term rate will fall if the risk-factor weighting on the probability of a downturn has gone up, even if the objective probability of a downturn has not changed. Take the model you are thinking of, in which asset values are calculated by taking each possible outcome, multiplying by the objective probability of that outcome, and summing across outcomes. Replace it by a model in which asset values are calculated by taking each possible outcome, multiplying by the product of the objective probability of that outcome with the marginal utility of a dollar if that outcome should occur, and then adding. The latter can change purely as a result of changes in marginal utility, without any change in objective probabilities. If you accept the ACM model (and I’m not saying you have to), all the movements you see in that graph of the term premium are coming from what amounts to changes in marginal utility.
You do exceedingly well pedagogically to spell it out like you did. That is the sign of a great professor.
I think what many people are missing (and I very shamefully confess as someone who majored in finance in college, but used the nuts and bolts rarely IRL, other than stock purchases) and I had forgotten myself is the term premium is in fact a “segment” or a “portion” of the spread. (OK Professor Hamilton, don’t tell anyone this guy with the finance degree confessed that sin, it’s our secret to eternity). I’m joking, you CAN post this.
You had said this much (basic textbook) on the blog before (probably enough you feel fatigued of), yes??
“Although it’s an attractive theory, the expectations hypothesis is certainly not a perfect description of long-term yields. We can define the term premium Tt to be the amount by which the long yield Rt differs from the quantity predicted by the expectations hypothesis:
Tt = Rt – Et(Xt,n).
It then follows as a matter of definition that the yield spread can be decomposed into an expectations component and the term premium:
Rt – rt = [Et(Xt,n) – rt] + Tt.
We might then ask, to what extent is the observed correlation between the yield spread (Rt – rt) and subsequent GDP growth coming from the expectations component (Et(Xt,n) – rt) and to what extent from the term premium (Tt).”
Now that’s a good reply Jim.
Thanks for the post. As always: you provide substance to think about.
The next recession is many years away, in case Bill McBride and myself are right; and Trump is not blowing up the machine with his foolish tit-for-tat trade-war revenge plots.
Jim, please write a post about your opinion rel. ‘Huawei ban’ and its probable effects, would be highly appreciated by many of your readers, I am sure, totally.
Here’s a taste. This move has “been in the works” for awhile, and I’m honestly surprised the Chinese Politburo didn’t make this move sooner:
https://www.youtube.com/watch?v=awiyD-39Jeg
You were wrong already. corporate debt peak looks reached. That is recessionary signal. McBride is RE theorist which negates him. RE like 2001, didn’t signal nothing…..
@ The Rage
I certainly agree with you about corporate debt, unless the memory is failing me (which wouldn’t be the first time). Surprised Menzie and jim haven’t touched on this subject more in the last 6 months. It is a legitimate worry.
McBride is uncannily accurate at times, RE analyst or shaman or some other prognosticator. In my knuckle dragging and recession plagued construction world, I see mixed signals, which always make me nervous. Relatively low retail interest rates make houses, apartments, and other kinds of development more likely, which is anti-inflationary. I’m not convinced that single family construction needs to get back to pre-crash levels to satisfy demand, simply because so much got built before the crash. There are places with housing shortages, but those places also have shortages of buildable ground to put houses on. It’s probably the only time I’ll ever agree with supply siders about increasing the supply side to make the economy grow. Having been blasted by every recession since Reagan’s first term has turned me into an economic paranoiac.
Earlier today, McBride was very careful to say that he’s not on recession watch but that doesn’t preclude a slowdown or a random negative quarter or two coming up. We could easily have several negative quarters over the next 18 months without having two in a row. It could feel like a recession setting in to most of us, even without being a technical recession. That’s the real danger for the current regime. If the economy is improving and the occupant of the White House fails to be reelected, it would be another unprecedented accomplishment of the current occupant.
“[I]f all you care about is the objective expectation, there’s no way you should be buying long-term bonds at the moment.” ??
The long-term rate is set by the current short-term rate and expectations about the future path of short-term rates, which necessarily involves uncertainty. The expectations necessarily involve forecasting (as opposed to just prediction), right? What assumptions are used to get the ‘objective expectation’ path of future short-term rates? If the current market consensus is that interest rates will fall in the future, why wouldn’t this push the long-term rate below the short-term rate? The adjustment couldn’t come from the current short-term rate, because that is set by the fed….
Maybe i just need to be directed to some literature beyond a simple google search.
Don: These models build an explicit forecast of future short rates, and then compare the observed yield with the one predicted using those forecasts. The difference is then labeled a term premium. The approach is very model-dependent, obviously. The particular ACM forecast comes from forecasts based on the first 5 principal components of the yield curve. I tried to convey in the post, and could have done better at conveying this it seems, that the ACM or any other estimates of the term premium should be viewed with some healthy skepticism. But the overall conclusion that the term premium is much lower today than it was in the 1980s will I think emerge from virtually any way you try to do the calculations.
Thanks. That helped.
Professor Hamilton,
Thank you for the post.
I notice that you used end of period interest rates for each quarter and not the average for the quarter. As a teaching point, would you comment on why you used end of period interest rates and not the average for the quarter. Apologies if this is a dim bulb question.
AS: The most recent value of any asset should do the best job at forecasting the future. Today’s stock price is a better predictor of next year than the stock price in April or the stock price in March. One could consider even using the last day of the quarter, but there might be some noise in this so I took averages over the last month.
Thanks.
If one were computing a probit model to compute the probability of recession, using the gs10 and tb3ms spread, would the same reasoning apply, or is it the average of the spread over a quarter that would be used to develop the model ? I thought that I recently read in an AAII interview of Campbell Harvey, that he used the average spread for the quarter to forecast the probability of recession. I am not being contentious, just trying to be clear.
AS: Yes, I would expect the probit to perform better if we used the average spread over the last month of the quarter rather than the average spread over the quarter.
Thanks again!
Professor Hamilton,
Looking at the model’s diagnostics, both the model’s correlogram and the Breusch_Godfrey Serial Correlation LM Test show that the model’s residuals are correlated. I am confused as to why more has not been done to reduce the autocorrelation of the model. At the same time, the Ramsey RESET Test is favorable which seems to add a bit more confusion about the model given the previously mentioned autocorrelation. Again, as a teaching point, would you consider some additional explanation?
AS: The errors of a 4-quarter-ahead forecast– which is what the residuals in this regression are– will be serially correlated by construction. Serial correlation of residuals in a regression like this is not a sign of misspecification of the forecasting model. However, you are right that I should have based t-statistics on HAC rather than OLS standard errors.
Thank you.
I was not trying to find errors, just trying to understand. Maybe in a future post you could expand upon, “[t]he errors of a 4-quarter-ahead forecast– which is what the residuals in this regression are– will be serially correlated by construction. Serial correlation of residuals in a regression like this is not a sign of misspecification of the forecasting model.” I have not seen any explanations of such models in the various sources I use.
One final question: I read the Liberty Street Economics article, “Treasury Term Premia 1961-Present”. Below is the link to download data. Column titles show items such as: ACMY10, ACMTP10, and ACMRNY10. I am having trouble trying to duplicate the first chart in the article and your term premium chart. If I have not overused my request time, would you consider some more clarification?
https://www.newyorkfed.org/research/data_indicators/term_premia.html
AS: The first chart is the raw data from FRED. The term premium chart is a plot of ACMTP10. I believe that ACMY10 is not the actual 10-year rate but instead is the 10-year rate predicted by the model.
Thanks.
Regarding the “first chart”, I meant the first chart from the Liberty Street article. With your help, I now see the ACMTP10 as the term premium and now can duplicate the term premium in the first chart in the Liberty Street article.
I had recognized that the first chart in your article was the raw data of the spread between the 10Y and .-month yields. Sorry for being unclear.
Evidently this post is about the state of the economy in the period ahead. The proffered tool is the 3mo-10yr spread. Yet it is but a single tool. History says forecast accuracy can be vastly improved by utilizing more than one tool. Amongst others, the stock market would be a candidate. What then is the purpose of focusing on this single tool?
At this point the term premium comes on stage. The bottom line in this marriage is drawn from the Spread minus term premium chart. The conclusion from this chart is that the spread-minus-term-premium has historically gone negative ahead of recessions (major slowdowns). Since currently this variable is far from negative, the conclusion to be drawn now is that the marketplace is leaning too heavily on traditional yield curve inversion to predict a slowdown or outright recession. That is, it is different this time. And the difference is in the term premium. A constructed and unobservable variable, at that.
What then are we to do? Await an inversion of this spread-minus-term-premium variable before calling for a significant slowdown or recession? What guidance is there other than cautioning that traditional yield curve inversion may not be as crisp a signal as it has been in the past?
Since the term premium is what purportedly makes this time different, let us then look more closely at it. Can it be relied upon at all? Is it worth the paper it’s printed on? From the chart of the constructed term premium we see that it went negative in 2015 through 2018. According to the statement made in the post, one should then have been buying T-bills all along rather than long-term Treasuries. The 3-mo constant maturity yielded 0%, 0.3%, 1%, and 2% respectively during these four years. Had you invested long-term in the 10-year in each of these years, you would be receiving coupons of 2.1%, 1.8%, 2.3%, and 2.8% respectively.
That’s not just a bird in the hand. It’s an entire covey. So what gives? Why should this schema leaning on the constructed term premium presented here suddenly, in this business cycle, be given any credence whatsoever? When for the past four years this model has been a poor if not terrible advisor on where to park your funds?
More deep analysis from JBH, after this commercial break, on FOX Business Network. “Can Fibonacci Retracement save Dear Leader’s central planning on soybeans???”—NEXT
https://www.youtube.com/watch?v=hLEUFfbntQQ
When the indictments roll in and the guilty are rousted from their beds in the middle of the night, don’t be surprised to see numerous economists among those housed at Gitmo awaiting trial. As we are now well aware, Moses, those who deviate from the truth must ultimately face the consequences. In the post-indictment economy there will be no room for those who publish data that cannot be true.
We must return to those moral and economic principles so clearly spelled out in the Bible in the Constitution, and by JBH’s guru in Pakistan. (He DID see his shadow in February!!)
Our very survival demands no less.
“Taken literally, it means that when the yield curve inverts you’d actually expect faster GDP growth. However, the effect is completely insignificant statistically.”
Maybe, maybe not. To the extent the yield curve reflects expectation of monetary policy, When the yield curve inverts the tightening is behind us. Monetary policy acts with a lag, so whatever slowdown happens is baked in. Easing (and faster growth) is ahead.
I tend to discount everyone’s rationalization about the term premium and whatnot. People seem to desperately want to conclude “this time is different” but that is rarely the case. An exceptional conclusion requires exceptional evidence. Monetary policy drives the economy. It has been too tight for years because the 2% “target” is actually a ceiling.
I concur with Jim’s cautious conclusion, and congratulate him for his clear answers to various questions.
As part of that agreement I am not ready to call a recession, but the signs of slower growth are out there with these financial market developments among them. It may well be that events abroad are leading the way here. Some other signs are that oil prices have suddenly taken a major dive, dropping 5 percent today. Jim’s old models say lower oil prices good for growth, but in this case all the noise is that this reflects rising expectations of a slowing global economy. Asian stock markets have fallen for something like 16 straight days, most of them anyway.
An obvious other kicker in these rising expectations of falling growth is the circus of Trump’s trade wars, with this latest move to impose tariffs on Mexico over the immigration issue just completely incoherent and probably behind today’s serious slide in both oil and stock markets. Here he is sending his new NAFTA deal to the House with a 30-day deadline, declaring he is putting Peolosi on the spot, while he also has VP Pence off in Canada trying to sell the deal. And WaPo says most of his aides support this thoughtless nonsense, which clearly will negatively impact the US and Mexican economies if carried out, with no way Mexico can meet Trump’s demands.
Bill McBride: https://www.calculatedriskblog.com/2019/05/still-not-on-recession-watch.html
dilbert : McBride is right, see my post above. I am only afraid, that Trump does something stupid because he does not understand chinese mentality and all his advisors are yea-sayer.
A narcissist can not tolerate another opinion without going berserk.
Prof JDH,
There’s a study by Morgan Stanley where they apparently indicate that the yield curve inversion is deeper than what we currently see.
https://twitter.com/LizAnnSonders/status/1134148485924753414
https://www.youtube.com/watch?v=VIx_nMysTUY
Why is the curve flat and bifurcated?
All we are doing on the ten year i rolling over ten year debt. The rest of government is operating at the short end. There is no observed variation in the ten year loan demand, it is all the same ten year debt, so there is no term premium.
Normally we get term premium because the variation in loan terms is greater as the long terms become sparse. Hence, there is never a really good match at the long en;, the lender gets as close as possible and the left over is taken from the short end in a liquid credit account. Like most of economics, this is a combinatorial issue having nothing to do with economics as defined. It all boils down to the same reason we order primes from small to large and primes get less dense farther out. The order and density of primes on the X axis allows us to ’round’; we get digits, and multiplication works.
Thanks so much for the post and the replies.
In our paper “Downturns and Changes in the Yield Slope” (which can be downloadable here: https://papers.ssrn.com/sol3/papers.cfm?abstract_id=3246408), we show that the predictive power of equation (1) is enhanced if you add the first difference of the spread. While the negative spread does predict recessions in sample, predictability increases when you observe a subsequent increase in the spread. In this sense, while we may be close to a recession, it does not seem imminent yet under the light of the spread dynamics -similar conclusions can be drawn by looking at the term premium-. BTW, decomposing the yield spread into the risk neutral spread and the term premium slightly enhances predictability. The term premium increases relatively abruptly prior to recessions.