Federal Reserve Bank of Chicago President Charles Evans got some attention recently with the following statement:
In a world of global competition and new technology, I think competition is coming from new places. New partners are choosing to merge and sort of changing the marketplace and [bringing] more competitive pressures on price margins…If that’s the case, and I think that’s just speculative at this point, then it means that we need even more accommodation to get inflation up.
Here are some of the data that might support such a statement. The existence of a Phillips Curve is one of the Fed’s core assumptions: as unemployment gets lower, the inflation rate should pick up. We’ve seen a huge drop in unemployment over the last six years. And in response, inflation did … pretty much nothing. It sure looks like other factors — maybe changes in competitive structure, maybe something else– are having a bigger influence on inflation than is the unemployment rate at the moment.
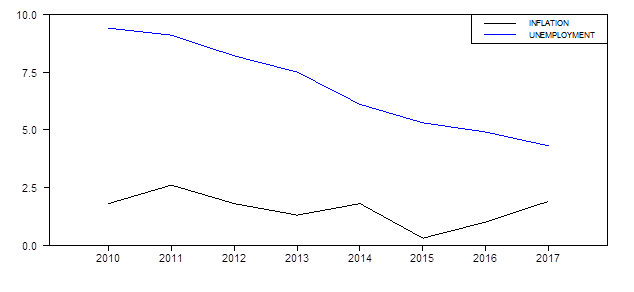
Inflation rate measured as year-over-year percent change in the implicit price deflator on personal consumption expenditures (second quarter to second quarter for 2010-2016, first quarter to first quarter for 2017), and unemployment rate (June of each year for 2010-2016, May for 2017).
But to that I’d add this– there’s really nothing new about the claim that other factors have a bigger influence on inflation than the unemployment rate. Here for example is a scatter plot going back to 1949 of the year-over-year change in inflation against the unemployment rate. I’ve drawn the regression line, as economists like to do, to help your imagination see the modest negative relation that holds in the data. But it is indeed modest, with an R2 of only 6%.
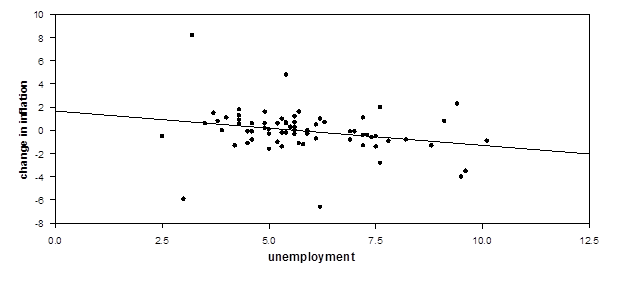
Annual data, 1949-2017. Vertical axis: year-over-year change in the inflation rate. Horizontal axis: unemployment.
Of course, economists have been teaching for a couple of generations that the Phillips Curve shifts over time due to changes in expected inflation. I’ve actually already incorporated a quick and dirty fix for this in the figure above by measuring the difference between this year’s and last year’s inflation on the vertical axis. If people expect this year’s inflation to be the same as last year, the result (as in Charles Jones’s macroeconomics textbook) is a Phillips Curve adjusted for expectations.
Or we can try to measure expectations of inflation using for example the University of Michigan’s survey of consumer expectations. But that actually brings the R2 down to 5%. That means 95% of the variance comes from something else.
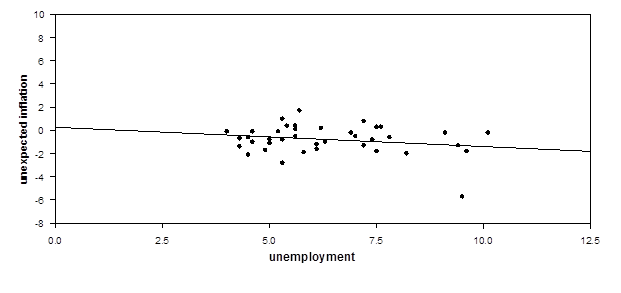
Annual data, 1979-2017. Vertical axis: year-over-year inflation rate minus previous year’s expected inflation. Horizontal axis: unemployment.
We can try to tweak this further by using the difference between the unemployment rate and the “natural unemployment rate” on the horizontal axis. That has a better fit, in part because our ex-post estimates of the natural rate are based on whether we saw inflation go up that year. If inflation went up, we infer that the natural rate of unemployment must have been higher. But good luck figuring out whether the U.S. is above or below the natural rate right now.
I’m not saying the Phillips Curve has no basis in facts. I agree that the Phillips Curve is the correct framework for thinking about these questions. But I also agree with President Evans that other factors seem to be more important than the unemployment rate right now in determining inflation.
Because they always have been.
And I also agree with President Evans’s conclusion. Given that inflation has stayed so low for so long, it makes sense to wait to see stronger evidence that inflation is really picking up before we put the brakes on the economy.
I think, the output gap is bigger than what’s reflected in the unemployment rate.
Income, and aggregate demand, should increase faster.
I suggested, less regulations, lower middle class taxes, and a higher minimum wage.
The Fed has done a good job maintaining price stability, although the Core PCE is below its 2% target:
https://www.advisorperspectives.com/dshort/updates/2017/06/30/pce-price-index-headline-core-down-in-may-core-under-1-5
I don’t think the output gap is big at all. That’s my interpretation, for example, about slower hiring in Wisconsin.
Opinions that lack economic structure don’t mean much. The demographic shift alone doesn’t explain the sudden, sharp, and sustained downshift in economic growth, since 2009. There’s been a slow demographic shift, since 2000.
I stated above, less regulation, lower middle class taxes, and a higher minimum wage can attract more labor into the workforce, generate more labor hours, raise income and demand, and expand the economy to close the output gap.
Wisconsin may be closer to full employment, because of out-migration, and so many people dropped-out of the workforce or work part-time, although less than other states, e.g. California.
The first baby boomers hit 65 in January 2011. There will be a distinct difference, not a gradual shift, due to this demographic effect. This will become compressed because boomers within a few years of retirement at the time of the financial crisis will become unemployable due to tech skills gap. This will increase, in short time, the number of retirees compared to previous years. We did see this happen. Following retirement, people contribute much less to productivity and decrease their spending. This will slow down economic growth. Demographics are a significant part of your “output gap”. The gap is not nearly as large as you want it to be.
Prime-age workers are 35-54. We saw a shift in demographics in 2000, when the Baby-Boomers, born between 1946-64, began leaving prime-age. Also, the participation rate of women peaked around the year 2000.
In this “recovery,” since 2009, we saw the labor force participation rate of older workers rise, because many postponed retirement, while many other older workers, who lost jobs, couldn’t find a decent job and retired early. Moreover, we saw a huge increase of people receiving disability, many more people going to college (because they couldn’t find a good job), and a huge increase in benefits, including food stamps, low income housing, unemployment extensions, etc.. Furthermore, there are more part-time workers with the huge numbers of 16-65 workers, who dropped out of the workforce.
There may be a couple percent of labor force left to tap, but not a huge number.
See the graph: https://fred.stlouisfed.org/series/CIVPART
Also, the 65+ age cohort is slated to increase by 50% by 2025, if I saw correctly, to Baffs point.
“In 2007, the Congressional Budget Office published long-term projections of potential G.D.P. that assumed the United States would grow around 2.7 percent a year for the ensuing decade. It didn’t. Growth in both the labor force and worker productivity underperformed those projections. So the reality we’re living in underperforms that theoretical potential by $2.2 trillion, or 14 percent.”
peak, why would you rely on a report produced with data prior to 2007 to understand how the world would operate after the most significant financial crisis of the pasts 75 years? Such a report must be updated to include post crisis environment. to use this report to support your “output gap” is simply stupid. or you are a hack. either way, it is ignorant but typical of your mode of operation.
Baffling, based on the labor force, the CBO projected GDP growth. There have been changes in the labor force, which I noted above, and it’s not just the demographic shift. GDP growth has been too low, along with the failure to close the output gap earlier after the severe recession ended in 2009. You’re the political hack by ignoring those changes.
And, it should be noted, the 1982-00 economic boom coincided with the Baby Boomers, born in 1946-64, reaching prime-age, i.e. 35-54. The slow demographic shift will continue, until the last of the Baby Boomers reach 65 in 2029.
We need inflation. How else can you get “growth”?
We have inflation. And, we had deflationary growth before, although it may have been slower than it should, e.g. because of “price stickiness.”
American Prosperity and Price Deflation
Written by Richard M. Ebeling
Friday, 09 May 2008
“The decades between 1865 and 1900 were the years of America’s industrial revolution. Before this time, America had an economy of primarily light industry and farming. By the beginning of the 20th century, however, the United States had surpassed all of the European nations in manufacturing, including Great Britain and Imperial Germany, the industrial giants of the time.
Mass immigration from Europe, huge capital investments, and technological improvements provided the means for America’s growth and rising standards of living that soon became the envy of the rest of the world.
During the years after 1865 prices in general slowly fell from their Civil War highs. A Consumer Price Index that stood at 100 in 1865 had declined to 57 by 1900, or a 43 percent decrease in prices over a 35 year period. On average prices went down around 1.2 percent each year over three and a half decades.
At the same time, indices of money wages in agricultural and manufacturing employment both rose during this period as labor was becoming more productive due to capital investments, even with a rising population resulting from millions of immigrants joining the American work force.
The index of money wages in agriculture rose by almost 40 percent between 1866 and 1900, while money wages in manufacturing went up 20 percent during this period. Thus, on average, money wages in general increased by about 30 percent for workers as a whole.
In combination with the productivity gains and the capital investments that resulted in the 43 percent decrease in the price level, this meant that in the last 35 years of the 19th century the real standard of living of the American people increased by almost 75 percent as measured by the positive change in the average American’s buying power in the market place.”
It should be noted, Americans were able to buy goods that didn’t exist before and became better and cheaper over time.
For example, the microwave oven was invented and mass produced. Over time, the microwave oven became more durable, lighter, and had more features, while its price declined substantially relative to income (you can buy a microwave oven for $60 at Walmart).
It’s difficult to measure the improvement in living standards of new or better products.
Also, we had disinflationary strong growth during the height of the Information Revolution.
I would suggest that maybe the relation is still there. It’s only our fault to don’t know “how to look”, as I try to explain here:
https://losinterest.wordpress.com/2017/06/12/stop-employing-unemployment/
What about waiting (no, not waiting, taking active measures) until the price level is again where it would have been if the Fed had been keeping inflation at 2% since 2008?
Raising inflation expectations with accelerating inflation will require more Fed hikes to slow inflation. The question is why did the low cost of capital have such a small effect on growth. Krugman may have part of the answer:
Profits Without Production
Paul Krugman
June 20, 2013
“Economies do change over time, and sometimes in fundamental ways.
“…the growing importance of monopoly rents: profits that don’t represent returns on investment, but instead reflect the value of market dominance.
…consider the differences between the iconic companies of two different eras: General Motors in the 1950s and 1960s, and Apple today.
G.M. in its heyday had a lot of market power. Nonetheless, the company’s value came largely from its productive capacity: it owned hundreds of factories and employed around 1 percent of the total nonfarm work force.
Apple, by contrast…employs less than 0.05 percent of our workers. To some extent, that’s because it has outsourced almost all its production overseas. But the truth is that the Chinese aren’t making that much money from Apple sales either. To a large extent, the price you pay for an iWhatever is disconnected from the cost of producing the gadget. Apple simply charges what the traffic will bear, and given the strength of its market position, the traffic will bear a lot.
…the economy is affected…when profits increasingly reflect market power rather than production.
Since around 2000, the big story has been one of a sharp shift in the distribution of income away from wages in general, and toward profits. But here’s the puzzle: Since profits are high while borrowing costs are low, why aren’t we seeing a boom in business investment?
Well, there’s no puzzle here if rising profits reflect rents, not returns on investment. A monopolist can, after all, be highly profitable yet see no good reason to expand its productive capacity.
And Apple again provides a case in point: It is hugely profitable, yet it’s sitting on a giant pile of cash, which it evidently sees no need to reinvest in its business.
Or to put it differently, rising monopoly rents can and arguably have had the effect of simultaneously depressing both wages and the perceived return on investment.
If household income and hence household spending is held down because labor gets an ever-smaller share of national income, while corporations, despite soaring profits, have little incentive to invest, you have a recipe for persistently depressed demand. I don’t think this is the only reason our recovery has been so weak — but it’s probably a contributory factor.”
1. Great post, Mr. Hamilton! It is an exploration, exactly what’s needed.
2. PeakTrader, I agree on the importance of the latter 1800s, with its combination deflation and rapid growth. “Three panics and a nonevent” at Historinhas opened my eyes to this with a couple interesting graphs.
Cechetti and Schoenholtz suggest that the Phillips curve is too unstable to be used as a guide for monetary policy:
http://www.moneyandbanking.com/commentary/2017/5/29/the-phillips-curve-a-primer
There´s no “new inflation regime”, but an “inadequate monetary policy regime”
http://ngdp-advisers.com/2017/06/06/low-unemployment-root-evil/
Professor Hamilton,
If you have time and interest it would be great to “hear” more from you about the Phillips Curve. Linked below is a blog comment from FRED, that I wonder if Mr. Bullard is thinking about when he recently said that he does not see immediate pressure on inflation from the declining unemployment rate.
https://fredblog.stlouisfed.org/2015/11/the-phillips-curve-after-the-great-recession/
I think the data suggests we are in a new regime.
We need to put demographics, productivity, national human and physical capital depreciation, lfp rate etc into a spreadsheet and see what comes out.
State budget crises may also be related to this, i.e., revenues not growing fast enough to keep pace with expenses.
While they search for “inflation regimes”, inflation itself has gone AWOL!
http://ngdp-advisers.com/2017/07/04/inflation-gone-awol/
That’s a pretty good summary on inflation.
Personally, I never liked NAIRU or the Phillips curve.
I think we need to get a lot smarter on demographics aspects.
If intense competition in food retailing, for example, pushed down prices across grocery stores, why would that mean more monetary accommodation? Wouldn’t this imply an outward shift in real household income? Prices would fall in food retailing but rise somewhere else. How is this different from a positive supply shock? And wouldn’t such a supply shock mean higher neutral rates?
Neil: If inflation is not a concern, I do not see why the Fed should be trying to raise the unemployment rate.
Think like a business… You would like to raise prices. So you analyze your sales data. If your computer analysis says that your net income will rise, you raise prices. Then follow up data lets you know if that was a bad decision.
These analyses are happening macro-ly throughout the economy. They are assessing the strength of demand to support higher prices.
We have a situation currently where labor share is down and after-tax corporate profit rates are near record highs. So firms have done very well with pricing to maximize profits.
We also have a situation where labor share is down and thus capacity utilization is low. When capacity utilization is low, firms prefer to increase capacity before raising prices. We have seen a bit of a rise recently in capacity utilization along with a fall in prices. Firms are managing capacity and prices to maximize profits. This process is a lot more efficient now with computers then it was back in the 1970s.
Wage inflation is weak because labor has lost so much power to get higher wages. Firms in general also have the mind-set that keeping wages low is the preferred way to control unit labor costs. Yet macro-economically, the results are disappointing.
So with after-tax profits being maximized along with weak labor share, firms have little upside to prices. There is no need to raise prices either… only if profits can be further maximized, and they really cannot be. The preferred way will be to increase capacity utilization.
Who really pays for higher production costs arising from more regulations, more lawsuits, higher compensation costs, and higher taxes, particularly in a more globally competitive economy?
Injection molding (industrial process for making parts out of plastics like polypropylene, polystyrene, etc) is good example
The molds are BIG pieces of precision steel; it use to be big deal to order one, and they were made by skilled guys by hand, essentially – not tht long ago
now, at the low end, there is protomold, which has semiautomated the process and at the mid-high end china is 1/3 the price of US
we are talking a lot of money, and a lot of vital skills that go with the mfr of this product – making molds is key to making many plastic parts, so if you loose how to make them, you loose a whole industry, sort of
Instead of working so hard to get the inflation rate up to 2% why not set a new inflation target at 1% or even 0%?
What is this obsession with deliberately trying to fool people for their own good?
What is this irrational fear of deflation?
“What is this irrational fear of deflation?”
from a macroeconomic perspective, there seems to be few, if any, redeeming qualities about overall deflation for the economy as a whole. it seems to create more problems than it solves. so if one were to err, it seems slight inflation is a better mistake than deflation. this risks are not symmetric.
https://fred.stlouisfed.org/series/M2V
Professor Hamilton,
Would you consider updating your prior entry comparing 10 year and 3 year average percent changes for M2, GDP and Real GDP. Perhaps commenting on inflation prospects due to the M2 changes over the prior three and ten year periods.
https://econbrowser.com/archives/2006/05/m2_and_inflatio
Thanks for considering.