Suppose you wanted to detect anomalies in nonfarm payroll employment (NFP). Would you want to apply a filter that relied on trend stationarity of NFP (like reader CoRev does in his “anomaly analysis”)? My short answer is “no”…
First, consider what a series of (deterministic) trend estimates looks like, over 20 year spans, 1947-2019.
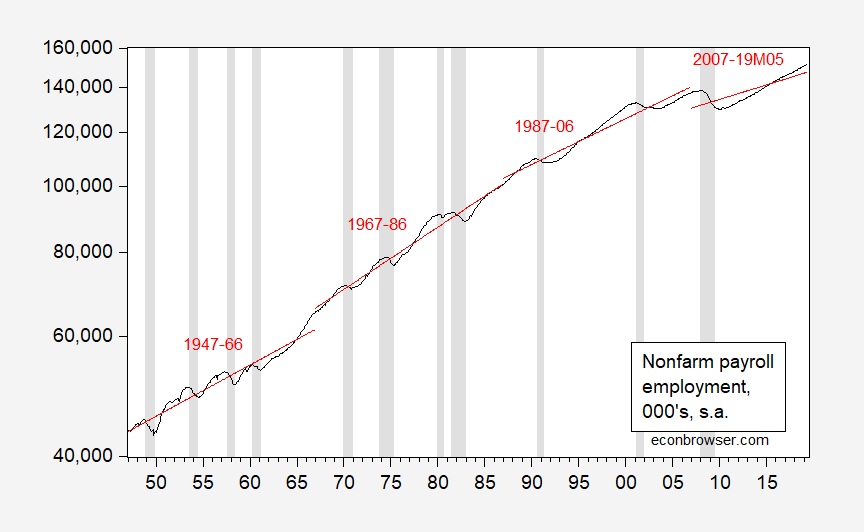
Figure 1: Nonfarm payroll employment, 000’s, s.a. (black), and linear deterministic trends estimated over 20 year subsamples. NBER defined recession dates shaded gray. Source: BLS, May employment situation release, NBER, and author’s calculations.
If the series were trend stationary, then one would expect the fitted trend lines to not vary overmuch. But they do… (for more on the trend stationary/difference stationary distinction and cointegration, see “Beware of econometricians bearing estimates,” JPAM (1991).)
A more formal approach (from Cheung-Chinn (1996, 1997): Apply a test (or tests) that has a unit root null hypothesis. Also apply a test that has a trend stationary null hypothesis.
- ADF (constant, trend, lags=4) t-stat: -1.566963, p-value: 0.8053 ==> do not reject unit root null
- Elliott-Rothenberg-Stock point optimal (constant, trend, lags=4) P-statistic: 15.2896 (10% c.v. is 6.89) ==> do not reject unit root null
- KPSS (constant, trend, bandwidth=23, Bartlett kernel) LM test statistics: 0.726442 (1% c.v. is 0.11900) ==> reject trend null
To sum up: ADF and ERS fail to reject unit root null. KPSS rejects trend stationary null. Hence, I think (log) NFP is better characterized as difference stationary then trend stationary. I’m willing to allow that one could characterize NFP with a structural break (using a Perron test, I find a possible break in 1961M02, and yet fail to reject unit root null — hence I think this is necessarily a given).
Menzie, possibly the cruelest thing you have ever done to me since running this blog, is make where I click on something once and it downloads something authored by CoRev onto my computer. I’ve never thought of you as a vicious man until tonight Menzie. You owe my hard drive an apology this instant. It’s the first time I’ve seen an inanimate object get the dry-heaves and gag. I depend on this machine for all sorts of unsuitable and degenerate entertainment, and now my desktop won’t even talk to me.
https://www.youtube.com/watch?v=cyLdtG7KZvw
For the record, I think Andrew Yang not wearing a tie, is very cool and a VERY American thing to do. Similar to “rolling your sleeves up”, not wearing a tie to me stands for the working man of America, the man who “doesn’t stand on ceremony” and is willing to get out there and get the job done however that job needs to be done (within the bounds of ethics). Andrew Yang, THUMBS UP on no tie Bro!!!!
CoRev has learned to use Excel – progress! Now if we can get him to learn what the following events were – the entry of women in the workforce, the demographics of the baby boomers retiring, etc. etc. Like I thought everyone knew that the labor force participation rate has not been constant over this very long period of time. But I guess this is all news to CoRev!
I’m assuming that if you’re like me and it’s either been years since you studied this, or possibly just didn’t (although some of the terminology seems to ring a bell, most of it still isn’t registering for me) that the base or foundation starting point might be understanding “Unit root”
https://en.wikipedia.org/wiki/Unit_root
In structural dynamics a unit root is just a rigid body motion. When controlling rockets you want to control the rigid body motion not the vibrations.
Civilian Labor Force Participation Rate
https://fred.stlouisfed.org/series/CIVPART
Maybe we should have FRED draw CoRev a picture to indicate why his trend stationary assumption about employment growth makes no sense.
I’m not a statistician! While Menzie has done work determining nuances and qualities of various statistical tests as shown in his references of his own works. Quoting from Menizie’s 1st paper referenced: ” This outcome suggests that it is useful to consider the tests complementary, rather than competing.” For some reason Menzie appears to think they are competing, even though both methods resulted in the same conclusion.
So the fundamental questions are there multiple methods to calculate and graph the TREND line of the overall data, and as Menzie’s graph shows trend changes? MY EXPERIENCE IS WITH CLIMATE DATA AND SPECIFICALLY TEMPERATURE TIME SERIES DATA. I used the analytical tools in my analysis tool bag. I can show the same types of graphs with temperature data analytical tools.
An exemplary temperature data reference, actually several are here: https://scholar.harvard.edu/files/stock/files/doestemperaturecontainstochastic.pdf
Which concludes with this:
” 5 Conclusions
The adage, “there are many ways to skin a cat” is applicable to statistical models of surface temperature. Statistical models indicate that surface temperature can be simulated either as a trend stationary process with a one-time permanent shock or as having a stochastic trend. These statistical representations embody very different hypotheses about the drivers of temperature changes during the instrumental record.Gay et al. (2009) argue that modeling temperature as a deterministic trend with a single break can be explained by changes in “key external forcing factors such as Earth orbit changes, solar irradiance, and greenhouse gas concentrations that hardly occur in decadal and century time scale…occurred in1977, 1985, and 1911 in G[global] NH, and SH respectively.” Although these events are rare and sufficiently large to mark a one-time permanent change in the temperature time series, Gay et al. (2009) do not offer a single change to coincide with these dates or even why these dates would vary across hemispheres. Conversely, the notion of cointegration allows users to estimate statistical models that are based the hypothesis that changes in radiative forcing, which is influenced in part by human activity, generates changes in surface temperature during the instrumental temperature record. As such, this approach offers the possibility of greater insights regarding the causes of climate change and efforts to slow its progression.”
I would include the NFP in this same category as temperature.
The Study to which the above Kauffaman study was responding was Global and hemispheric temperatures revisited here:
https://link.springer.com/article/10.1007%2Fs10584-008-9524-8
Its abstract partially states:
“Abstract
To characterize observed global and hemispheric temperatures, previous studies have proposed two types of data-generating processes, namely, random walk and trend-stationary, offering contrasting views regarding how the climate system works. Here we present an analysis of the time series properties of global and hemispheric temperatures using modern econometric techniques. Results show that: The temperature series can be better described as trend-stationary processes with a one-time permanent shock which cannot be interpreted as part of the natural variability;…”
Before pgl and others go off on its climate conclusions, I DO NOT AGREE WITH THEM. That was not the point of showing these two studies.
THAT POINT WAS THAT EVEN EXPERTS DISAGREE ON STATISTICAL BEST PRACTICES. Both Menzies’s and mine are applicable, and mine more so specially for this non-statistician.
I came to the same conclusion as Menzie, in the original article. I am also positive I would show the same trend changes as Menzie did had I used my alternative approach using the same NFP data as Menzie. Making a big thing over The adage, “there are many ways to skin a cat” is applicable to statistical models of surface temperature and NFP data, and saying: “A more formal approach…” to a non-statistician seems a little arrogant or shows some insecurity.
CoRev For some reason Menzie appears to think they are competing, even though both methods resulted in the same conclusion.
I think you misunderstood Menzie’s comment. By “competing” he meant that they have different null hypotheses. In the case of the ADF and ERS tests the null hypothesis is that there is a unit root. So failure to reject implies a unit root and rejecting implies a stationary series. In the case of the KPSS test the null is the opposite; i.e., the null assumes stationarity and rejecting the null implies there is a unit root. So each test comes at the problem from a different angle and you’re trying to reject competing null hypotheses. That’s all he meant.
Lord – that was a long winded rant. You could have stopped with the first sentence:
‘I’m not a statistician!’
Obviously. You are also not an economist. So stop pretending. Especially when you do a trend line over such an incredibly long period of time. No one with a brain and any sense of what has happened with the labor market (see my earlier comments) would have done something THAT stupid.
CoRev: For the love of god, please read Cheung-Chinn (1996, 1997) if you are going to critique the use of my own methodology…
Menzie, that’s what’s wrong with your articles lately: “if you are going to critique the use of my own methodology…” Both methods are well used in trend analysis in separate fields, climate versus economics.
You were the one criticizing my methodology. It wasn’t me criticizing yours. To this non-statistician seems a little arrogant or shows some insecurity.
Just to remind you and those few still reading, the approach I used CONFIRMED your conclusion of the trend. It did not criticize it.
CoRev: Let’s remember the context. You accused me repeatedly of (1) mis-attributing the data, (2) not making available “raw” data, (3) showing misleading results. In all three cases, you were wrong. You never apologized for not understanding the FRED data as listed is the same as the BLS data, and then you applied a methodology which is appropriate for the data series.
It’s not a matter of which methodology is applicable to which field. It is one usually tests to see if a series is best treated as trend stationary or difference stationary. You just picked up a methodology you claim is used in climate science and applied willy-nilly to NFP. That is my criticism. In this context, I don’t care that your (misguided) methodology confirms my conclusion — it’s still invalid.
Maybe it would be easier to count how many things CoRev gets right rather than counting the incredible multitude of things he gets wrong. My count to date is zero. But I must confess – I tend to stop reading his long winded and generally pointless rants. After all a stopped clock is right twice a day!
I wonder if we can get Gene Sperling to opine. I bet he would say Menzie’s attempts to get CoRev to offer a shred of honesty are a lot like his encounters with Stephen Moore in public forums on economic policy.
“Both methods are well used in trend analysis in separate fields, climate versus economics.”
corev, you would not know proper climate trend analysis either. you are an ignorant amateur monday morning quarterback on all topics on this blog. you have no real experience in economic or climate analysis, other than silly excel plots you post to blogs on occasion, then try to claim legitimacy. a couple of decades ago, you would be described as a stoooopid cliff clavin. go back to your bar stool.
“Before pgl and others go off on its climate conclusions, I DO NOT AGREE WITH THEM. That was not the point of showing these two studies.”
LOL! You remind me of the fools who think the earth is flat and also deny the law of gravity. Of course your attempting to equate employment over time with “climate change” is a riot. You do know employment has generally grown over time but you still try to deny there is any long-term increase in temperatures? CoRev wins! STUPIDEST MAN ALIVE! (oh wait – Delong has a trademark on this award).
Dear Folks,
This is going to be an extremely unpopular response, but I will make a slight defense of CoRev. A single, unvarying time trend for employment or anything else will not work – you have structural breaks, and you have to take account of them. Granted. But if you are going to go to the full, stochastic trends analysis, and do all the statistical tests and the like, on occasion, you will find that things don’t change that much, for whatever reason, and then deterministic trends will do well. Dr. Fred Joutz and I wrote an article in Energy Economics, which was published in 1997, and it showed that the U.S. Department of Energy forecast for 1994, where they basically assumed no change, did better than ours – we did better in 1995. So the real question, which CoRev may (or should) be trying to get at is when things will really change and when they won’t.
Let me add in a delayed response to the vicious beating of the late Mr. Chin that the perpetrators might well be called “very fine people” today.
From one who knows and is a (living) victim of these sorts of attacks, though not yet beating to be sent into a hospital,
J.
Mr. Silk,
There’s one person who would call the late Mr. Chin’s assailants “very fine people.” My expectation is that he will be ousted in 18 months or so, and potentially by a much smarter, dark-skinned woman. That would be a wonderful outcome. There’s plenty of time for all kinds of things to happen; however, the unsophisticated outhouse economist and tea-leaf reader keeps seeing signs that the economy is cooling. Trump cannot rely upon dumb luck forever. The economy sure looks like it is running out of steam, which will run Trump out of office more surely than his abysmal lack of any human virtues or redeeming qualities. With slowing growth, especially in areas that swung to him last cycle, the economy will work against his reelection. No guarantees, but that’s my expectation based upon current conditions and what’s being reported.
You have my complete sympathies for having survived what should never happen in the first place, at any level or any severity.
Julian Silk If you’re just talking about a short run forecast, then it really doesn’t matter whether you treat a series as trend stationary or as a random walk with drift. But if you’re looking out over a longer forecast horizon or if you’re trying to understand the true data generating process, then it matters a lot. For example, if you include GDP and/or NFP in an OLS regression in levels form, then you are assuming they are trend stationary. You could run the regression and get a high R-square and good t-stats; but there’s a 75% chance that the regression would be spurious if at least one of the variables contains a unit root. All variables have to be integrated of the same order. It’s at this point that you have to start investigating error correction or cointegration models.
There are some annoying issues when it comes to unit root versus structural breaks. One thing is that the data frequency matters. Something might be trend stationary at an annual frequency but nonstationary at a monthly or quarterly frequency. Another thing is that some of the nonstationarity could be due to seasonal unit roots, which are a pain. Testing for seasonal dummies versus seasonal roots sucks. A third problem is that sometimes you can find that tests are inconclusive or contradictory. What do you do if you reject both the ADF and the KPSS tests? It happens. Another concern is that unit roots could have been inadvertently brought into the data series if you’re using seasonally adjusted data. And then there’s the problem that many tests have low power near a unit root. If the true AR(1) is 0.98, then it would be stationary, albeit very persistent. But many unit root tests can’t distinguish between 0.98 and 1.00. That’s one reason why you want to use competing tests. Finally, there are just so damn many unit root tests that I can understand how a non-academic (such as myself) could be left befuddled as to which test to use.
2slugbaits: I should’ve added that I ran the tests over the *entire* 60 plus year sample, trying to get maximal power for the unit root tests. Now, as Summers (1986) pointed out, even with enormous high frequency samples, one might not be able to distinguish no serial correlation in first differences against *very* persistent high autocorrelation deviations from no serial correlation; but I did use as much data as was available.
Menzie In this case I don’t think there’s a lot of ambiguity, so low power doesn’t seem like much of a risk. It’s pretty clear that the NFP data is a stochastic trend.
Dear 2Slugbaits,
I’m going to have to disagree that there is no difference between the trend stationary and the random walk with drift, even at low frequencies. My understanding, and I will be happy to be corrected if this is wrong, is that the random walk with drift will be more likely to be cointegrated with other random walks with drift, even at low frequencies. My example is consumption, not employment. Suppose consumption and income are cointegrated, and both I(1). If income goes up more than is expected, and you have a nice positive coefficient for consumption, which is almost always the case, it will tend to jump up, too. This could be as early as the next quarter. With trend stationary consumption, income will jump up but consumption will not, or at least that’s my understanding.
I do agree with you on the confusion from all the unit root tests, however.
Julian
Julian I think you misunderstood my comment. I said that for the purpose of short term forecasts it usually doesn’t make much difference. I wasn’t talking about frequencies, I was referring to short forecast horizons; e.g., one or two months. But if you’re looking at longer term forecasts or if you’re interested in uncovering the true data generating process, then it’s very important that you correctly distinguish between a stationary trend and a stochastic trend. Hope this clears things up.
2slugs, Julian and Menzie, your discussion is why precision isn’t the issue with temperature calculations. The total range of the MEASURED global average annual data is ~1C where the measurement equipment typically has a 1C error range. Over concentrating on precision causes a high level of discussion as here. OUR TWO METHODS CONFIRMED THE TRENDS, and that is all that was intended.
In temperature calculations and analysis dentifying the break points and comparing/correlating to weather events of that era are important. Fro example 1998, and 2016 were years of large gains. They also were years with super el Ninos. That correlation is obvious, but yet the novices in the press claimed huge importance to setting new records highs without explaining the cause. Nor did they mention that the temperatures after those events dropped below where it was before the el Nino started due to a la Nina. That ensuing drop is almost completely ignored. Still the high records are repeated.
The consistency of the underlying trend of temperature is important, not it’s precision. From there additional analysis can make sense of what can be causing those trend changes occurring within the error range of the measuring equipment. In that additional analysis is where most of the Natural versus man-caused and their internal sub-components conflicts arises.
I do not quite understand Menzie’s assumption of an attack on his methods.
There is a “years ending in seven” issue, I think. Because the series starts in 1947, you end up with a 20-year period beginning in 2007. Ugly fit in that period. But then, it would have been ugly in any case.
Dear Folks,
I’m a little confused about CoRev’s response. The variations in the temperature data, at least the U.S. data that I used in my November 2008 USAEE Dialogue article, are much more than 1 degree Celsius. You are going to have measurement error in any series, yes. But if the variables show big variations, and the variation from a constant trend is consistent, I don’t understand how this is a measurement error, unless all the deviations are somehow measurement errors. This GDP growth numbers don’t seem particularly flawed in this regard.
From my humble perch, Menzie seems like a perfectly fine econometrician. We are going to disagree over whether one might use OxMetrics, which I might like and Menzie might not. But that’s just an additional package, which has a few other approaches. It doesn’t invalidate any of Menzie’s arguments, so far as I can tell.
Julian
Professor Chinn,
I understand your comments about unit roots for the various time periods, but do have questions about other periods that may show breakpoint unit roots.
For example, would you mind discussing the period from 2003m8 to 2019m5. When I run a breakpoint unit root test, with Trend Specification: Trend and Intercept ;Break Specification: Intercept only, I seem to get a very strong indication of breakpoint unit root with a break at 2008m07. If I understand this classification, then there would be a deterministic trend for the period with an intercept break dummy. I used a model as follows: log(payems) c log(payems(-1)) log(payems(-2)) log(payems(-3)) @trend @during(“20008m7 2010m2”). A static forecast of the period 2015m1 to 2019m5 shows a Theil U2 of 0.44. If I use the period 2003m8 to 2018m12 to enable a dynamic forecast of the period, 2019m1 to 2019m5, I get a Theil U2 of 0.21, however if I use a period shorter than the 2013m8 to 2018m12 to allow a dynamic forecast, I get terrible Theil U2 results.
Sure would like some coaching on this.
Thanks
‘…if I use a shorter period than the 2013m8 to 2018m12″ should say “if I use a shorter period than the 2003m8 to 2018m12”. For example, if I use a period from 2003m8 to 2016m12″ in order to make a dynamic forecast from 2017m1 to 2019m5, the Theil U2 is 6.4. As is known, a Theil U2 of 1.0 is derived by using the prior actual as the current forecast and the smaller the Theil U2 the better the forecast. Thus the Theil U2 of 6.4 is the result of a terrible dynamic forecast. Most perplexing to a hobbyist.
AS: There are many breakpoint tests, with different null hypotheses and alternative hypotheses. They’re not all going to give the same answer unless by accident because they are all testing different things. I used a Perron test. In that case, I still couldn’t reject a unit root null.
I understand the use of the various unit root tests for data series. I may not understand the EViews “Breakpoint Unit Root Test”, since most of the test categories indicate a rejection of log(payems) unit root for Trend Specification: Trend and Intercept; Break Specification: Intercept only. The regular “unit root” tests all fail to reject unit root for log(payems) for the period 2003m8 to 2019m5. I am not arguing, just trying to understand.
Linked are two examples of Breakpoint Unit Root provided by EViews. One relates to GDP and the other to Total Employment. Annual data are used. it would have been helpful if EViews had discussed forecasting related to the examples provided.
https://www.youtube.com/watch?v=aT9ma4ENRhE
Professor Chinn,
I may have forgotten to list an @trend factor in the prior model.
This is a good example of why unit root tests can be so frustrating. The unrestricted regression (i.e., constant, trend, lagged level and four lags of the dependent variable) fail to reject the unit root. Then restrict the trend and the lagged level to zero. The linear restriction fails reject the null that one or both equal zero. So there is a trend, it’s just not clear what kind of trend. Then rerun the regression without the lagged level (i.e., assuming a constant and trend plus four lags of the dependent). In this case the trend is not significantly different from zero. The next step is to rerun the regression only using a constant, lagged level and four lags of the dependent variable; i.e., a random walk plus drift. The null of a unit root cannot be rejected. Then test the restriction that the constant and lagged level are zero. This is rejected. Next rerun the regression with only a constant and four lags of the dependent variable. The constant is not zero using a t-test. Then rerun again using a constant, lagged level and four lags of the dependent. Using a t-test you cannot reject that the model is a random walk plus drift process and is not trend stationary. Whew!!!
And, with that explanation, I’ll stop fantasizing about going back to school to study economics. Being an unvarnished knuckle dragger sometimes seems like a better option. This is one of those times.
There’s enough free stuff online you can teach yourself quite a bit. Just saying that lower cost option is there, and you can set your own study hours. Finding where your level is and choosing the right textbook is the most important part. There’s some people on this blog that pretend to know they know more than they do, and make zero personal progress because they’ve already deemed themselves to basically know it all. You have enough self-awareness to know where you are, and leapfrog some “characters” we have on this blog. I mean this as a compliment and a pom-pom cheer on your studies for whatever it’s worth.
Willie It gets worse. You also have to worry about the “augmented” part of the Augmented Dickey-Fuller test; i.e., the number of lags of the dependent variable. In the NFP data the Bayesian Schwartz Information Criterion selects four lags with the unrestricted model. But using the Akaike Information Criterion for the pure random walk the ADF test needs 21 lags to get to white noise. And that’s AR errors only. What if the augmented part requires an ARMA representation? You can spend a career just working one time series.
I’m officially drooling on my own shoes now. I love figuring out what it all means, but my brain is plenty full of jargon from my day job already, let alone when you add it to the other extracurricular things I do. Although, Moses makes a good suggestion. A little knowledge in the wrong hands is dangerous, and I could be downright lethal. What could possibly go wrong?
Well, like CoRev, you could babble and jabber like you know what you’re talking about, inviting numerous knowledgeable readers to pin a factual tail on the ignorant donkey daily.
Or like Sammy, you could simply choose complete irrelevance while glorying in expressing ignorance.
Or you could admit to being lost in economics–my hand is also raised as it has been for some time–and learn as much as possible while staying sober enough to refrain from head smacking yourself when confused. For me that’s daily. You’re not alone.
@ Willie and noneconomics
I come up short in the math and statistics dept way more than someone with a finance degree should. It provides an endless well of self-hate I have a hard time transforming into motivated action to rectify.
On the bright side it takes some level of maturity to admit when you’re ignorant about things. Something anyone knows from reading this blog (and really life in general) a large number of men are not “man enough” to do.
noneconomist, or you could rant and babble on about not knowing what you are talking about in both subjects of interest instead of being the ignorant donkey. Admitting your lack of knowledge assures yo are the donkey upon which tail is pinned.
If you know little about a subject, how do you determine the value of a knowledgeable readers comments? You can not. It just is more confirmation bias.
https://www.youtube.com/watch?v=AFsmrfwGIv4
This should be posted on one of the other threads here, but I have been unable to determine which one it really belongs on, so I am putting it here. It is an admission of error, once again, and a correction of that, along with an apology to Menzie Chinn.
Deeply buried in one of the recent longer threads as a result of debates I think with CoRev, although possibly in some other connection, I made an incorrect statement about Menzie’s status in comparison with Robert Flood (an occasional commentator here) in the field of time-series econometrics. I wish to correct this, hopefully without insulting Flood (whom I have never met). I wrote something like [not exact wording] “…while a capable practicing time-series econometrician, Menzie is not in the same league as Jim [Hamilton] and Bob Flood, who have invented econometric techniques.” This statement was in error, and given all the batting going on around here regarding credentials and peoples’ histories, I want the record to be accurate and clear.
So, the bottom line is that Flood and Chinn are basically at the same level in terms of their contributions to time-series econometrics, while it remains that Jim Hamilton is in a higher category as somebody who has invented econometric techniques as opposed to simply using them well. My error arose from the fact that Flood has coauthored papers with Hodrick on speculative bubbles, these papers pushing the “misspecified fundamentals” argument that Jim Hamilton has also developed, and that I have also writtten papers on (somewhat disagreeing with all three of them). However, Hodrick coinvented with Prescott a widely used (although controversial) time-series filter, which I have also used myself in some work. When I made my incorrect statement here I was confusedly thinking that the filter was “Hodrick-Flood” rather than “Hodrick-Prescott.” As it is, having checked, I do not think Robert Flood has invented any econometric techniques, filters or otherwise, although he like Menzie is a capable user of such things in time-series econometric research on various topics. OTOH, Jim Hamilton, aside from being the author of the authoritative grad textbook, Time-Series Analysis, invented a regime-switching technique that I and coauthors have used numerous times in published papers, mostly in studies of possible speculative bubbles in various data bases.
I apologize to Menzie for having inaccurately relatively downgraded his standing in these matters.
No need for an apology; I would be gratified to be listed wi with Bob Flood. Certainly I self identify as a consumer of econometric methods, not a producer, so putting me far below James Hamilton is perfectly appropriate.
Should one assume trend stationarity when examining real GDP over the 1949 to 2019 period? This is something a dunce like Lawrence Kudlow might do. He used to talk about 3.5% growth over very extended periods of time.
Good assumption for the 1949 to 1980 period but during the 1981-1992 period (St. Reagan and such) growth was only 3.0%. And for a good reason – the celebrated 1981 led to a lower capital to labor ratio. Oh wait – WAY over CoRev’s head. But never mind that as we had 3.6% growth for the rest of the century. Rising capital to labor ratio and more R&D, which per the standard Solow growth model would raise growth. Again – WAY over CoRev’s head.
But why was growth only 2.5% over the 2001-2007 period and economists say long-term growth is only 2%? Oh yea – slower growth rate of the labor force. Something CoRev clearly finds as a gigantic surprise. He actually thinks one needs to know statistics to figure this out? Seriously? Even this is WAY over CoRev’s head. It seems so!
“CoRevJune 29, 2019 at 5:31 am
noneconomist, or you could rant and babble on about not knowing what you are talking about in both subjects of interest instead of being the ignorant donkey.”
No wonder someone compared CoRev to Cliff Clavin:
https://www.youtube.com/watch?v=botdmsQilnU
Cliff Clavin on Jeopardy