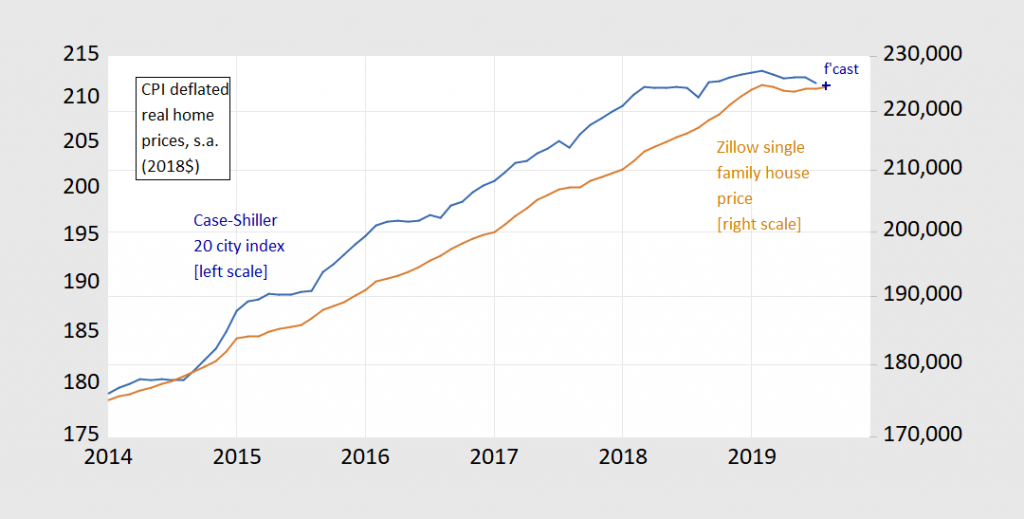
Case-Shiller through July, Zillow through August.
Figure 1: Case-Shiller 20 city home price index (blue, left log scale), Zillow forecast of Case-Shiller August value (blue +, left log scale), and Zillow single-family home prices (brown, right log scale). Source: S&P via FRED, Zillow, BLS, and author’s calculations.
As Calculated Risk notes, Zillow makes predictions for the Case-Shiller index. They forecast the August 2019 m/m growth rate (not annualized) in the 20 city composite at -0.1% (roughly -1.2% on an annualized basis). The forecast is shown in Figure 1 as a “+”.
New home sales depict a much more optimistic picture, as Calculated Risk discusses.

@ Menzie
There are lots of numbers lately that are interesting, especially presented in graph form. Have you seen the numbers/graph that indicates the gap between consumer expectations and current conditions?? The current number looks like it’s about negative 75. But if you look at the graph going back to roughly 1989 it’s very eye-opening IMO.
This article could be considered a little old, what, 36 hours or something?? Still I think it’s quite useful in the sense it breaks down and details what might be considered a pretty complicated topic. I consider myself relatively intelligent and I am not ashamed to say there are parts of it that confuse the hell out of me, or at the very least mystify me. Anyone who reads here regular should know I support Pelosi’s decision to make official the impeachment inquiry. So I am not saying because I find parts of it mystifying that I don’t support it wholeheartedly. This is my long-winded way of saying I thought others might appreciate the details here:
https://www.politico.com/story/2019/09/24/impeachment-trump-pelosi-democrats-1510460
It would be interesting to see graphs of the volume of real estate purchases by non U.S. citizens, the U.S. Federal Reserve QE balance sheet, and Federal Funds target rate on the Case-Shiller 2014-August 2019 x-axis shown above.
Real Private Residential Fixed Investment (2012$)
https://fred.stlouisfed.org/series/PRFIC1
This was $612.4 billion as of 2017QI. It was only $587.0 billion as of 2019QII. Now an economy is more than building housing but this is not the greatest of news.
I doubt if there’s anything too earth-shattering here, as Maguire is very unlikely to be cooperative, but if like most people you actually work for your daily bread and want to see the testimony, I think this is all of it, or all of the “public” testimony. I think C-Span requires people to have a cable TV service provider to watch most hearings live stream as they occur. But most of the more serious hearings they will upload later as a recording, and you can watch it in it’s entirety then. One of the beautiful things about C-Span is you can watch the hearings commercial free, and if you so desire, you can fast-forward through garbage segments (when some Republican is stonewalling or obstructing the process) or you can find a specific segment you’re interested in with the “slider” or left-right scroll thingy-muh-bopper on the bottom horizontal part of the video box.
https://www.c-span.org/video/?464509-1/acting-director-national-intelligence-maguire-testifies-whistleblower-complaint
Enjoy!!!!!