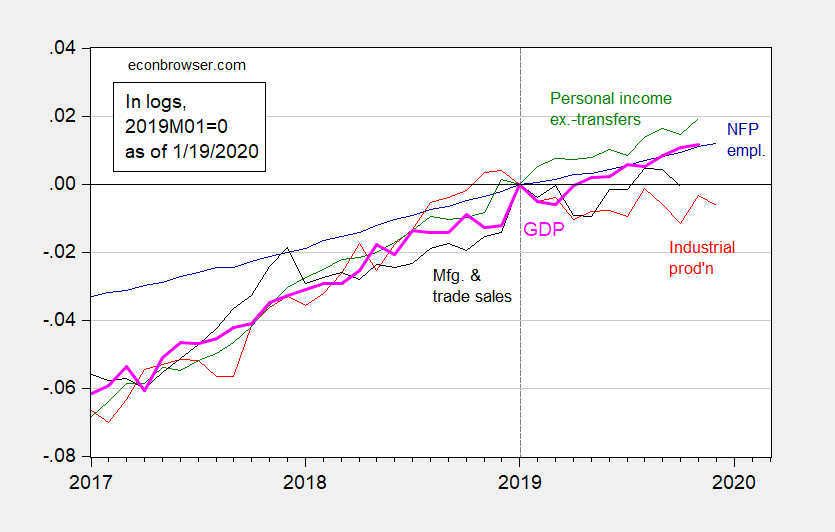
December industrial production (red line) adds to the (mixed) picture…
Figure 1: Nonfarm payroll employment (blue), industrial production (red), personal income excluding transfers in Ch.2012$ (green), manufacturing and trade sales in Ch.2012$ (black), and monthly GDP in Ch.2012$ (pink), all log normalized to 2019M01=0. Source: BLS, Federal Reserve, BEA, via FRED, Macroeconomic Advisers (12/30 release), and author’s calculations.
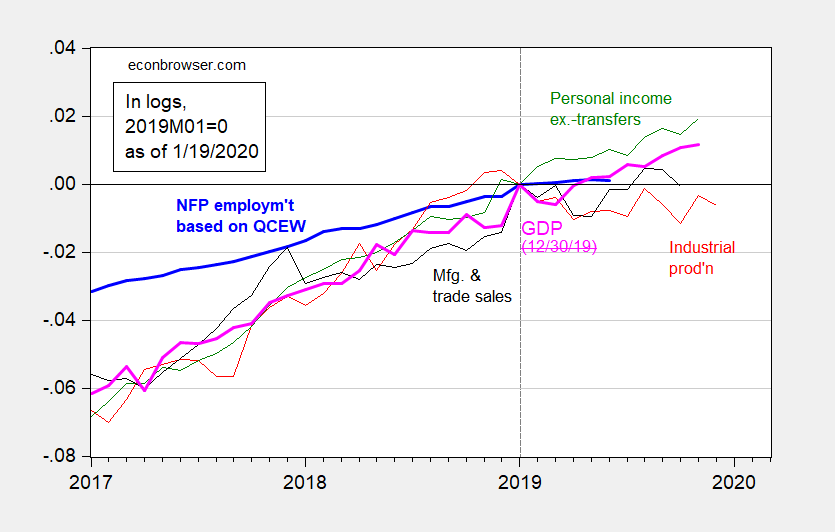
As noted previously, employment is likely to be revised downward, based on QCEW trends. I redraw the figure using this implied series.
Figure 2: Nonfarm payroll employment implied by Quarterly Census of Employment and Wages (light bold blue), industrial production (red), personal income excluding transfers in Ch.2012$ (green), manufacturing and trade sales in Ch.2012$ (black), and monthly GDP in Ch.2012$ (pink), all log normalized to 2019M01=0. Source: BLS, Federal Reserve, BEA, via FRED, Macroeconomic Advisers (12/30 release), and author’s calculations.
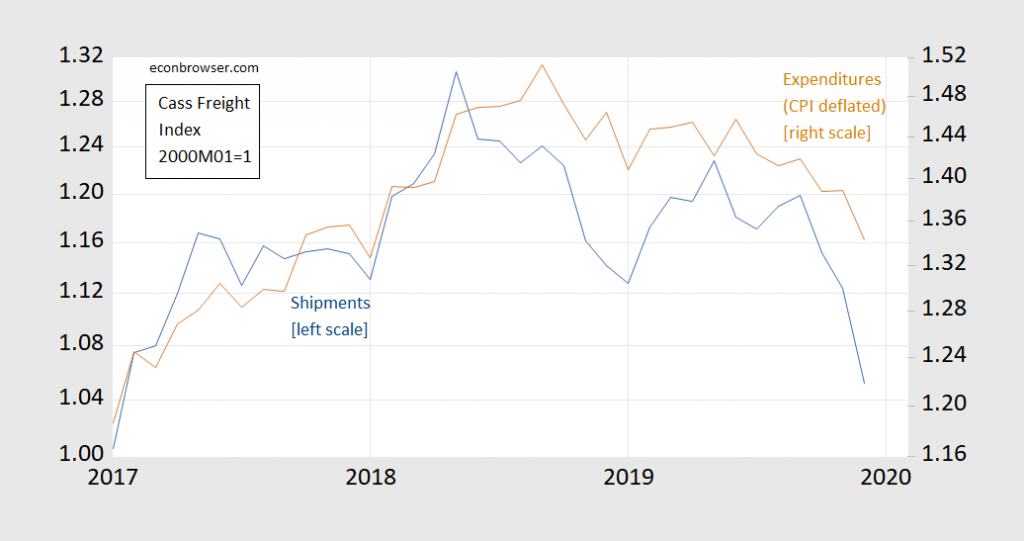
With industrial production and employment trending sideways, it’s hard to argue that recession is upon us. One alarming indicator is freight.
Figure 3: Cass Freight Index – Shipments (blue, left log scale); Expenditures deflated by CPI-all (brown, right log scale), both 2000M01=1. Source: Cass Information Systems, BLS via FRED, and author’s calculations.
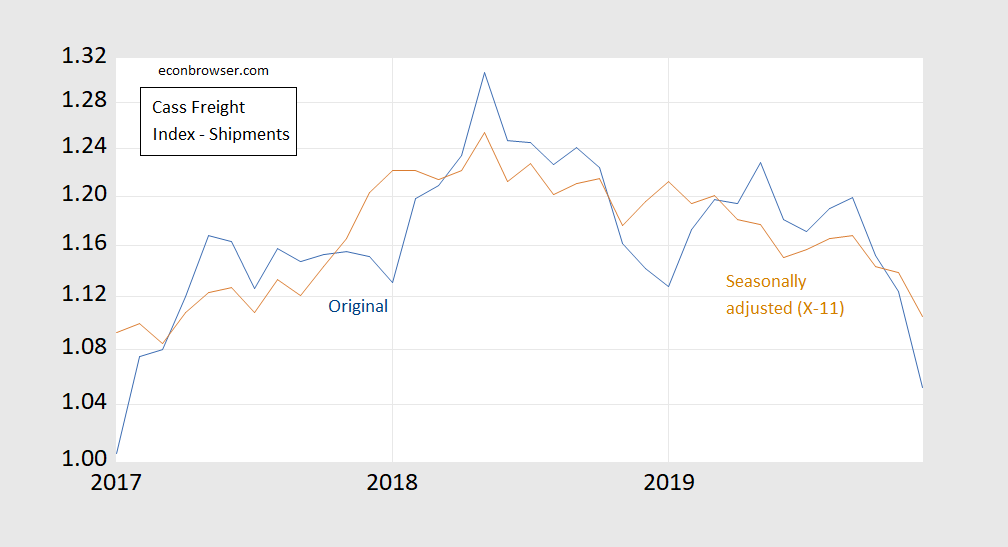
Figure 4: Cass Freight Index – Shipments (blue), and seasonally adjusted using Census X-11 (brown), both on log scale, 2000M01=1. Source: Cass Information System and author’s calculations.
Both graphs look bad, but David Ross at Cass Freight Index has more commentary.
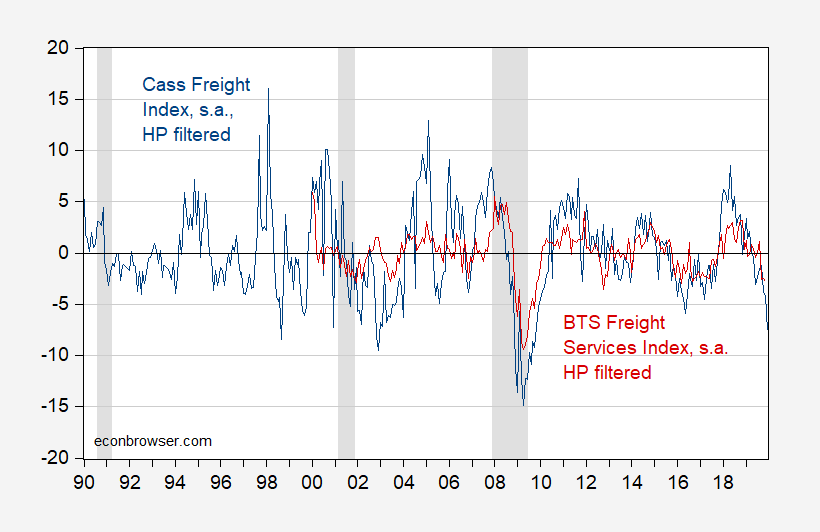
Update, 1/20/20 4:40pm Pacific: Some questions have arisen regarding the excess volatility of te Cass index. Below, I show HP-filtered (2-sided) Cass Freight Index – Shipments and compare with the Bureau of Transportation Statistics Freight Services Index.
Figure 3: Cass Freight Index – Shipments x100, seasonally adjusted using X-11 (dark blue), and BTS Freight Services Index (dark red), both HP-filtered (2-sided). NBER defined recession dates shaded gray. Source: Cass Freight Systems, and BTS via FRED, NBER, and author’s calculations.
I have to shamefully confess (especially as I have harangued to Menzie how much I highly regard and pay homage to the number). I have been lazy and not monitored the Cass Freight index number recently. I think if I was in Menzie’s class he would have half beat me with a policeman’s nightstick by now. Or maybe a large maglite. Of course EVERY fiber of my being wants to believe (from a selfish standpoint and the part of me that loves/wants to be right and “correct” about things) that we are near to or are just entering a recession. I am going to reserve claiming victory on my prediction of a USA recession before late July 2020 until more numbers verify this stance.
Suffice it to say, I am certainly not arguing with the possibility we are near the doorstep of recession.
The Cass Freight Index has major problems as an indicator. It is both extremely volatile and too sensitive to the downside. As a general rule, a measure of goods production, and a measure of their transport to market, ought to move in tandem. But over its 30 year history, the Cass Freight Index is much more volatile than industrial production.
Even more problematic, the Index, which is not seasonally adjusted, even on a YoY basis has been negative far too often. Here’s its record:
– 1990s expansion: negative 67 of 120 months (56% of the time)
– 2000s expansion: negative 42 of 73 months (58% of the time)
– 2010s expansion (through 2018): negative 68 of 114 months (60% of the time)
Simply put, an index that is negative over half of the time during an expansion is too bearish.
The DoT’s Freight Transportation Index is delayed by one month, but has been much less volatile and much more in line with production. A reading below -4% has been the harbinger of both most recent recessions. It is only down -0.8% now.
@ New Deal Dem
The numbers you quoted, we are going to work on the system of honor, and I will assume they are all correct. But I think that is why the first graph Mr. Ross presented in his write up was year-over-year numbers, would that be a safe assumption?? That may also be why Menzie uses logs when he quotes the numbers. There are mathematical and statistical tools to use to “smooth out” (pardon my Joe Six-pack lexicon) the numbers. Only the village idiot or newly initiated would just look at month to month.
And I welcome Menzie’s correction there or further exposition if the spirit moves him.
No need to take my word for it; here’s the YoY graph:
https://fred.stlouisfed.org/graph/?g=pY0R
OK the FRED graph shows a lot of volatility. But note this index’s big drops came during the last two recessions.
NewDealDemocrat: I have added a graph of HP detrended Cass and BTS freight indexes at end of post.
“David Ross at Cass Freight Index”.
His graph shows 2019 is a bit worse than say the 2014-2015 period but not nearly as bad as 2008. Oh well – McConnell’s father in law and Wilbur Ross were big in the shipping sector so maybe they are making money by short selling!
Dear Folks,
This is not an endorsement of the “recession is imminent” thesis. It is just to add some facts to what seems to be a very odd picture – if employment is down, why should personal income be up? The BEA tables, in particular, Table 5.1. Saving and Investment by Sector, show that while undistributed business profits (Line 5) are down but are about mid-range for the last 2 (not 3) years, Inventory Valuation, Corporate (Line 6) is back up to the (volatile) level of the 2012-2016 years. And private saving is also up. Both Personal Saving and Domestic Business Saving are up, modestly. But Government Saving is another big negative, and is the worst it has been since 2011. So it seems that deficits are propping this up, and this behavior can last for a while. It can’t increase indefinitely, and it is a question of what policies will be pursued, and what events will happen in the world, as to how long it will last.
Julian
Agreed – it isn’t making a whole lot of sense. There’s got to be something wrong with my usual tea leaf reading or with the data. This time is never different except in small-ish ways.
I have stayed away from making a personal forecast of whether ot not we are going to have a recession by the end of this year, even as I reported Jim Hamilton’s argument from the San Diego meetings that we are not too likely to, although not out of the question. As it is, I would say that these latest numbers do not look like a harbinger of imminent recession. However, they do suggest a possible slowdown in the rate of growth in the near term, which is certainly not what Trump and his allies are forecasting, with him arguing his China trade deal is about to really stimulate the economy.
Recent posts by Menzie and commentary by others (including me) suggest that this trade deal is not likely to provide all that much stimulus, with most tariffs still in place, although maybe a pickup in ag sales to China happening.Today’s WaPo brings out another sector likely to do well as a result of the deal: banking and finance, with a lot of major CEOs from that sector showing up to celebrate the signing with Trump. That may be, but this is a sector that I do not see stimulating the broader US economy all that much. As it is, for the currently mildly declining manufacturing sector, I do not see a lot in the way of gains from this deal. So, even if there is no recession, I do not see much in the way of growth stimulus going on here and the prospect for slower growth quite likely.
Earlier this evening on some Bloomberg TV talk show somebody reported on a poll that is taken each year at Davos of CEOs there regarding their expectations/forecasts for the world economy for the coming year. Apparently they are pessimistic, not actually predicting outright recession, but the claim was made that this was the most pessimistic annual forecast out of this group since 2009, for whatever that is worth. So, the forecast of a slowdown this year, if not necessarily a recession, seems to have some support in certain circles.
There’s way too much noise in the data to know what to expect for now. At least for me to know what to expect. It may be an extended period of choppiness at the inflection point.
Lets remember that real final demand surged in 2019 after sluggish 2018. Now some of this is shutdown driven paranoia that created a large dip by December 2018 and then a large rise the next month in January 2019. If you put each month at “0”, then real final demand is more balanced between the 2 years.
Most likely both GDP and job growth will face some downward revisions(though, probably not as large as the 2018 ones). I think the real problem is that subprime consumer lending has underwritten the expansion and they really started jacking up rates in 2019 to stop the bad loans they have been acquiring for years now. In the end 1000’s of these banks are likely going to go under anyway. This is the first blow. That is why a recession is likely the 2nd half of the year(which with census job cuts, adds lipstick to the corpse). Its the egg and corporate debt is the chicken. Once the economy turns down with real final demand growth stopping, the market implodes as buybacks dry up, corporate debt falls and a contraction takes place. I see it equity positions of “correction” “bounce” then “crash/recession”.
Real sales are here already. According to David Rosenberg, Real retail sales were negative in Q4 2019 , per figures of the US govt. Recession is now.
I’m pretty sure we are not in a recession. David Rosenberg has more information and more technical knowledge than I do, but if he’s saying we are currently in a recession, then he’s wrong. My take is that we may have had a slowdown like happened in 2016, but that we dodged the bullet so far. The fed has actually managed things fairly well, which is a bonus in this age of spleen driven decisions.
I’m still thinking we will have noticeable downturn or recession later this year, but I’m less convinced than I was a few months ago.