Today we are fortunate to present a guest post written by Michele Ca’ Zorzi (ECB), Adam Cap (BIS), Andrej Mijakovic (European University Institute) and Michal Rubaszek (SGH Warsaw School of Economics). The views expressed in this paper are those of the authors and not necessarily those of the institutions they are affiliated with.
Central banks and financial institutions regularly assess equilibrium exchange rates. In a newly released ECB Working Paper we evaluate the three most popular methods for calculating equilibrium exchange rates on the basis of their predictive power.
- Three methods to assess equilibrium exchange rates
The first method is based on Purchasing Power Parity (PPP), the oldest theory of real exchange rate determination. The PPP model says that nominal exchange rates evolve to neutralize cross-country competitiveness changes from movements in relative prices, implying that real exchange rates are mean reverting processes. The second method, known in the literature as the Behavioral Equilibrium Exchange Rate (BEER) model, links equilibrium exchange rates to a set of economic fundamentals and assumes that real exchange rates revert to such equilibria. The third method, the Macroeconomic Balance (MB) approach, defines equilibrium exchange rates from a current account sustainability perspective. In this framework equilibrium exchange rates are derived under the assumption that current account imbalances self-adjust via changes in relative prices. A detailed description of these methodologies is presented by MacDonald (1998), Driver and Westaway (2004), Isard (2007), Cheung et al. (2019) and Cubeddu et al. (2019). In what follows we rely on a rich quarterly dataset spanning 1975 to 2018 for ten advanced countries, which allows us to carry out a meaningful forecasting evaluation exercise.
- Do exchange rates converge to their equilibrium values in-sample?
One relevant question from a policy perspective is whether estimated exchange rate equilibria are informative about the direction of real exchange rate movements over medium-to-long-term horizons. The easiest way to get an answer is to plot real effective exchange rate changes for various horizons h vis-à-vis real exchange rate deviations from equilibrium (exchange rate gaps) derived using different models, M. Such plots are presented in Figure 1, where for ease of exposition the real effective exchange rates of the euro and the dollar are marked with yellow and red dots, respectively.
A negative slope indicates that exchange rates partly absorb the initial exchange rate gaps. At the one-quarter horizon the slope is almost flat for all three models. At longer horizons, however, for the PPP and BEER models the dots gradually align along the diagonal, suggesting a nearly perfect adjustment towards equilibrium. Equilibrium exchange rates calculated with these two methods have, in other words, predictive power. In the case of the MB model the dots do not show any tendency to align along the diagonal, implying that exchange rates do not converge to their estimated equilibrium values.
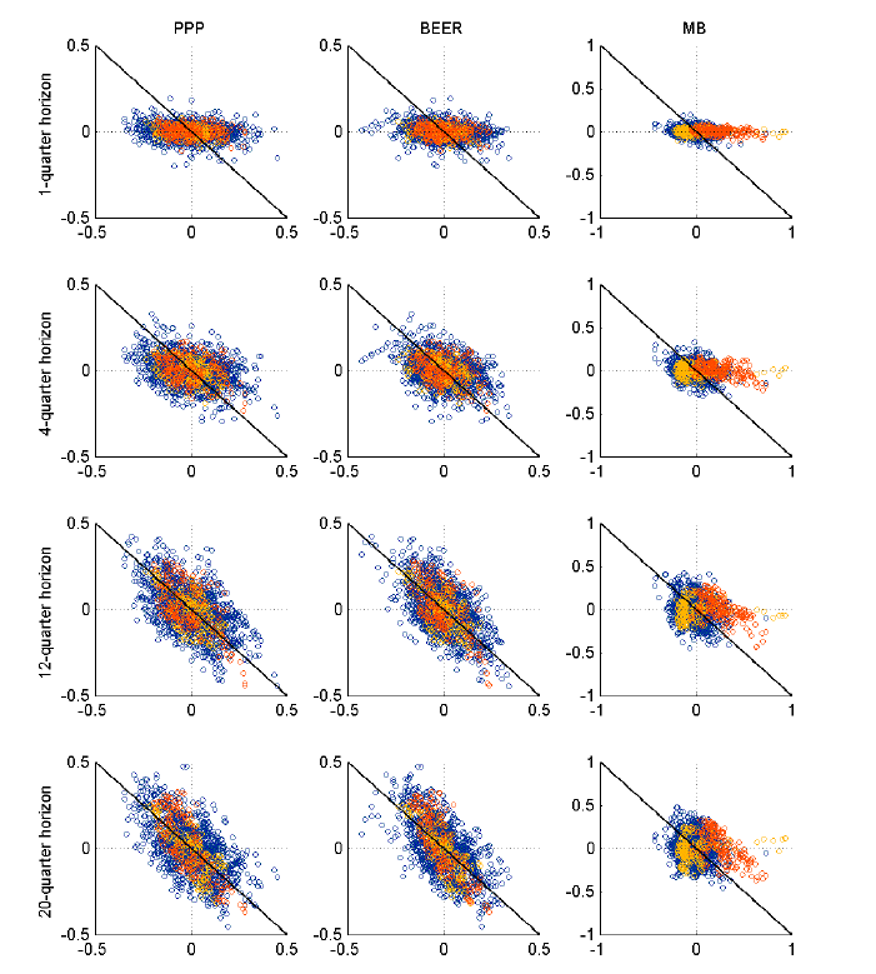
Figure 1: Exchange rate adjustment in response to an exchange rate gap
Notes: The x-axis of the figure represents deviations of real effective exchange rates from their full-sample equilibrium, whereas the y-axis represents subsequent real effective exchange rate adjustments. USD and EUR are marked with red and yellow dots, respectively, while the blue dots denote the remaining eight currencies in the sample. The diagonal line represents perfect adjustment to equilibrium over the respective horizon.
- Do equilibrium exchange rate models have predictive power out-of-sample?
In the paper, we then switch to a fully-fledged forecasting competition. For each model, , currency and vintage of data , we generate a path of forecasts for horizons using panel regressions:

In this notation denotes the equilibrium exchange rate at time calculated using model , whereas and denote adjustment parameters, all values estimated with sample . Given that is progressively moved forward between 1994Q4 and 2018Q3, this gives us 96 forecasting trajectories up to 20 quarters ahead for each currency . In Figure 2 we show the results for the euro and US dollar. For these two currencies the forecasts generated with the PPP and BEER models are similar and much more accurate than those derived with the MB approach.
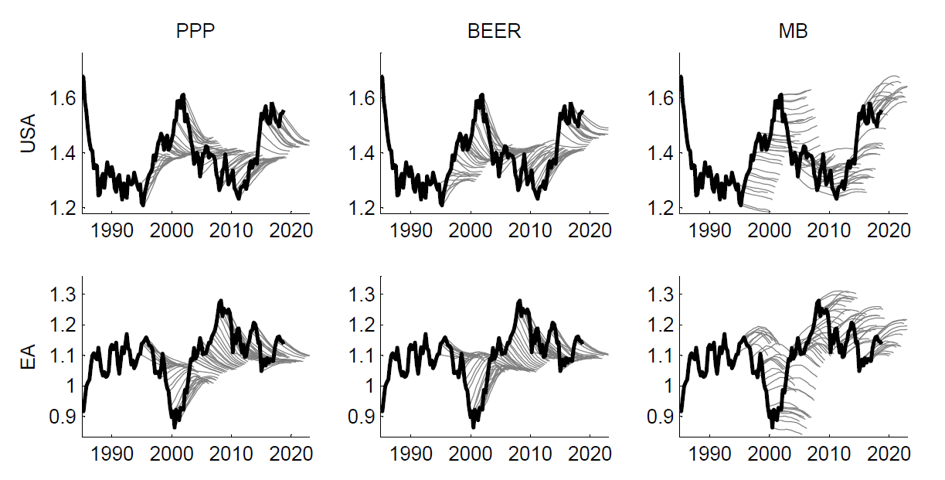
Figure 2: Sequential forecasts vs. the realized real exchange rate
Notes: Values are expressed as the logs of the real effective exchange rates.
Table 1 presents a more formal evaluation of forecast accuracy by reporting the root mean squared forecast error of the three models relative to the random walk (RW) benchmark. The results show that the PPP model performs generally well. At long horizons it significantly outperforms the RW for six countries (CAN, EA, GBR, JPN, NOR and USA). In three other cases the performance is almost identical (AUS, CHE and NZL) while in one case only PPP is beaten by the RW (SWE). The BEER model is almost as competitive as PPP, but not systematically better; the attempt to capture the role of economic fundamentals has a mixed impact on forecasting performance depending on the country. The table also reveals that the MB model is outperformed by the RW six times out of ten. For the United States and the euro area, the predictive power of the MB model is much worse than that of the PPP or BEER models. Paradoxically, the MB model performs slightly better out-of-sample than in-sample. The reason is that the empirical model only detects a very slow pace of adjustment toward equilibrium, i.e. the estimates of the adjustment coefficient from eq. (1) are close to zero. Forecasts generated with the MB model hence tend to be closer to the RW than those generated by the other two models.
Table 1: Root mean squared forecast error for the real effective exchange rates
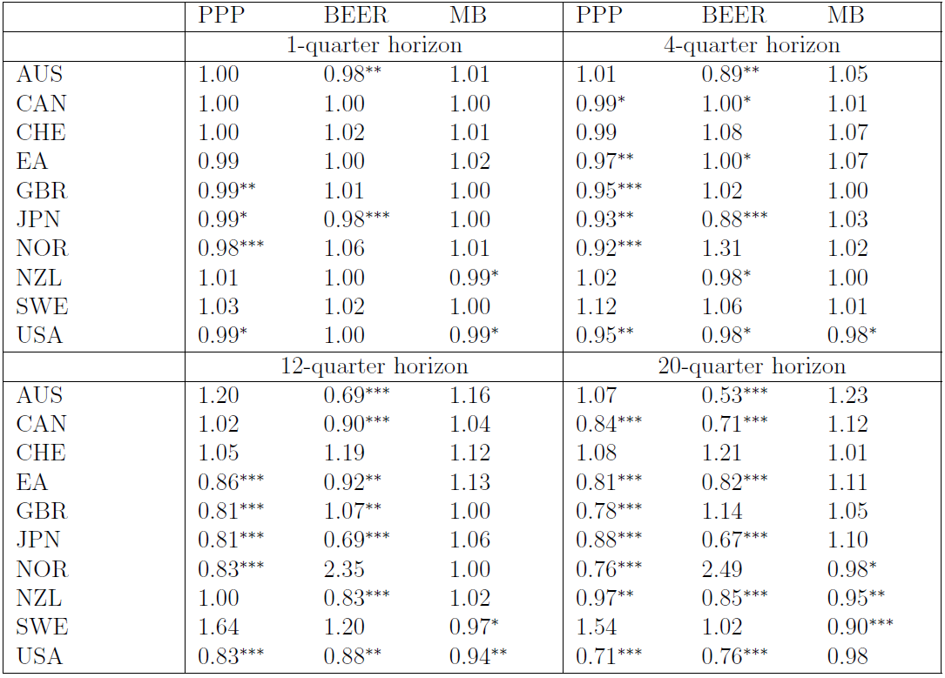
Notes: The table shows the ratios of the RMSFE from a given model in comparison to the random walk benchmark so that values below unity indicate that forecasts from the model are more accurate than the benchmark. Asterisks ***, ** and * denote, respectively, the 1%, 5% and 10% significance levels of the Clark-West test, where the long-run variance is calculated with the Newey-West method.
- Concluding remarks
The key insight of our paper is the presence of a trade-off between storytelling and predictability of equilibrium exchange rates. In terms of economic intuition, the PPP model offers little else but the notion that real exchange rates are mean reverting.[1] The BEER model looks more promising from an in-sample perspective, as it links the evolution of real exchange rates to that of economic fundamentals. The MB is the most appealing approach from a storytelling perspective, as it requires a definition of what constitutes an external imbalance and a clear hypothesis on how exchange rates affect trade volumes and prices and hence of the current account adjustment process. In terms of predictive power however, our model ranking flips. The PPP model produces the simplest and most reliable real exchange rate forecasts, closely followed by the BEER. The MB model performs poorly, not only in-sample but also out-of-sample, despite the fact that it tends to mimic the RW.
In this context, our paper delivers a dual message. The positive one is that real effective exchange rates tend to converge to equilibrium exchange rates when the latter are calculated with the PPP and BEER models. The negative message is that exchange rates are only weakly connected to economic fundamentals, even in the long-run. Our findings also confirm that, at least in normal times, exchange rates don’t move in the direction that would help unwind current account imbalances. Furthermore, the analysis sends a warning to equilibrium exchange rate modelers. To the extent that equilibrium exchange rates should help predict exchange rate movements, the ambition of developing comprehensive models with an ever-larger set of economic fundamentals might be counterproductive out of sample.
References
Ca’ Zorzi, M., Cap, A., Mijakovic A., Rubaszek M., 2020. The predictive power of equilibrium exchange rate models, ECB Working Paper 2358.
Ca’ Zorzi, M., Rubaszek, M., 2020. Exchange rate forecasting on a napkin. Journal of International Money and Finance, In Press, https://doi.org/10.1016/j.jimonfin.2020.102168.
Cheung, Y.-W., Chinn, M. D., Pascual, A. G., Zhang, Y., 2019. Exchange rate prediction redux: New models, new data, new currencies. Journal of International Money and Finance 95, 332-336.
Cubeddu, L. M., Krogstrup, S., Adler, G., Rabanal, P., Dao, M. C., Hannan, S. A., Juvenal, L., Buitron, C. O., Rebillard, C., Garcia-Macia, D., Jones, C., 2019. The External Balance Assessment methodology: 2018 update. IMF Working Papers 19/65, International Monetary Fund.
Driver, R. L., Westaway, P. F., 2004. Concepts of equilibrium exchange rate. Working Paper Series 248, Bank of England.
Isard, P., 2007. Equilibrium exchange rates: Assessment methodologies. Working Paper 296, International Monetary Fund.
MacDonald, R., 1998. What determines real exchange rates?: The long and the short of it. Journal of International Financial Markets, Institutions and Money 8 (2), 117-153.
[1] We have explored elsewhere how the mean reverting property of real exchange rates can also be exploited to forecast nominal exchange rates (Ca’ Zorzi and Rubaszek, 2020), see also the Econbrowser version (link).
This post written by Michele Ca’ Zorzi, Adam Cap, Andrej Mijakovic and Michał Rubaszek.
I would have made a comment by now, but I like to get a grip on topics first rather than talk out of my nether regions. I suspect others are the same way and that’s why this thread is quiet. This looks like a good one and we appreciate the guest contributors’ labors.
The longstanding story on this was that there was a tebdebct fir abiyt a 15% per year cinvergence n the PPP-defined FER. I was unable to figure out from this paper their view on that old story.
So many thoughts relating to this comment…….
That should have read 15% per year convergence for the PPP model, an old “stylized fact” of exchange rate modeling.
Dear Folks,
Maybe I am missing something, but aren’t the macroeconomic fundamentals related to the other two? If so, wouldn’t the difference be just a matter of recording – the data for the fundamentals not showing up as frequently as the prices?
J.
Julian,
You’re correct. It’s a writing problem. The author specifies “external balances” in the first paragraph of the conclusion, “economic fundamentals” in the second. External balances are not predictive, but other fundamental factors, such as inflation (PPP) and “a set of economic fundamentals” (BEER) are at work in the other two models which are found to have predictive value. If the author had stuck with saying external balances (MB) aren’t predictive, confusion could have been avoided,
Dear m.,
Thank you.
J.