How would you answer Question 2?
-
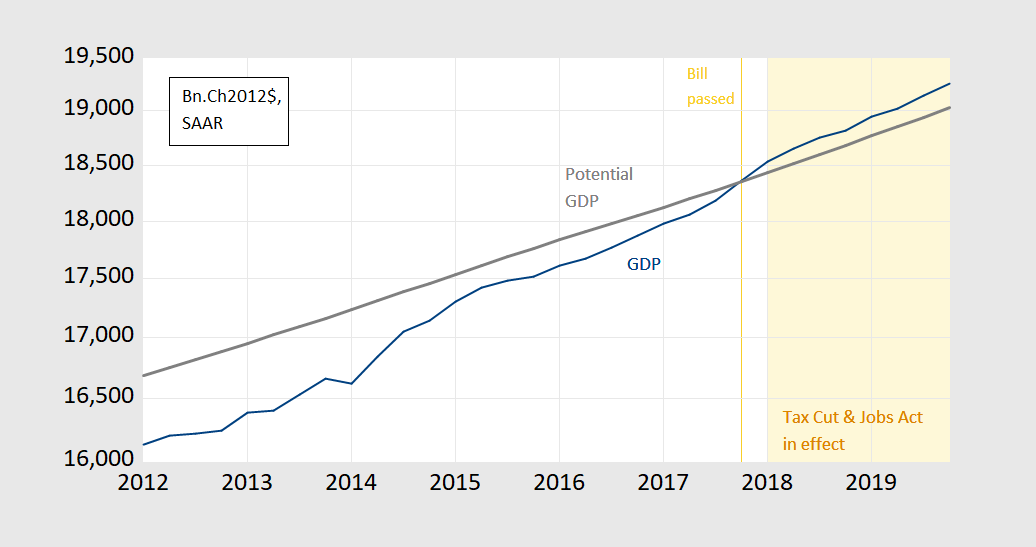
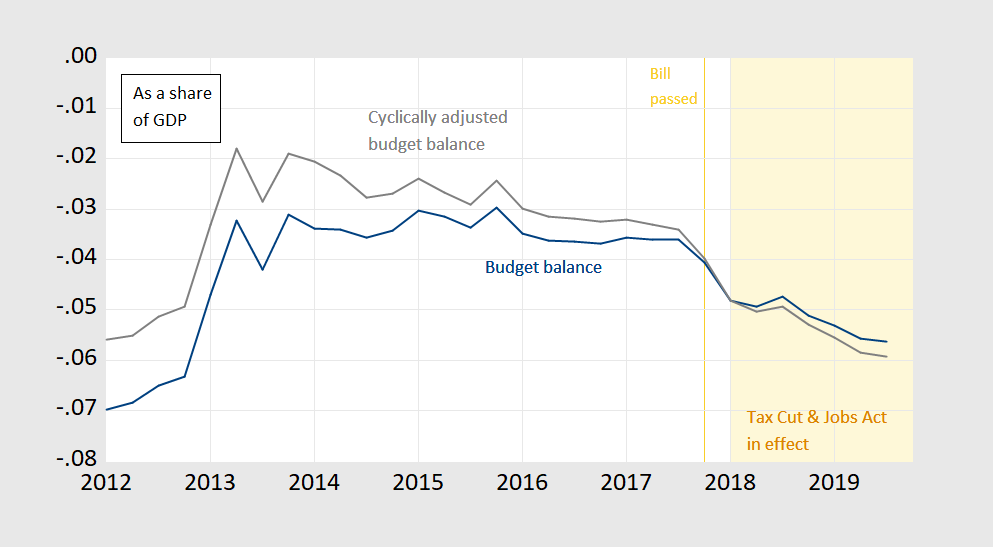
[20 minutes] Consider expansionary fiscal policy in 2017-2018, in the form of the Tax Cuts and Jobs Act. The tax cut increased the federal debt by about $1.5 trillion over ten years.
Chart 1.
Chart 2.
2.1 Do you expect the fiscal multipliers to have been relatively large or small for the tax cut at the time of passage? Why? Use equations or graphs to explain.
2.2 If the intent of fiscal policy is to stabilize the economy around Yn, and to stabilize the country’s finances, did the tax cut passed at the end of 2017 make sense?
Here’s my answers:
-
[20 minutes] Consider expansionary fiscal policy in 2017-2018, in the form of the Tax Cuts and Jobs Act. The tax cut increased the federal debt by about $1.5 trillion over ten years.
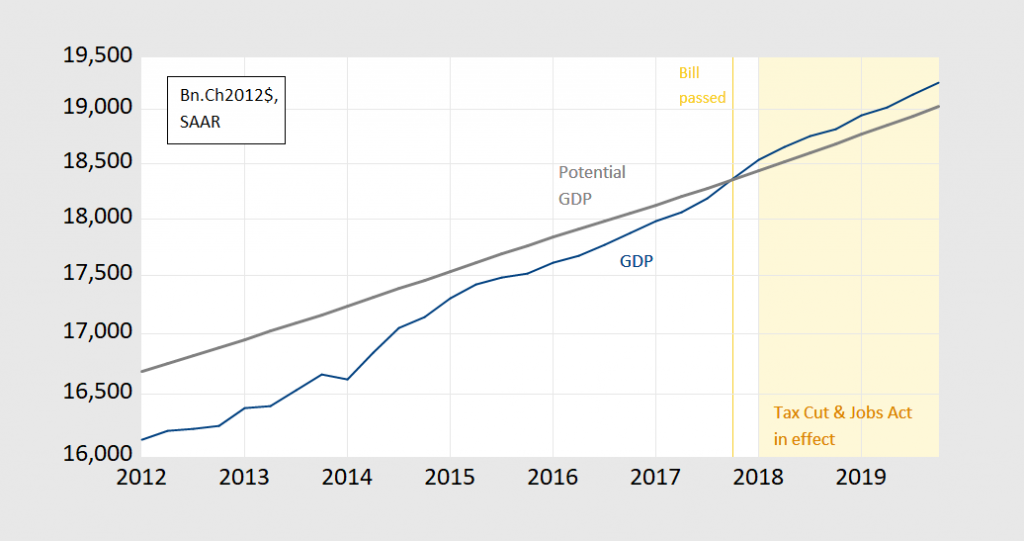
Chart 1.
Chart 2.
2.1 Do you expect the fiscal multipliers to have been relatively large or small for the tax cut at the time of passage? Why? Use equations or graphs to explain.
The output gap was essentially zero in the last quarter of 2017. The evidence by Auerbach and Gorodnichenko is that multipliers are fairly small when output is high relative to potential GDP (Yn) or increasing, and larger when output is low relative to potential GDP (Yn) or decreasing. This can be explained by the aggregate supply curve being kinked so that it is steeper Y > Yn, and flatter Y < Yn. This is shown in Figure 1 below (yFE is same as Yn) Figure 1.
An alternative explanation is Fed monetary policy tends to tighten when output rises above Yn, and tends to loosen when output falls below Yn. Suppose the IS curve is shifting due to changes in taxes; the LM curve shifts mean that the change in income is smaller above Yn, than below Yn.
Figure 2.
2.2 If the intent of fiscal policy is to stabilize the economy around Yn, and to stabilize the country’s finances, did the tax cut passed at the end of 2017 make sense?
Output was at full employment levels at 2017Q4, so a tax cut at that time did not make sense, as it pushed output *away* from potential GDP. Moreover, at full employment, you want the cyclically adjusted budget balance at about zero. It was already at -3% of GDP then, and the tax cut just made the cyclically adjusted budget balance even worse.


“You have committed the fallacy of the excluded neither” …{No, no, that’s not right. Wait (flip, flip, flip), ah, here it is…false dilemma.}
“You have committed the fallacy of the false dilemma.” …{Hang on. He didn’t say that either a small or large multiplier couldn’t be negative.}
“Uh, Professor Chinn, could the multiplier be negative?”
macroduck: Could be, as they know from this handout: http://www.ssc.wisc.edu/~mchinn/e442_portfoliocrowd_f20.pdf
I’m a fan of IS-LM toolkit. It strikes me the question is suited for it. I’m guessing by Menzie’s standards this is a softball question. Yet it incentivizes students to think in a big picture way and is very real world useful. And although I would have struggled greatly with the graphs if I was in Menzie’s course, the general idea I think I would have gotten and probably could have gotten 80% of the essay logic correct, Though Menzie probably would have failed me on the graph portion due to lack of completion. But former screwball students like me need/needed these type questions to have hope for the 2nd portion of the course. Therefor goofball degenerate Joe Six-pack Uncle Moses approves of and greatly endorses these type IS-LM questions, certainly in the foundational courses, even though now IS-LM is regarded in some circles as “old school” and “somewhat dated”.
Yang’s description implies that he got the actual vaccine. Though even with very intelligent people, the mind can play tricks on you (not that I’d know anything about that). I believe he probably did get the vaccine shot. I imagine there’s chemical tests he could do, but maybe he signed something that prohibits him from finding out:
https://www.youtube.com/watch?v=JpQ6zRCSLKc
Unrelated to this post’s topic, but something I thought was interesting
:https://ondemand.npr.org/anon.npr-mp3/npr/me/2020/11/20201116_me_paulson_us-china_compete_for_technological_innovative_superiority.mp3?orgId=1&topicId=1017&d=426&p=3&story=935297004&dl=1&siteplayer=true&size=6800853&dl=1
The most interesting portion to me, quoted from Steve Inskeep trying to cut through Hank Paulson’s usual B.S. of saying something without ever having to say anything.
INSKEEP: I think you’re saying that if the United States is going to push back on Huawei, it needs to be competitive with Huawei in terms of the products that are available so that the United States and other countries don’t actually need Huawei. Is that the kind of thing you’re saying?
I have experience in this sector. I’m not surprised an American brand has nothing. That part of the tech sector is oligopolies at this point and they would sue any small American competitor out of the market as has been the case for 20+ years.
Hey America, how’s that lightly regulated capitalism going?
In a general way I agree this is a part of the problem. Though it’s not always a “competitor”. How much credit did Steve Jobs get for his engineers and software gunslingers hard work?? The creator of DOS got how much in return from Bill Gates on Windows OS??? Even Lee Iacocca did some of this back in the day. If you come up with great ideas your employer gets to steal it from you and take all the bows. Do you want to put the sweat in when you know Steve Jobs is going to get the media interviews, the stock options bonuses, and ride off into the sunset on your sweat and blood?? Maybe at that point you just say you’ll take a 6-figure salary, live in the suburbs and call it a day. The two stomach ulcers and mild stroke in your late 50s just wasn’t worth sitting in the audience and clapping robotically at MacWorld Expo 2007.
I wonder how Gerald Friedman might answer this question. After all – he seems to think potential GDP is multiples of what CBO estimates.
November 18, 2020
Coronavirus
US
Cases ( 11,873,727)
Deaths ( 256,254)
India
Cases ( 8,958,143)
Deaths ( 131,618)
France
Cases ( 2,065,138)
Deaths ( 46,698)
UK
Cases ( 1,430,341)
Deaths ( 53,274)
Mexico
Cases ( 1,011,153)
Deaths ( 99,026)
Germany
Cases ( 854,533)
Deaths ( 13,492)
Canada
Cases ( 311,109)
Deaths ( 11,186)
China
Cases ( 86,369)
Deaths ( 4,634)
November 18, 2020
Coronavirus (Deaths per million)
UK ( 783)
US ( 772)
Mexico ( 765)
France ( 715)
Canada ( 295)
Germany ( 161)
India ( 95)
China ( 3)
Notice the ratios of deaths to coronavirus cases are 9.8%, 3.7% and 2.3% for Mexico, the United Kingdom and France respectively.
https://news.cgtn.com/news/2020-11-19/Chinese-mainland-reports-12-new-COVID-19-cases-VxyvjGUkPm/index.html
November 19, 2020
Chinese mainland reports 12 new COVID-19 cases
The Chinese mainland registered 12 new COVID-19 cases on Wednesday, all from overseas, the National Health Commission announced on Thursday.
A total of 10 new asymptomatic COVID-19 cases were recorded, while 419 asymptomatic patients remain under medical observation. No COVID-19-related deaths were reported on Wednesday, and 22 patients were discharged from hospitals.
As of Wednesday, the total confirmed COVID-19 cases reached 86,381, with 4,634 fatalities.
Chinese mainland new imported cases
https://news.cgtn.com/news/2020-11-19/Chinese-mainland-reports-12-new-COVID-19-cases-VxyvjGUkPm/img/e05d5e8f22f24a9eae699054c2e4bd73/e05d5e8f22f24a9eae699054c2e4bd73.jpeg
Chinese mainland new asymptomatic cases
https://news.cgtn.com/news/2020-11-19/Chinese-mainland-reports-12-new-COVID-19-cases-VxyvjGUkPm/img/c30ebfda48814463ba6851befe8dcda7/c30ebfda48814463ba6851befe8dcda7.jpeg
[ There has been no coronavirus death on the Chinese mainland since May 17. Since June began there have been 5 limited community clusters of infections, each of which was contained with mass testing, contact tracing and quarantine, with each outbreak ending completely in a few weeks.
Imported coronavirus cases are caught at entry points with required testing and immediate quarantine. Asymptomatic cases are all quarantined. The flow of imported cases to China is low, but has been persistent.
There are now 314 active coronavirus cases in all on the Chinese mainland, 1 of which cases is classed as serious or critical. ]
Do you really think the U.S. economy was reflating for over two years before COVID (i.e., running above potential GDP)? Where was the inflation?
The tax cuts mainly affected wealthy households and had little effect on expenditure–hence small multipliers. Nothing to do with supply constraints, IMHO. Guess I would have bombed this one.
tom michl: The students could’ve answered that the distributional aspects of the tax cut (i.e., benefits going to low MPC households) meant smaller effects, which I did mention in discussion of CBO multipliers (see slide 36, Lecture 11: https://www.ssc.wisc.edu/~mchinn/e442_lecture11_f20.pdf ). The answers I gave weren’t exhaustive, and the MPC issue was a topic covered for Midterm 1. So… you would’ve passed. However, the graphs I provided weren’t directed at that answer, so maybe not full credit.
Let’s admit that estimating potential output is not the easiest task ever. So maybe the CBO model underestimates it a bit. But I have not seen very different answers from credible analyzes.
There were some signs of inflation accelerating before the pandemic hit………….finally????
An alternative consideration is to look at how the tax cuts were distributed. Since most of the tax relief went to the wealthy, who spend a smaller share of their incomes than middle income Americans, then the overall effect of the stimulus was rather muted. However, it was enough to drive middle income (middle quintile) Americans’ real incomes up by 9.3% during Trump’s first three year as compared to a 2% total increase over the whole previous ten years. This probably contributed a lot to the large increase in the numbers of people voting for Tump, because they had felt better off until COVID.
IMO it’s important to look not just at aggregates, but also at distribution of stimulus to understand multipliers.
https://www2.census.gov/programs-surveys/cps/tables/time-series/historical-income-households/h03ar.xlsx
JohnH: Yes, the different MPC’s by group is a well understood issue, having implications for multipliers; part of my explanation for why some transfers multipliers are bigger than goods/svcs expenditures multipliers according to CBO (slide 36, lecture 11 https://www.ssc.wisc.edu/~mchinn/e442_lecture11_f20.pdf).
So Federal revenue sharing and other spending programs have high bangs for the buck than the tax and transfer payment ideas. Good old fashion macroeconomics even if this will rile Greg Mankiw!
pgl: Maybe. I think Mankiw was or is on the board of academic advisers.
I noted distributional effects because I remember Stiglitz writing back in 2012 that the Fed ignores distributional consequences of their decisions. Perhaps they’ve wised up as a result of years of accusations that their monetary decisions are extraordinarily reactive to the markets.
JohnH: The Fed’s new monetary strategy implicitly allows for targeting maximal employment partly because of distributional effects of monetary policy.
Incomes are laggards. Low information voters don’t realize this. If inflation was rising to 3%+ in 2020, the expansion was in trouble. That was a sign of high corporate debt servicing dragging down investment.
High corporate debt servicing cannot drag down investment if debt service costs aren’t high:
https://knoema.com/BISDSRPNFS2016/debt-service-ratios-for-the-private-non-financial-sector?tsId=1000650
But thanks for playing.
Sorry, but debts were high. The servicing was the reason why business spending was slowing the way it was in 2019. First the servicing lowers investment and hiring stops. Next subprime(in this case) debt markets crash leading to a nonbank crisis. The same as it always was.
Menzie The IS-LM graph shows a shift in the IS curve as the main effect of Trump’s tax cut for the wealthy. It’s been many, many decades, but as I recall a change in the tax rate primarily affects the slope of the IS curve. So with a cut in the tax rate that mainly benefited the wealthy I would have expected an increase in the MPS and a corresponding flattening of the IS curve as the dominant effect rather than a shift in the IS curve.
Oops. Rereading I see that something got mangled. A cut that benefited the wealthy and increased the MPS would likely steepen the IS curve, but if the tax cut had neutral effects on the MPC, then it would tend to flatten the IS curve. In any event, my recollection is that changes in tax rates mainly operate on the slope of the IS curve whereas an increase in spending acts as a shift in the IS curve.
2slugbaits: Yes, in principle reduction in tax rate would flatten slope of IS curve. I think of some of that tax cut as having a lump sum type of effect, but I’m not wedded to that view.
Interesting handouts. Any chance there are others available to non-students? I’m asking because, uh, because Moses would probably like to see them.
macroduck: All this semester’s slides/handouts on this website: https://www.ssc.wisc.edu/~mchinn/web442_f20.html. Last Fall’s “Financial System” here: https://www.ssc.wisc.edu/~mchinn/web435_f19.html
That’s superbly kind of both of you gentlemen, Sirs macroduck and Chinn. It is appreciated.
A pleasure, sir.
And thanks to the other sir.
https://twitter.com/paulkrugman/status/1329184876684316682
Paul Krugman @paulkrugman
The next few months will be terrible, politically and economically, and a lot of people will be impoverished and die unnecessarily. But vaccination is coming — and when it does, I suspect we’ll recover much faster than people expect 1/
5:09 PM · Nov 18, 2020
Recovery from the financial crisis was slow and grudging, and many expect the same to be true this time 2/
[Graph]
But that isn’t always the case after a severe recession. Pre-1990, recoveries tended to be rapid and V-shaped 3/
[Graph]
I’ve been arguing for a while that the Covid slump is more like 1979-1982 than 2007-2009, when recovery was held back by severely impaired household balance sheets 4/
[Graph]
This time balance sheets were back by the middle of the year, and have surely improved since then 5/
[Graph]
Partly that’s because people did a lot of saving in quarantine 6/
[Graph]
And they’ve accumulated a LOT of liquid assets 7/
[Graph]
So Biden will inherit a horrible situation once they carry Trump out of the White House. But he has a good chance of presiding over an impressive 2021-2022 boom 8/
Latin American countries have recorded 4 of the 11 and 6 of the 19 highest number of coronavirus cases among all countries. Brazil, Argentina, Colombia, Mexico, Peru and Chile. Mexico, with more than 1 million cases recorded, has the 4th highest number of cases among Latin American countries and the 11th highest number of cases among all countries.
November 18, 2020
Coronavirus (Deaths per million)
US ( 772) *
Brazil ( 786)
Argentina ( 801)
Colombia ( 677)
Mexico ( 765)
Peru ( 1,066)
Chile ( 777)
Ecuador ( 736)
Bolivia ( 756)
* Descending number of cases
Question 2 would have proven that I didn’t sign up for the class in time. There is always more for some us to learn.
To explain, I could write a story about what happened and why I thought it happened, but there would be no equation or even any comprehensible arithmetic.
@ Menzie
I have one of my weird random questions to ask you that you sometimes are kind enough to answer. Do states have a “state level” version of “GNP”?? (Yes, I meant GNP, not GDP). Would that be super-hard to do if they did??
I suspect larger states like California and Texas might do this, but I obviously have no idea.
Moses Herzog: Don’t think so. It would be really hard to track factor incomes and personal remittances across state borders.
Oh my, for once I am correcting Menzie on data, based on old experience of mine from working for the state govt of Wisconsin decades ago.
So, no, Menzie is right that states do not officially on a regular basis estimate state level GDPs. But every state has for many decades made such estimates, with most of these not publicly reported. These things vary from state to state. In most states these estimates are made by the agency that estimates likely tax revenues for the state, usually an agency with “budget” in its title. There are also plenty of private estimates of these state numbers.
So, indeed, there is no universally accepted, publicly reported, estimates of US state estimates of GDP. But there are plenty of such estimates out there, some privately estimated and public, and others that are state level publicly estimated but not “official.”
Barkley Rosser: The query was about state level GNP, i.e., including net factor income and net transfers. BEA does provide quarterly and annual state level GDP here: https://www.bea.gov/data/gdp/gdp-state
Most recent use of this data on Econbrowser: https://econbrowser.com/archives/2020/10/wisconsin-q2-gdp
I just “doubled-back” tonight to this post and noticed you answered this, and it is appreciated Sir.
Since this thread is luckily still open, I will drop a link that I think is applicable to the “macro” topic of the thread:
https://www.ft.com/content/39a6c0f4-cc28-4173-b7c4-05c65d3baacb
Again, I appreciate your kind answer to my GNP question.