The positive surprise in nonfarm payroll (NFP) employment — 379K vs Bloomberg consensus of 182K — was good news. However, it’s important to place this in context. NFP is 9.5 million lower (i.e., 6.2% lower) than the NBER peak in February 2020. In the context of key macro indicators followed by the NBER Business Cycle Dating Committee:
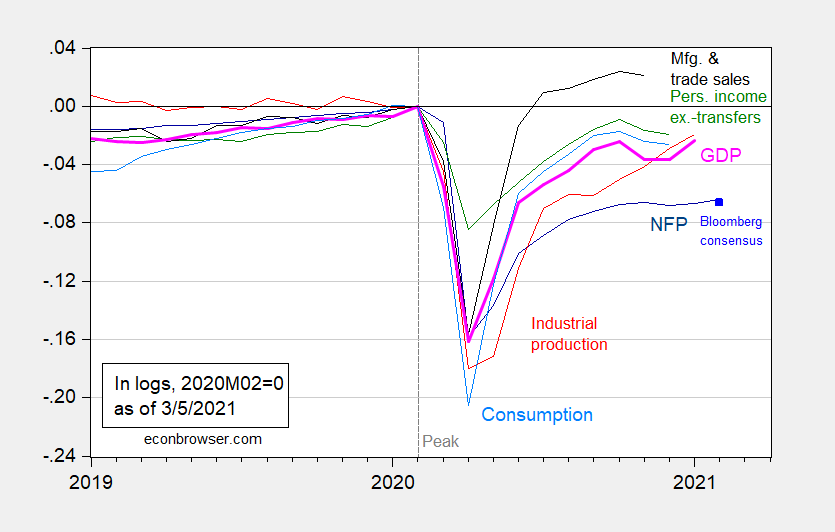
Figure 1: Nonfarm payroll employment (dark blue), Bloomberg consensus as of 3/3 for February nonfarm payroll employment (light blue square), industrial production (red), personal income excluding transfers in Ch.2012$ (green), manufacturing and trade sales in Ch.2012$ (black), consumption in Ch.2012$ (light blue), and monthly GDP in Ch.2012$ (pink), all log normalized to 2020M02=0. Source: BLS, Federal Reserve, BEA, via FRED, IHS Markit (nee Macroeconomic Advisers) (3/1/2021 release), NBER, and author’s calculations.
Notice that while the 375K number seems large relative to 182K, this increase still looks small relative to the gap between where we were in February, and where we are today. This can be seen also in the private nonfarm series:
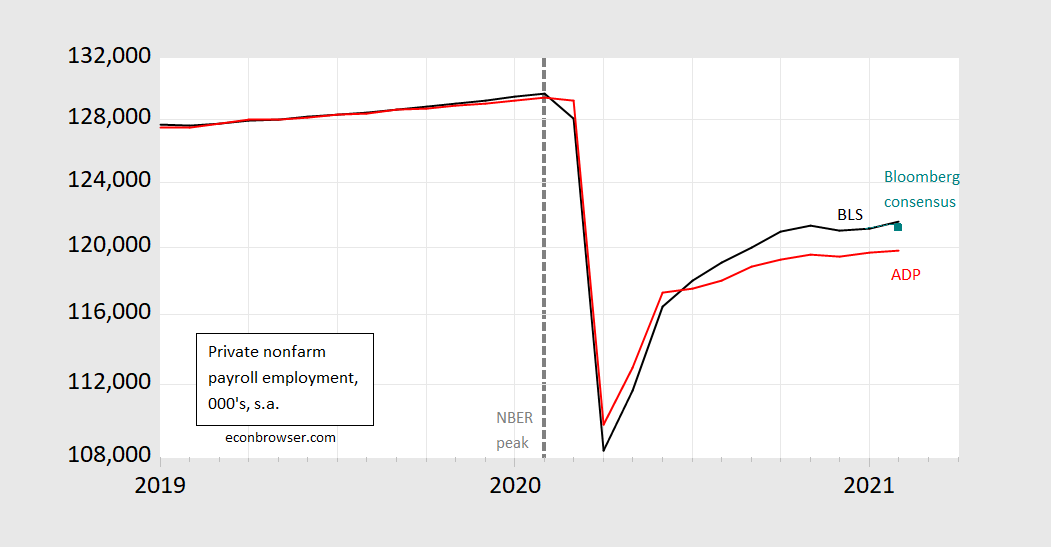
Figure 2: Private nonfarm payroll employment – BLS (blue), Bloomberg consensus as of 3/3 (teal square), private nonfarm payroll employment – ADP (red). Source: BLS, ADP, Bloomberg, and author’s calculations.
Employment in leisure and hospitality, specifically food services and drinking establishments, led the way in increasing overall NFP employment. Figure 3 shows the change attributable to food services and drinking establishments, vs. all else.

Figure 3: Change in employment in food services and drinking establishments (brown), and in rest of nonfarm payroll employment (green), in 000’s, s.a. Source: BLS, and author’s calculations.
That being said, food services and drinking establishment employment is down 2 million (16.4%) relative to February 2020. In contrast, manufacturing is down only 0.56 million (4.4%). The two sector recovery (goods faster than high-contact services) persists.
As for the household survey numbers, don’t forget that the official unemployment rate figure (which dropped to 6.2%) is not particularly informative. See Furman and Powell for a discussion; their estimate of the true rate is around 8.2% for February.
Let’s try this here.
This piece was viewed 41,000 times.
http://www.prienga.com/blog/2021/3/4/towards-100-oil
I’d add that WTI is over $66 now.
WTI is $66/barrel. That is not the spot price and you know it (or you should since you pretend to be THE expert). Now this is the futures price for April or May delivery:
https://www.cmegroup.com/trading/energy/crude-oil/light-sweet-crude_quotes_globex.html
And take note future prices for later deliveries are lower. And you keep harping prices will reach $100???
Either you are completely incompetent which means anyone who pays you for consulting is a fool or you get what I am saying here. Which means you choose to lie to us.
$66? Spot v. future? Hello? Sourcing data? How many times has Menzie asked us to do so?
Front month. From Bloomberg, obviously.
https://www.bloomberg.com/energy
But here it is on Oilprice.com (usually delayed)
https://oilprice.com/
Or Market Business Insider (spot)
https://markets.businessinsider.com/commodities/oil-price?type=wti
Barchart
https://www.barchart.com/futures/quotes/CL*0/futures-prices?viewName=main
I could gone on. Usually I assume that the readers on Econbrowser are able to find WTI without my having to source it for them.
The loose end here is indeed how slowly US production responds, and I am seeing mixed reports on that. There are some other players who might also ramp up production, such as Iraq or even Libya, although probably none of them have enough ability to do so sufficiently substantially to slow a rise to $100 per barrel if Russians and Saudis hold the line and economic recovery really takes off in US and elsewhere, although on the latter matter much of Europe seems seriously bogged down both economically and in terms of the pandemic. I just heard earlier today that Italy has just closed all their schools, with most of them having been open recently. There a lot of variables in play here on both the supply and demand sides.
Stevie wants you to read his blog. Stevie wants you to believe that the higher oil prices will lead to higher interest rates and a massive recession. Of course oil prices were $100 or more back in the 2011-2014. Now I ask you – did we have soaring interest rates or a renewed recession back then? Of course not.
But wait – copper prices have risen by 60% since last year:
https://fred.stlouisfed.org/series/POILBREUSDM
Calling Judy Shelton and Stephen Moore – time to run very tight monetary policy.
Yea – I’m mocking these wannabe economists in part because the Trump White House used to listen to such stupidity. And now that we have an intelligent President in the White House, these cranks are feeling lonely.
Closing on 46,000 views. Apparently, people are reading what I write.
Such disgraceful self promotion. Sorry dude but no sane person should read your blog posts.
pgl, maybe you’d be interested in my take: https://angrybearblog.com/2021/03/texas-freeze-oil-refining-and-distillate-exports-drop-since-harvey
my original sub-headline was natural gas supplies see 2nd largest drop on record as US burns 15% of inventories in one week; oil prices hit highest since 2019 as US oil exports drop most on record, oil production drop matches record; distillates’ output drops most on record to an 11 year low; oil refining and distillate exports drop most since Hurricane Harvey; refinery utilization at a 40 month low; gasoline output falls by most in 46 weeks to lowest in 38 weeks; gasoline demand falls most in 43 weeks to a 39 week low…
now, that was my coverage for last week…this week’s report surprised me even more, as i commented at AB:
there was new data on the oil metrics out from the EIA yesterday, for the week ending February 29th…i had assumed it would show a recovery in the metrics i covered above, so i didn’t even get around to checking it until last night…i was quite surprised to see what must be a near total collapse in Texas refining, since the national refinery utilization rate fell to 56%, at least 10% lower than it had ever been before…as a result of that, both gasoline supplies and distillate supplies saw their largest drop on record…with a partial recovery of oil production and a jump in imports (as ships that had been holding offshore unloaded), our oil supplies saw the largest jump on record…
it’s notable that no one saw that coming; some headlines on the report indicate a “surprise” build in crude supplies…oil inventories grew by 21,563,000 barrels; before the report, forecasts were for a 1,805,000 withdrawal…nor was there any recent news indicating longer term refinery damage; ie, one recent headline said “oil prices mixed as refineries reopen”
sorry for the self promotion, but this is black swan type stuff….
Granted that US natural gas markets have shown a bit of temporary volatility. Who knows whether the recent rise in oil prices will lead to $100 a barrel. But if anyone thinks temporary swings in energy prices is going to force the FED to raise interest rates – I’d suggest they are smoking something.
i wasn’t forecasting oil’s price; how would i know? i was just reading the EIA’s spreadsheets & documenting what has happened, which now includes this:
Five gasoline tankers that were enroute to the U.S. East Coast diverted to the Port of Houston to help ease a supply crunch after last month’s freeze crippled the region’s refineries. Major refineries along Gulf Coast, the nation’s refining hub, shut gasoline units during the February deep freeze and power failures. Operators have gradually begun resuming production since the weather warmed, but some plants could take weeks to get back to normal. Gasoline imports happen infrequently for the Gulf Coast, which typically produces more than enough fuel for the region and generates significant revenue exporting barrels to foreign customers. Texas retailers were also forced to truck in gasoline from other states last week for the first time since Hurricane Harvey.
Read more at: https://www.bloombergquint.com/business/european-gasoline-diverted-to-texas-to-ease-supply-crunch
You don’t want to read too much into a single week’s data from the EIA. Usually a 4 wma is more reliable. And you definitely don’t want to lean heavily on a week with outages (typically hurricanes, but a freeze two weeks ago). Or the following week, either, when you can see unusual recoveries.
If you want my weekly EIA PSR review or my Friday Rigs and Spreads report, you can sign up at info@prienga.com.
my point was that you do want to read a lot into the EIA data from those two weeks, because it shows that the Texas freeze is going to have a major economic impact….the hit to the oil industry alone is clearly greater than that of any hurricane in our history..
let me add to this by noting that the reference week for the employment surveys was the week of the 8th, ie Feb 8th to Feb 12th…while there was a snowstorm in the plains at the end of that week, the polar front that did all the damage didn’t arrive in Texas until the 14th, so hence the employment report failed to capture the worst of the weather impact….we would have had an entirely different jobs report if the February employment surveys were done a week or two later…
NB: the San Fran Fed disagrees with me: https://www.frbsf.org/economic-research/indicators-data/weather-adjusted-employment-change/
they estimate that February’s weather adjusted employment gain was 482 thousand; 103,000 higher than the BLS reported.
Now this does deserve promoting:
https://lofgren.house.gov/socialreview
Zoe Lofgren rats our the member of the House who shamelessly promoted the Big Lie but collecting their social media attempts to help Trump overturn our democracy.
Well, there’s always a cloud with every silver lining. Today’s good news on job growth might have emboldened DINO Joe Manchin to sabotage the American Rescue Plan with some of his own homegrown ersatz economics. Over the years the Democrats should have learned that you can always count on Manchin to move the goalposts at the last minute.
Maybe Biden can pick off Lisa Murkowski by devoting more money to Alaska. You will note that Biden talked about the latest from BLS and he did not paint a rosy picture.
The American Rescue Plan passed the Senate 50-49!
Manchin is being called out for being a stupid fiscal hawk by the Republican governor of his own state – Jim Justice. Justice is also doing a good job of getting his citizens to do masks and social distancing as well as taking the vaccine. Maybe Justice should run for Senate and toss out the “career politician” Manchin.
meanwhile, my thought on the employment situation report was that it was almost all leisure and hospitality, and to get that we gave up over 60,000 jobs in both construction and teaching at the same time….moreover the three-tenths of an hour drop in the average workweek (four-tenths of an hour for production and non-supervisory personnel) is the equivalent of losing around 150,000 payroll jobs, so this report is just another disappointment in a long line of them..
Kevin Drum notes that this $1.9 trillion or so includes an expansion of Obamacare which is not getting the Republicans screaming Green Eggs and Ham:
https://jabberwocking.com/the-first-big-expansion-of-obamacare-is-coming-soon/
He also has an interesting take on the debate over how to get to Medicare for All.