The Bureau of Economic Analysis announced today that seasonally adjusted U.S. real GDP grew at a 6.4% annual rate in the first quarter, well above the 3.1% average growth that the U.S. experienced over 1947-2019.
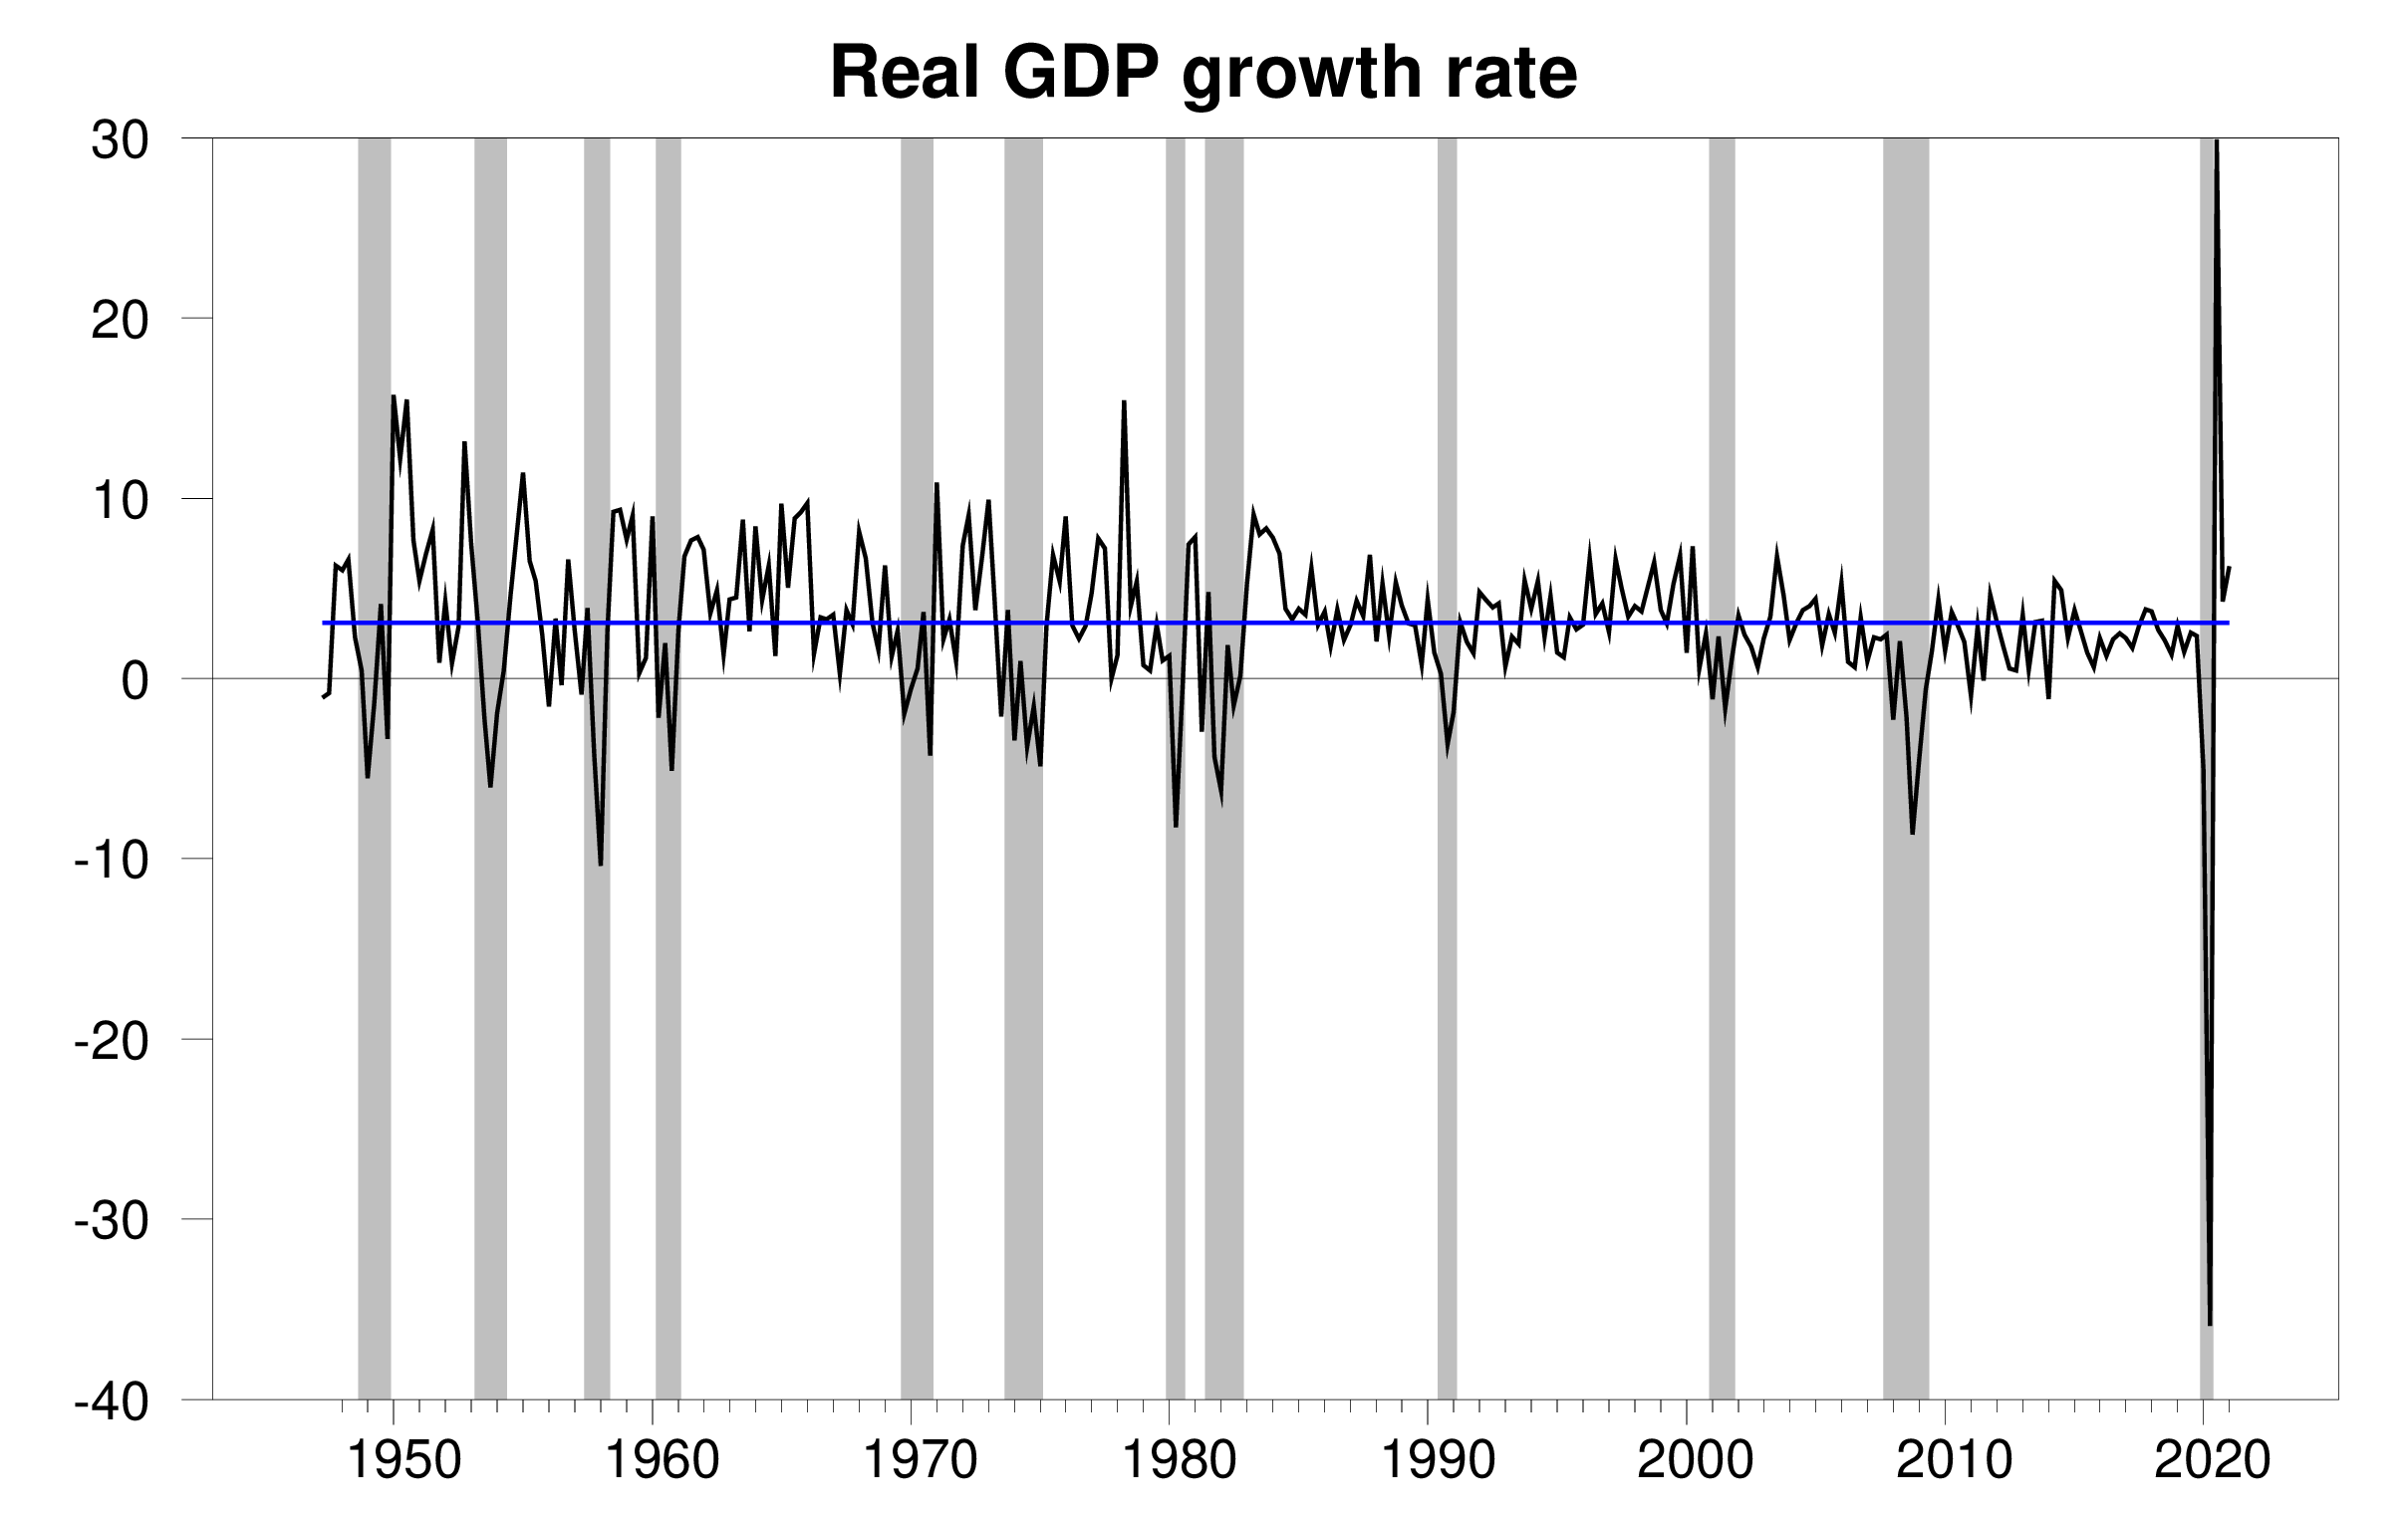
Real GDP growth at an annual rate, 1947:Q2-2021:Q1, with the 1947-2019 historical average (3.1%) in blue. Calculated as 400 times the difference in the natural log of GDP from the previous quarter.
The new data put the Econbrowser recession indicator index at 0.4%, historically a very low value. The number posted today (0.4%) is an assessment of the situation of the economy in the previous quarter (namely 2020:Q4), where we use the additional quarter to allow for data revisions and to gain better precision. This index provides an automatic procedure that we have been implementing for 15 years for assigning dates for the beginning and ending quarters of economic recessions. As we announced on January 28, the COVID recession ended in the second quarter of 2020.
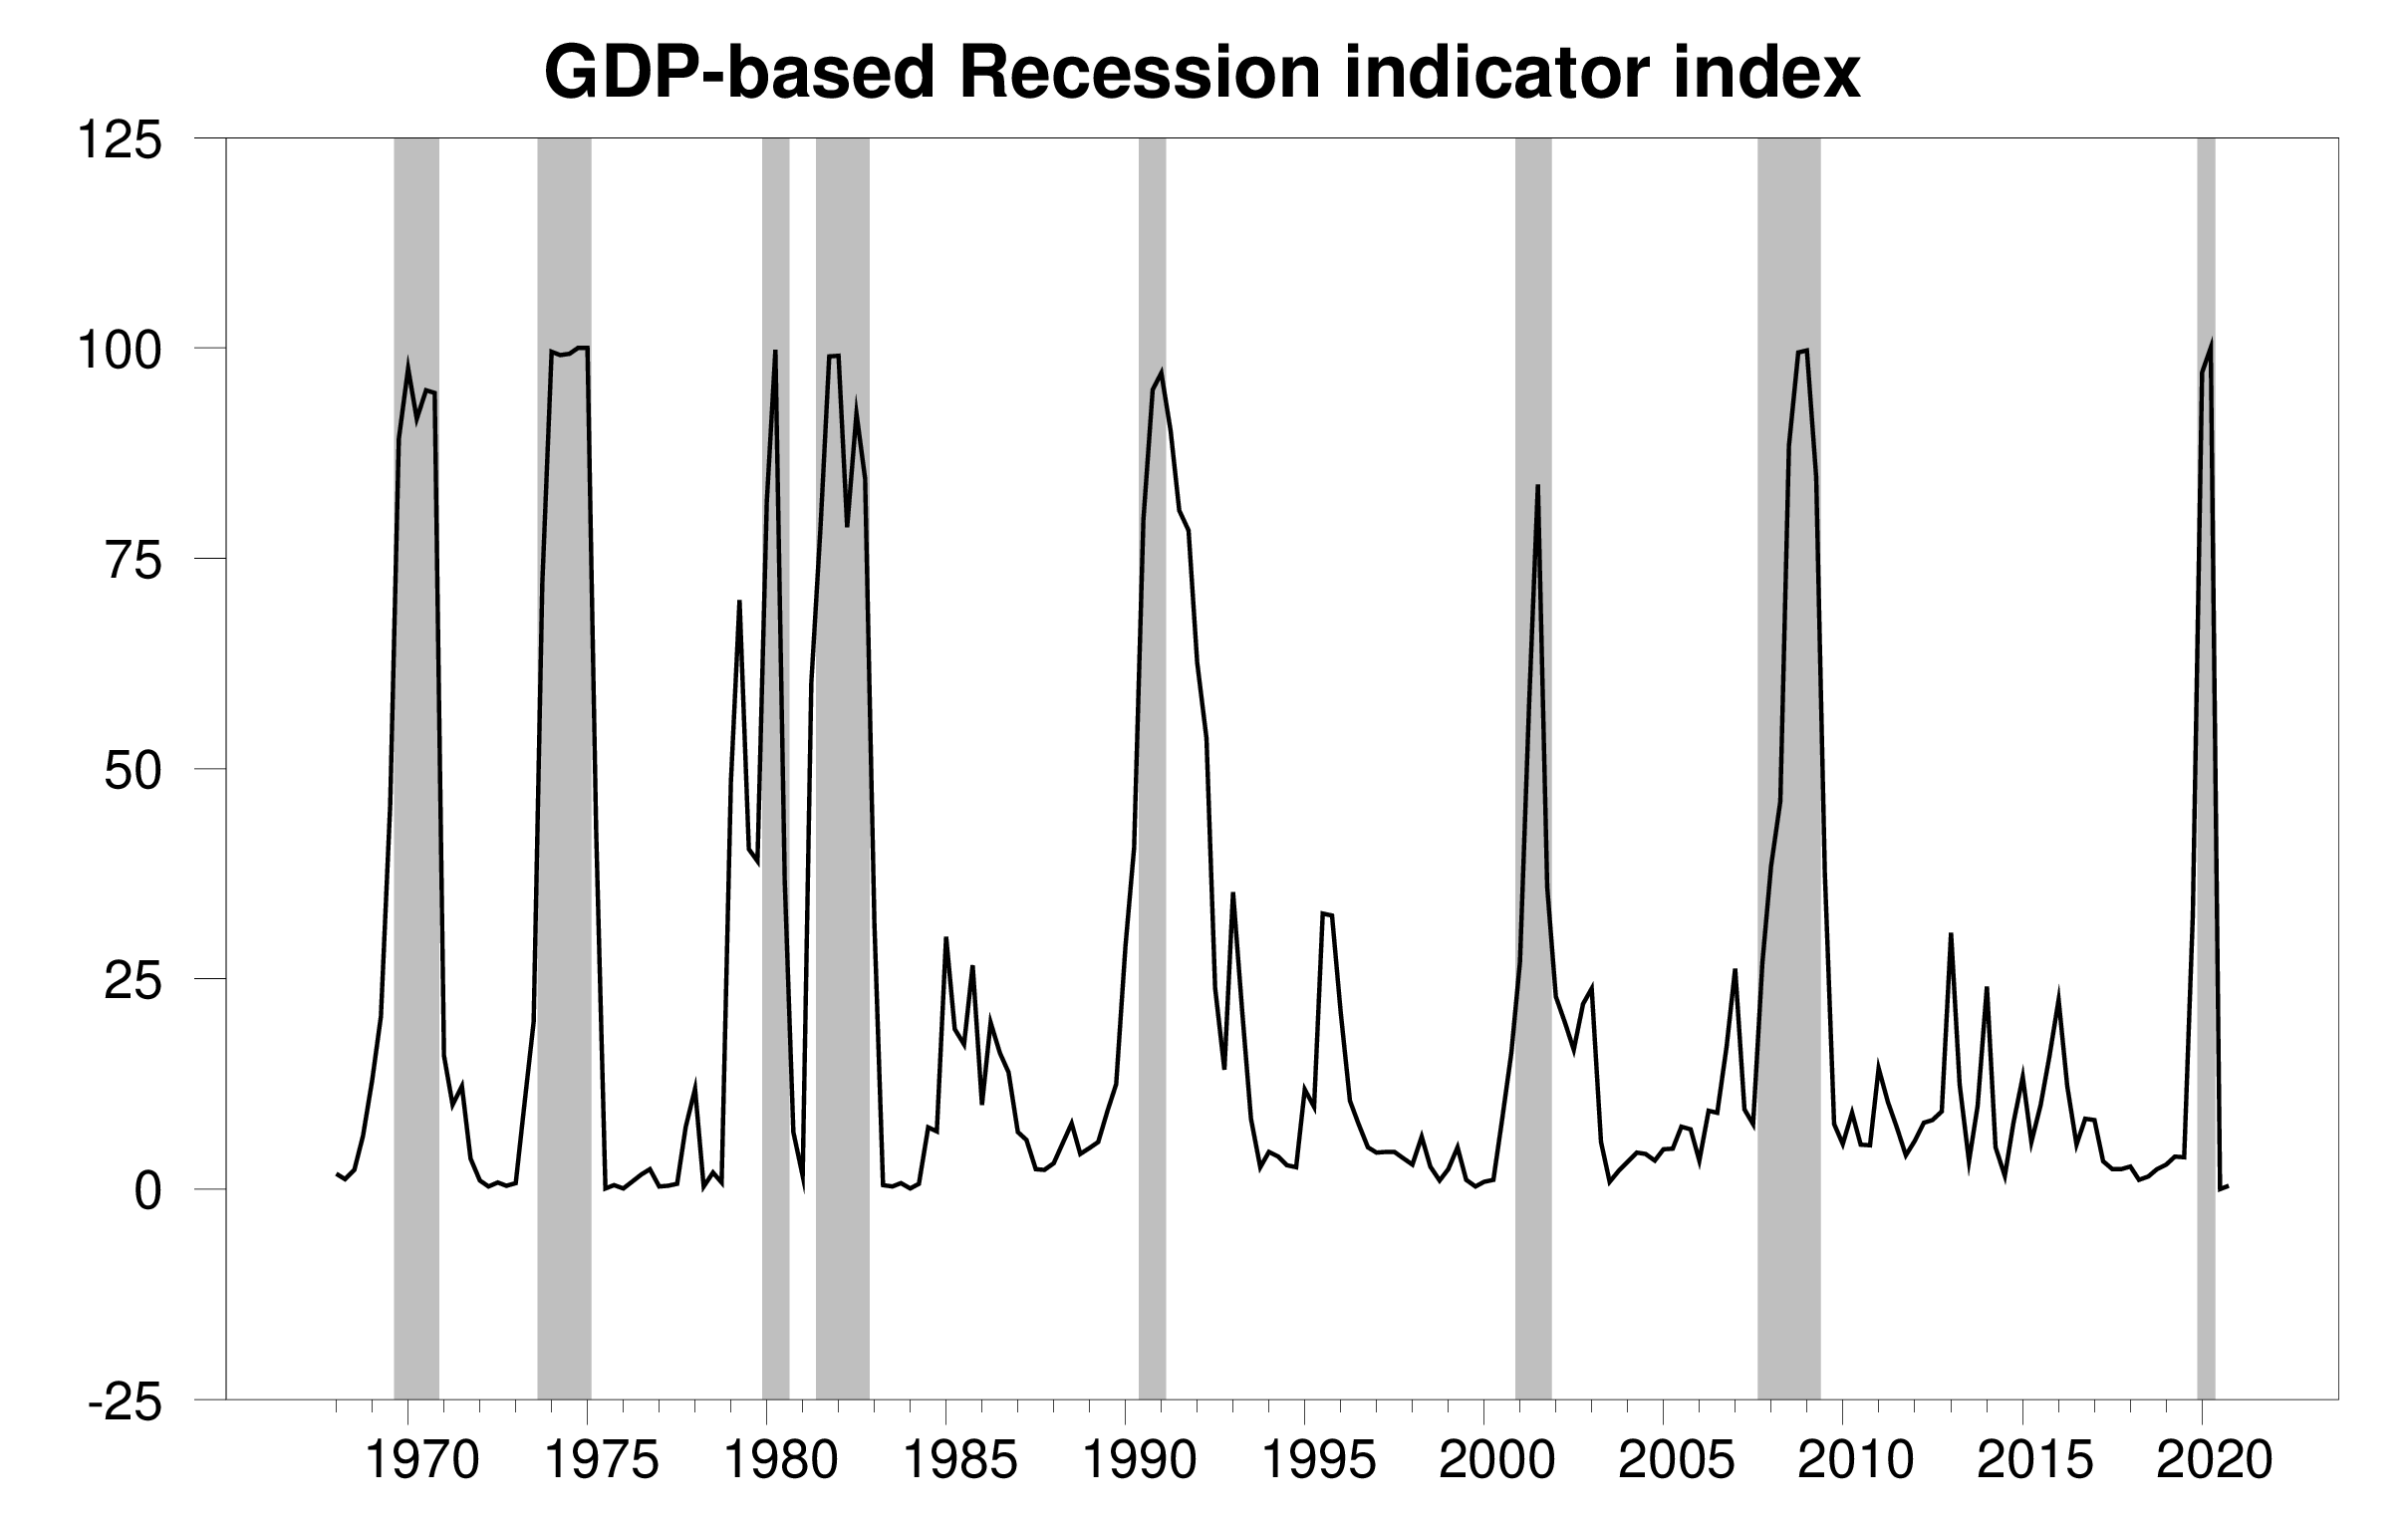
GDP-based recession indicator index. The plotted value for each date is based solely on the GDP numbers that were publicly available as of one quarter after the indicated date, with 2020:Q4 the last date shown on the graph. With the exception of the the end of the 2020 recession, shaded regions represent the NBER’s dates for recessions, which dates were not used in any way in constructing the index. The indicated end to the 2020 recession comes from the algorithm described in Chauvet and Hamilton (2005).
The NBER Business Cycle Dating Committee has yet to issue an official declaration that the recession has ended. I view our mechanical dating procedure as a useful complement to the NBER announcements. Usually (but not always), the algorithm would reach a decision before the NBER issued an official statement. But there are two more important benefits to providing a purely mechanical assessment. First, some might wonder whether this determination of stages of the business cycle is just a matter of subjective judgment. Our statistical approach views recessions as real objective events that we can measure, a development that helps researchers model and characterize business-cycle dynamics. Second, there is always a potential concern that subjective judgments could be influenced by political factors or ideological preconceptions. For example, the NBER determined that the 1990-91 recession ended in March of 1991. But it did not issue this announcement until December of 1992, after the presidential election. It turns out in this case that our algorithm would have been even slower than NBER, waiting to make a call until the 1992:Q4 GDP numbers were released. The reason that our algorithm, like the NBER Business Cycle Dating Committee, was very slow to reach a final conclusion in that episode was that the initial numbers for 1992 GDP were substantially lower than the revised estimates that were subsequently reported. Our algorithm thus provides reassurance that the dates that economists rely on are not influenced by ideological factors.
The Dating Committee may be waiting until the levels of variables like GDP return to their values of 2019:Q4 before the COVID recession began. The 2020:Q1 value is still 0.9% below the value of 2019:Q4.
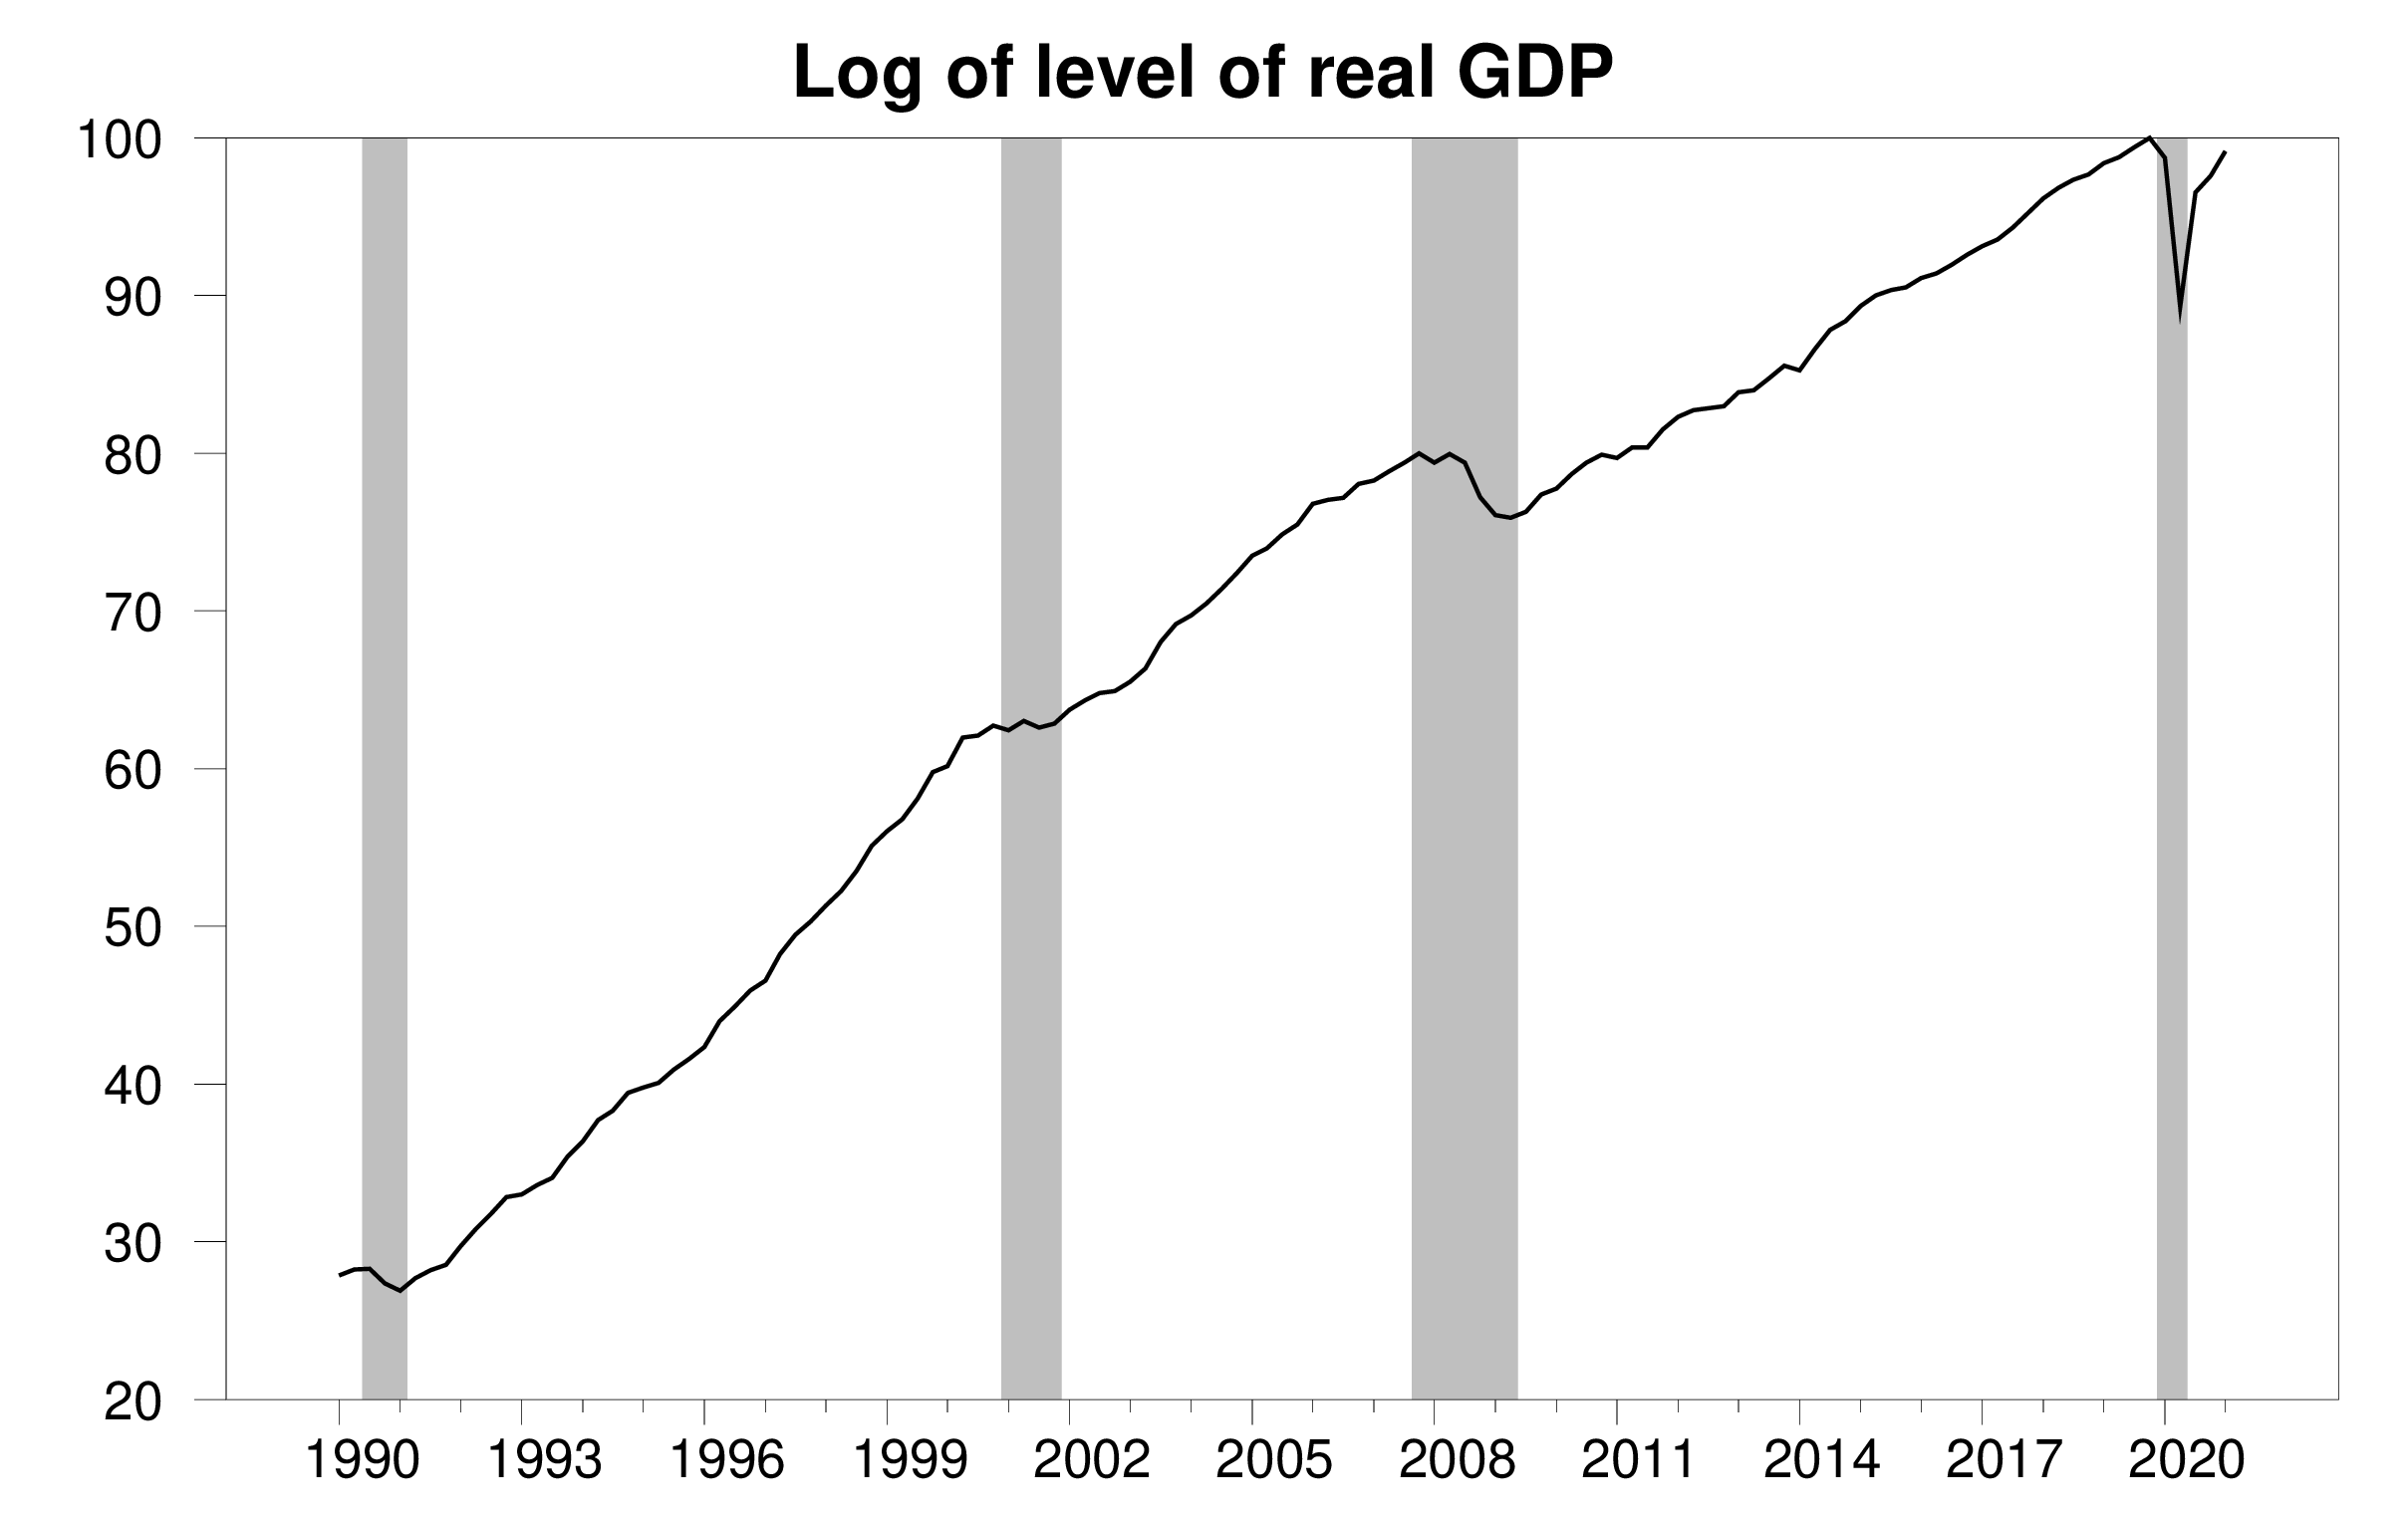
100 times the natural logarithm of the level of real GDP, 1990:Q1 to 2021:Q1, normalized at 2019:Q4 = 100. A movement on the vertical axis of 1 unit corresponds to a 1% change in the level of real GDP. The value for 2020:Q4 of 99.1 indicates that real GDP in 2021:Q1 was 0.9% below the value in 2019:Q4.
In addition we offer at Econbrowser our own subjective assessment of the economic situation. I expect to see strong economic growth continuing from here, and have elevated the Econbrowser emoticon to
 .
.
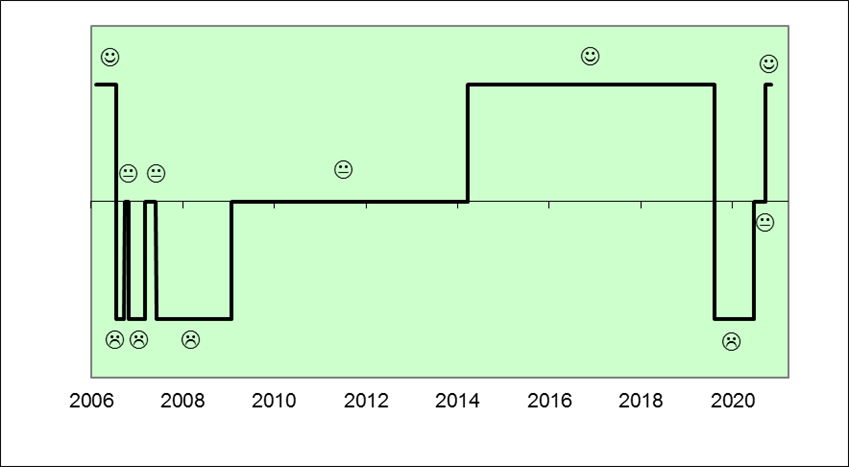
Econbrowser emoticon, September 2006 to April 2021.
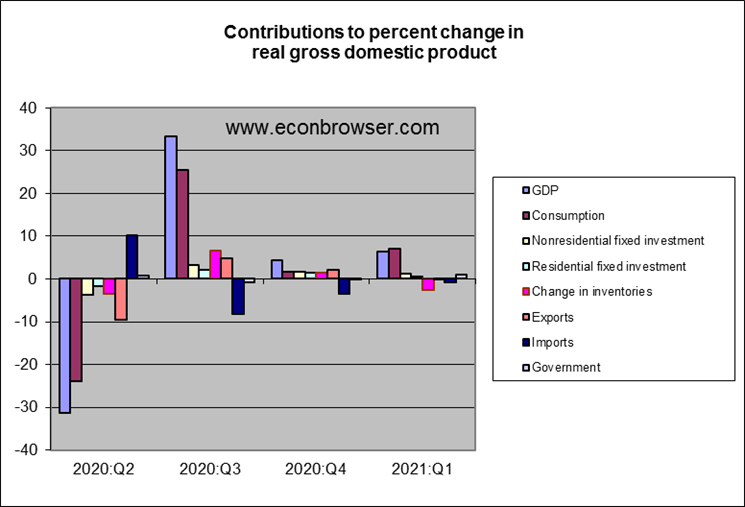
In terms of the breakdown of the Q1 GDP numbers, consumption spending, spurred by more stimulus money, led the way. Direct spending by the federal government also accounted for 0.9 percentage points of the 6.4% annualized GDP growth rate. Private fixed investment made a positive contribution, though this was smaller than the contribution of fixed investment to the 2020:Q3 and Q4 figures.
The Federal Reserve reiterated yesterday its commitment to keep interest rates low. That should provide continuing stimulus to house prices and residential fixed investment in 2021.
Economy is strong is an interesting title. We have seen three straight quarters of strong growth rates with forecasts of more strong growth. But we are still below potential output – not as badly as we were in the summer of 2020 but also still not at full employment.
A nice breakdown of the domestic components of growth but didn’t we see a fall in net exports?
PGL what do you mean by the “but” in “but didn’t we see a fall in net exports”? In real terms, the q/q change in net exports was $-53.5 billion largely driven by an increase in exports of $47.2 billion (exports decreased by $6.3 billion). So imports dropped but that doesn’t (directly) impact GDP.
Apologies for an obvious typo – should read that imports increased by $47.2b
“increase in exports of $47.2 billion (exports decreased by $6.3 billion).”
Imports increased by $47.2 billion. If we bought goods from foreign suppliers in lieu of buying them from domestic suppliers, it does impact GDP.
Maybe but the research isn’t clear on that and some research suggests imports increase GDP… which is why your “if” is a very important hedge .
EConned Not following you. Could you explain (or provide an example) how an increase in imports can increase GDP? In the NIPA GDP calculation increased imports mechanically lower GDP. I think we can agree that increased imports can be associated with higher imports via the marginal propensity to import, but based on your comment it sounds like you have something else in mind. Your comment seemed to suggest that greater imports caused an increase in GDP.
2slugbaits
What you’re referencing regarding GDP calculation is merely an accounting identity. Imports are in consumptions so imports are subtracted to get us to gross DOMESTIC product.
What happens to the dollars that are paid for imports? Aren’t they in turned used to finance investment or consumption in the US?
Here’s another example of a guy named “Howard” who imports coffee beans from Brazil. These beans are a part of consumption in GDP but are also subtracted from GDP in net exports portion of equation to net to zero. Why? The beans are not domestically produced. But then all because this “Howard” guy decided to import some coffee beans, some “Starbucks” has a market cap of $134,810,000,000.00 and there’s a lot of increase in domestic products because “Howard” imported some coffee beans.
I guess it makes a difference if your imports are replacing a domestic product or not. Other than hawaii, i dont think we grow much coffee beans in the usa. Other imports that replace domestic sources would not be so beneficial. Think steel, i guess.
If you are claiming that imports may cause faster growth, then you have a problem. Growth clearly causes imports. Open trade can allow faster growth. Talk to Smith and Ricardo. Maybe something impounded in someone imports can foster growth. It is not clear to me what “imports cause growth would mean.
Otherwise, the accounting detail is pretty hard to ignore. Imports are a drag on growth in the accounting sense and don’t cause growth in a dynamic sense – though imports are clearly associated with growth. Can’t see how your claim about imports increasing growth makes sense.
Macroduck
May 2, 2021 at 3:49 pm
See, e.g. Frankel and Romer whose research
“suggest that trade has a quantitatively large and robust, though only moderately statistically significant, positive effect on income.
https://www.aeaweb.org/articles?id=10.1257/aer.89.3.379
As I clearly stated “the research isn’t clear on that and some research suggests imports increase GDP.”
As it relates to your comment “ the accounting detail is pretty hard to ignore. Imports are a drag on growth” I can only laugh at you confusing an accounting identity with causality.
Funny!!! Did pgl ever complain about the gigantic fall of net exports after Clinton signed China PNTR? Or of the ensuing impact on GDP? Or on the impact on jobs?
I did join in with a discussion led by Dean Baker and Jared Bernstein a few years ago:
https://econospeak.blogspot.com/2016/11/two-generations-of-trade-deficits-wee.html
More from Dean Baker: “It is often said that the economy is too simple for economists to understand. This is clearly the story with the continuing weakness of the job market and the trade deficit…
For some reason economists are reluctant to discuss the trade deficit as being a source of the economy’s weakness.“
https://www.huffpost.com/entry/the-trade-deficit-and-the_b_7539710
Of course, Clinton’s signing China PNTR and the ensuing massive trade deficits (not to mention job losses) couldn’t have been bad for the economy, could they? Of course not, because that would be tantamount to heresy—attacking “free” trade deals (actually managed deals designed to benefit the corporations who were insiders to the deals.
@ pgl
I may be missing something here, but I think Menzie has made very clear in some other posts, as have some pretty great economists, that one result of a strong American economy (at least in the current context) would be an increase in the trade deficit. Were you being facetious and it flew over my head??
I’m not disagreeing with that. Just saying we would have more of an aggregate demand effect if the rise in consumption were sourced more to domestic suppliers.
pgl, the headline says “looks strong”; not “is strong”…
there are good reasons for the choice of that word…
pull out the stimulus supported growth in real personal consumption of goods and the increase in non-defense federal outlays, and your GDP growth is just half a percent.(although admittedly the two big negatives, inventories and imports, would not have been as bad were it not for the jump in PCE goods) ..
I never thought I would see the day when Professor Hamilton would use emoticons. Oh my Gosh….. Oh my gosh……
Just friendly teasing with my weird humor. Great post, as always. This gives added info to the BEA’s GDP, so it is satisfying and satiating to those with curiously active minds (or is it actively curious??) Great stuff from Professor Hamilton. I mean, if Prof Hamilton wasn’t enjoying the San Diego seaside while I’m stuck in middle America where I can faintly hear dueling banjos off in the distance, I might even like the guy…….. er something.
https://www.nytimes.com/2020/03/23/arts/music/eric-weissberg-dies.html
He’s been doing that for almost 15 years. Then again I just got a new smart phone and stupid me cannot figure out how to do emojis on it. Time to call my daughter for help!
“Economy looks strong”
Obviously this is all the result of the Reagan tax cuts.
Got a good laugh out of me on that one Joseph,
: )
My passed away father and me make you our honorary Brother now. : )
Milton Friedman used to talk about long and variable lags but 40 years???!!!
Real GDP +0.4% YoY;
Real domestic demand +3.8% YoY.
Therein lies the rub …
The difference – a drop in net exports. Of course I said that earlier and a couple of people decided to attack for pointing this. Yes we are only doing GDP accounting and not full blown economic modeling.
Could this be why US exports fell? Kevin Drum suggests Eurozone real GDP fell by 0.4% in 2021QI:
https://jabberwocking.com/eurozone-economy-declines-in-first-quarter/
Of course Kevin admits he struggles with Eurozone data so maybe someone who is good at this should double check.
“Kevin Drum suggests Eurozone real GDP fell by 0.4% in 2021QI”
The Eurozone GDP fell actually by 0.6% in Q12021, the main contribution came from Germany with -1.7%.
the composite inflation adjustment used in this report (often referred to as the GDP deflator) was 4.1%, suggesting the average price rise throughout the economy in the quarter was at a 4.1% annual rate….is there any reason that the Fed limits themselves to looking at just the PCE price index portion of that when setting monetary policy?
GDP deflator only accounts for domestic goods/services.
You seem to be suggesting import prices have risen. Maybe. Now is THAT what you think was increasing aggregate demand (see 2slug’s comment)?
Not me. See my reply to you above.
FRED provides this measure of import prices:
https://fred.stlouisfed.org/series/IR
The increase over the last year is a bit over 4% but not exactly hyperinflation.
no, it incorporates the deflators for imports and exports foo…you can see the recent values for all the GDP deflators in table 4 here: https://www.bea.gov/sites/default/files/2021-04/gdp1q21_adv.pdf
in Q1, the deflator for exported goods was +26.3%, the deflator for imported goods was 15.2%, and the the deflator for residential investment was 11.4%…all annual rates, of course..
no… GDP deflator excludes imports. Just like GDP does. St Louis Fed explains here…
https://fredblog.stlouisfed.org/2015/03/the-many-flavors-of-inflation/
“ The GDP deflator considers all goods that are part of GDP, which excludes imports and includes exports (the opposite of CPI and PPI). Finally, the personal consumption expenditures (PCE) price index uses a continuously changing basket of goods that is the basis for the private consumption component of GDP.”
Ah yes – you are getting the definitions correct. And your big point is????
fair enough…when i have time, i’ll check the NIPA handbook on that…
https://www.bea.gov/resources/methodologies/nipa-handbook
let me say out front that it would not surprise me to find that FRED has invented another economic metric that has little to do with reality…years ago they created that so called “Real Retail Sales” graph by deflating retail sales with the CPI and it has become common, if incorrect, practice among economists to do the same since..
it just dawned on me that i had questioned the deflator on that issue before..what follows is an exchange i had with Lisa Mataloni, the GDP maven at the BEA, back in 2018 (links may no longer work)
me: i have a problem with the GDP deflator revisions
i am looking at “Table 4. Price Indexes for Gross Domestic Product and Related Measures: Percent Change From Preceding Period” in the 2nd and 3rd estimate for the 1st quarter:
https://www.bea.gov/newsreleases/national/gdp/2018/pdf/gdp1q18_2nd.pdf
https://www.bea.gov/newsreleases/national/gdp/2018/pdf/gdp1q18_3rd.pdf
the overall GDP deflator was revised up from 1.9% to 2.2%, while the PCE deflator, which should be most heavily weighted, was revised down from 2.6% to 2.5%..
the gross investment deflator was also revised down from 2.9% to 2.8%, the exports deflator was unchanged, the imports deflator was revised down from 9.0% to 7.2%, while the government deflator was revised from 3.2% to 3.4%
can you explain why the GDP deflator was revised higher when most of its components were revised lower? or am i thinking about this incorrectly?
she responded: Imports are a subtraction in the calculation of GDP, but they are embedded within the PCE estimate. The upward revision to GDP prices (which exclude imports) reflects the downward revision to import prices, notably petroleum, based on updated International Transactions data. A revision to import prices in one direction has the opposite impact for the revision to GDP prices.
Sincerely, Lisa Mataloni
i replied with an afterthought:
thanks. i had an inkling that the downward revision to import prices would boost the GDP deflator, but couldn’t see it having an impact as large as to increase it from 1.9% to 2.2%, especially in light of other deflators going in the opposite direction….
odd that almost the exact opposite happened with the 3rd estimate of Q1 2017, when the GDP deflator was revised from 2.2% to 1.9%, apparently on a revision from 5.1% to 6.4% in the import price deflator..
so it could be i misinterpreted that exchange…when i have time, i’ll go back to the actual data and unwind the arithmetic on the component deflators and see what they’re actualy doing…
Good but not services? Note something – those indices show a lot of volatility.
rjs…
She is saying what I was saying…
Her:
“Imports are a subtraction in the calculation of GDP, but they are embedded within the PCE estimate.”
Me:
“ GDP deflator only accounts for domestic goods/services.”
So, to answer your initial question, FOMC looks at PCE because it includes imports whereas GDP deflator does not include imports.
pgl
May 1, 2021 at 10:42 am
The definition specifics was to support my initial reply/“big point” which was in response to rjs questioning FOMC logic. You should be able to easily follow the flow of the discussion within this post.
i’m still up in the air about that, Econned, & here’s why; in that email exchange above, there were two large revisions to imported oil prices, in Q1 2017, and in Q1 2018, that resulted in large revisions to the GDP deflator in the opposite direction…if import prices aren’t included in the GDP deflator, that couldn’t have happened…
moreover, import prices wouldn’t be the only thing the FOMC would missing in looking at PCE prices exclusively….there’s also the deflators for structures, equipment, intellectual property, inventory, and the various government contributions to GDP that are incorporated in the GDP deflator that the Fed would be missing…
for instance, lumber prices are up ~300%. the PCE price index barely touches that..
rjs…
There is no “if”. The GDP deflator is based off of GDP estimates. GDP excludes imports. It’s gross DOMESTIC product. Imports are not domestic. Since you didn’t feel the link from the 8th district was sufficient, here’s the BEA in their own words:
“ The gross domestic product implicit price deflator, or GDP deflator, measures changes in the prices of goods and services produced in the United States, including those exported to other countries. Prices of imports are excluded.” source: https://www.bea.gov/data/prices-inflation/gdp-price-deflator
JohnH
April 30, 2021 at 7:34 pm
This is JohnH’s follow-up to one of his patented dishonest attack on yours truly. Of course he is all upset about something that occurred in 2000 so he quotes a Dean Baker piece written in 2016? Yes Dean Baker was talking about the Great Recession which began in December 2007 not 2000.
Yes net exports matter – I’m the person who brought this up. And yea we did have a 2001 recession but that was led by a fall in business investment. The Great Recession? A collapse in residential investment as well as a financial crisis. Now if JohnH thinks this was caused by imports of apparel from China – maybe he can write a paper for the American Economic Review explaining all of this.
it looks like this morning’s March construction spending report will result in a big downward revision to this GDP report…
with today’s report, the annualized February construction spending estimate was revised 0.5% lower, from $1,516.9 billion to $1,509.9 billion, while the annual rate of construction spending for January was revised 0.7% lower, from $1,529.0 billion to $1,518.7 billion…
in reporting 1st quarter GDP, the BEA’s key source data and assumptions (xls) indicated that they had estimated March residential construction would be $7.6 billion more (at an annual rate) than that of the previously reported February figure, that March nonresidential construction would be valued $1.2 billion less than that of the reported February figure, and that March public construction would increase by $2.9 billion from previously reported February levels
totaling those figures, this 1st quarter GDP report showed March construction spending at an annual rate $9.3 billion higher than previously reported February levels…since today’s report shows that March construction spending was up at an $3.2 billion annual rate from February figures that were revised $7.0 billion lower, that means the total annualized construction figure used for March in the GDP report was $13.1 billion too high…averaging that March overstatement with the the overstatements in the annual rates of construction spending used for January and February in the GDP report, i figure that this report shows that total construction spending was overestimated by $10.1 million (at an annual rate) in the 1st quarter GDP report, implying a downward revision to the related GDP components at a rate that would result in a subtraction of about 0.24 percentage points from first quarter GDP when the 2nd estimate is released at the end of May…
note that since my estimate is based on the change in nominal spending, an imbalance of inflation adjustments among the revised components might also have a material impact on the final revision..moreover, since i just did the math on this on the fly, it’s also possible i’ve made an arithmetic error in the figures above..