| Date | Status |
|---|---|
|
Sep 13, 2006 | 
|
| Feb 21, 2007 | 
|
| Apr 25, 2007 | 
|
| Jun 27, 2007 |
|
| Oct 5, 2007 |
|
| Jan 4, 2008 |
|
| Aug 30, 2009 | |
If you’ve only been following Econbrowser since 2008, you may have thought that the crabby countenance in the upper-right corner of our main page was a permanent fixture, conveying our general grumpiness about the state of the economy or perhaps life in general. Despite having been stuck in the pessimistic mode for quite some time now, the emoticon was in fact always intended to be a dynamic feature, adjusted from time to time to provide readers with our overall impression of incoming data. The table on the left provides links to each occasion that our Little Econ Watcher’s countenance has changed in the past.
Last week’s data persuaded me to move the Econbrowser Emoticon back into neutral, signifying that I now judge overall output to be growing slowly rather than declining. Here are details on the evidence that prompted this change in assessment, and what it signifies.
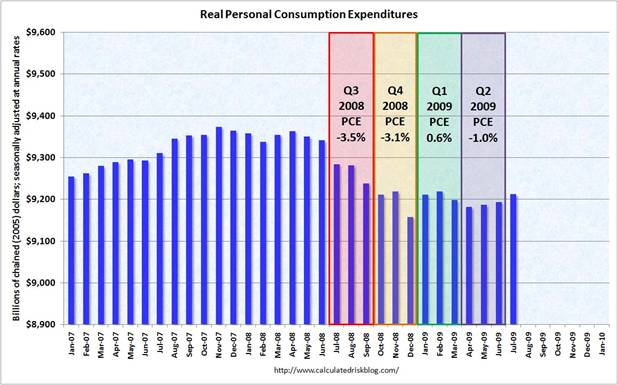
What’s changed? For starters, we saw a surge in automobile sales and production in July, and preliminary indications are that August will be even stronger. Granted, there are real concerns that this was a temporary kick from the cash for clunkers program, meaning that September sales could fall sharply. But remember that the revised data reported by BEA on Thursday showed U.S. real GDP growth of -1.0% at an annual rate for the second quarter, to which motor vehicles and parts contributed -0.13%. Even if auto sales in Q3 were at the same low level they had been in Q2, a 0% rather than -0.13% contribution would mean a higher GDP growth rate for Q3 than Q2, other things equal. And even with a very bad September, Q3 auto sales should handily exceed Q2.
An even stronger case holds for housing, which contributed -0.66% to that -1.0% 2009:Q2 GDP growth. The Census Bureau reported on Wednesday that seasonally adjusted new home sales in July were 9.6% higher than in June. Granted, they remain at historically very low levels. But again, even if these are only modest improvements over the dismal Q2 numbers, that -0.66% becomes a positive number for Q3. And although there’s lots of potential measurement error in the new home sales data, a 9.6% gain within a month isn’t a modest number.
Many analysts were troubled by the BEA report on Friday that personal income was flat in July, and I agree that this is not what you’d expect in a surging economy. But it’s worth noting that real personal consumption expenditures were up 0.2% in July, consistent with the conclusion that we’re unlikely to see a further decline in overall GDP this quarter.
 |
There are other indicators that encourage me as well. The Census Bureau released on Wednesday a very favorable report on new orders for durable and capital goods. Semiconductor chip maker Intel (INTC) announced Friday that it expects much higher revenue for the third quarter than it saw in the first half, suggesting sales of computers and a variety of electronic products are picking up. The Aruoba-Diebold-Scotti Business Conditions Index, although still negative, has climbed back up considerably from its earlier lows. All of this leads me to form the opinion that U.S. real GDP has stopped falling and is starting to grow again.
 |
Let me now clarify what this change in our little friend’s countenance does not signify. First, it is not an Econbrowser Declaration that the recession is over– that will have to wait until our GDP-based recession indicator index falls below 33%.
Nor is this a less formal “all-clear” signal. Far from it. I still don’t see the evidence that employment has started to pick back up, and as long as the number of people with jobs is falling, there is plenty of potential for destabilizing feedback. Lower employment can aggravate mortgage defaults and put further stress on key financial institutions. As long as employment continues to fall, things could rapidly deteriorate.
But the situation definitely looks better than it did.
So, the outlook is as positive as it was in October 2007? hmmmm… 😉
Just FYI:
Edmunds: Cash for Clunkers Sales on the Rapid Decline
…But the car-shopping Web site said sales are tumbling as the month comes to an end, with senior analyst Jessica Caldwell saying that “does not bode well for September.” In addition, inventories are near historic lows as the annual sales rate for cars fell slightly below 10 million the first half of the year, prompting widespread production cuts and stoppages.
Sales bounced up in July as the last week of the month was boosted by “Cash for Clunkers.” Such sales ended this past weekend, and Caldwell put the current annual sales rate at around 8 million from 15 million earlier this month and 19 million when “Cash for Clunkers” began. That sales spurt prompted Congress to triple the program’s size.
http://money.cnn.com/news/newsfeeds/articles/djf500/200908271428DOWJONESDJONLINE000666_FORTUNE5.htm
Home sales are being supported by an unusually high percentage of first-time buyers buyers rushing to fins a home before the $8,000 tax credit expires and investors buying in cash to rent out and provide cash-flow. They are competing with each other right now. Caclulated Risk as referred to it as a frenzy in certain markets. What happens this fall when both groups begin to be sated?
Jim,
I’m not so sure about the “neutral” emoticon, which I’m afraid has escaped attention until now due to the little guy’s rare appearances. Not the neutral rating, mind you, but the color – it’s way too reminiscent of “Mr. Yuk – as a result, you might be communicating a very different message than what you intend!
Great stuff! Prof. Hamilton, you do contemporary macro conditions in a reasoned half-empty, half-full style better than just about anybody else that comes to mind.
A thousand thanks!
The ISM indices next week will show to be close to 50, meaning that contraction has ended.
Ironman: OK, I’m open to suggestions. How about a contest among Econbrowser readers to submit the gif we should use for the neutral face? (Must be same size as others, which I think is 16 x 16 pixels).
Things seemed very indecisive and haphazard in 2007, with the emocons shifting quickly, despite the general direction of the economy.
“Semiconductor chip maker Intel (INTC) announced Friday that it expects much higher revenue for the third quarter than it saw in the first half, suggesting sales of computers and a variety of electronic products are picking up.”
The question is “where”; “where” the sales are picking up? The same article clarifies a bit:
“analyst Craig Berger said in a note that “robust emerging market unit demand and all-time low PC supply chain inventories are combining to drive meaningful near-term strength for chip firms, and PC chip firms in particular.” (emphases added)
So, sales are up abroad, not in the US.
Another analyst adds: “much of [the season] build [forecast] is based on ‘demand pull through’ and not ‘supply/inventory replenishment.”
Well, some people still have some money and plan to replace their laptops this holiday season. Does Intel make anything in the US? If not, then it’s Asia-made stuff for Asia and consumer inventory replacement. Is this even stabilization in the US? How is this good for the 90% of US labor force??…???..
Railfax shipping report still shows a stop in the drop, and slight improvement to the upside.
http://railfax.transmatch.com/
Biofuel:
An Intel microprocessor is about the only hardware thing in a computer made in the US.
But they are in the process of building some sort of plant in China, tho they say it is not a leading edge microprocessor plant.
Professor Hamilton,
CR has put up link to this post, and several commenters (including myself) immediately noticed the Oct 5th 2007 change from negative to neutral — which just happened to coincide with the top of the S&P 500. [Bob noted it above, too.]
How do you feel about being a contrarian indicator? 🙂
Jim, I would tend to favor red for a slowing economy, yellow for neutral, and green for go.
i am given to pause and i doubt my concerns as
professor hamilton and many other world class economists say the sun begins to shine
but im sorry i dont buy it
why? because few if any of the fundamental causes of this breakdown have been corrected.
we got to this disaster because we exported jobs and production to lower cost nations,
then used the home atm and other methods of borrowed money to buy their goods,
we tried to overcome stagnant and falling wages with borrowing,
we cut taxes and launched two wars and a prescription drug part d all unfunded… and doubled national debt in 8 years,
while the asian tigers and ME oil giants were awash with capital looking for a place to invest at a high safe return,
our financial giants on wall street and k street deregulated banking and pushed (yes thats right like a drug dealer)
pushed innovative debt instruments and especially derivatives till they came out of our ears,
we wallowed in mis-allocated capital (that was borrowed) and bid the prices of homes, commodities and equities etc to the sky,
then the collapse of counterparty trust in a willey-coyote moment brought the system crashing down,
that is the road runner-cliff- notes history of how the shit hit the fan
—-
someone please tell me, what fundamentals have changed…. (fundamentals)
as the rope, that caught our fall into the abyss, frays
Can’t argue with most of your indicators, but, as a hedge fund manager focused on the tech sector, I can tell you with some confidence that INTC’s improved guidance for the Sep qtr is completely worthless as an indicator of demand for personal computers and other electronic gear. INTC’s improvement, which began in the spring, is an artifact of its much-lower-than-end-demand results in the prior two qtrs, where substantial excess processor inventory was sucked from the channel. It’s better-than-end-demand results in the current qtr (and previous qtr) reflect nothing more than the reversal of that process. Motherboard customers fret about INTC’s lengthening lead times & order a bit more product to buffer against this result, and this gets magnified across the food chain. It has happened in countless cycles, in good economies and bad, and says absolutely nothing about the direction or amplitude of swings in end demand for PC’s.
This blog is at input content neutral? I must have missed something, being a newcomer and all. Maybe it’s the best of times and the worst of times to be an economist.
Why does the “neutral” symbol have the same coloring and general style (though with a slightly different mouth shape) as the “Mr. Yuck” symbol the government tried in the 1970s as a warning to kids against poison?
tj & the bear: Our emoticon is not intended as investment advice, though if the shift to pessimism on Jan 4, 2008 prompted you to sell stocks, I’ll not refuse your gratitude.
Regular Econbrowser readers will know that I was mostly out of stocks for most of the last decade, but decided to go back in between October 2008 and April 2009 for reasons I detailed in these posts of Nov 13, 2008 and March 1, 2009. Again, if you followed my advice and lead on either or both of those occasions, I’ll not refuse your gratitude.
You’ll also notice, if you study either of the above posts and the current market, that the same calculations that would have led you to expect a higher than average return from buying stocks in November or April would also lead you to expect a lower than average return if you were to buy stocks at the prices of Aug 28, 2009, given current fundamentals.
Edd: As discussed above, the neutral emoticon is taken as a read that in my opinion, real GDP is currently growing, although perhaps slowly, rather than falling– no more, no less.
So, we had a measure based on lagging GDP figures, which was consistent, but beyond the trough, misleading.
So, now, we’re beginning to mix in coincident indicators, but are compromising data-to-conclusion integrity as a result.
Oh, the slippery slope in the search of timeliness and relevance.
You know where this leads. In no time at all, you’ll be calling the National Threat Level (which is, of course, ‘elevated’).
JDH: You were in t-bills for most of the decade? It is somewhat ironic that one of America’s most knowledgeable economists with respect to petroleum missed out completely on one of the biggest secular energy bull markets in recent decades.
On the other hand, the return on your time spent writing papers was probably much higher. Multi-tasking is hard.
How do you factor in the plight of state/county/city/municipal governments?
They are resisting change, hoping the V-shaped recovery will save them from either raising taxes or cutting services.
In the end, they will need to do both. How may that affect the economy?
True, Q3 will post growth even in the USA.
I look for a sharper consumption decline after Labor Day, with car sales falling again. Housing is getting an artificial boost in some markets. Neutral seems about right in the very short term, but what is unfortunate is that a weak economy with a positive GDP growth number will be celebrated as the end of our troubles.
Many are saying the S & P 500 has room to grow, and since the stock market is often mistaken for the real economy, another growth spurt there will build more bubbly momentum.
I believe this month-to-month stuff is just noise at this point
The flat income data last month is a big improvement over recent months when nominal personal income was falling.
The year over year change in nominal personal income growth is negative for the first time in the post WW II era.
The upgrade from sad face to straight face strikes me as a solid contrarian indicator.
As we move past the eye, I look for the storm to feel quite fierce for the next 6 months to a year.
Increased spending with flat income suggests to me more financial stress. Unless peoples debt burden fell significantly, I think more risk has entered the system.
and the Baltic Dry Index? Its been going down lately 🙁 China shares as well . . .
One should apply Occam’s razor theorem to the current economic environment. Step outside and walk across the US…actually take the time to visit areas devastated by the recent economic fallout, talk to people and look around you.
Folks, there is no V-shaped recovery here. The recent move up in macro indicators is only signaling the top of the dead cat bounce.
I hope you are right.
I think this is a quantum shift in wages. Folks just aren’t going to earn as much as they once did, which sort of indicates that even though GDP may be recovering, consumer expenditures won’t follow.
Having your emoticon be solely based on GDP prospects makes it pretty limited. Maybe instead base it on your recession indicator–recession (going down), stagnant, recovery (going up but still below previous peak), expansion.
To all those heaping criticism on this great effort, I say
“Dammit man, Jim is just a Doctor, not a magician!”
Great stuff Jim, keep it up! Thank you.
Can You post job loss RATE graphs again? As I understand, with August 216 000 after July 276 000 (decrease by 22%) USA is coming out of recession fast. Small hickup in recovery in August, but it will smooth out in Sept/Oct.