Monthly GDP figures were released by IHS-Markit yesterday, showing a rebound in March. In the context of key macro indicators followed by the NBER Business Cycle Dating Committee:
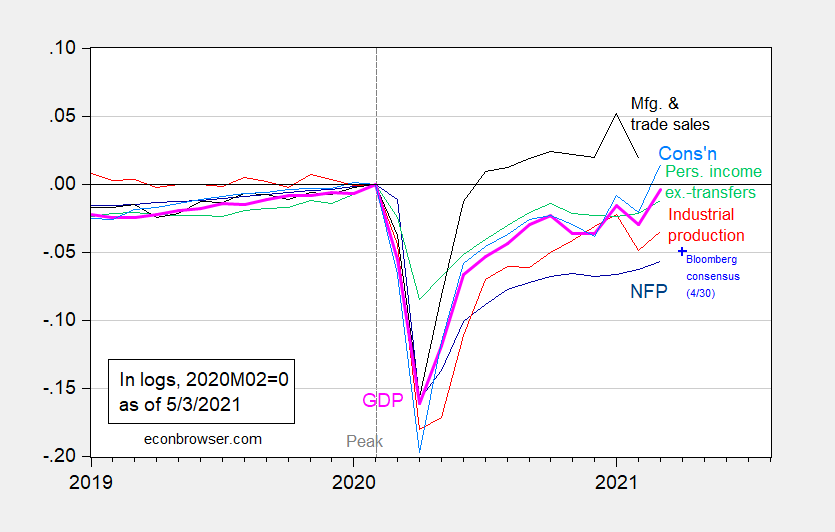
Figure 1: Nonfarm payroll employment from March release (dark blue), Bloomberg consensus as of 4/30 for April nonfarm payroll employment (light blue +), industrial production (red), personal income excluding transfers in Ch.2012$ (green), manufacturing and trade sales in Ch.2012$ (black), consumption in Ch.2012$ (light blue), and monthly GDP in Ch.2012$ (pink), all log normalized to 2020M02=0. Source: BLS, Federal Reserve, BEA, via FRED, IHS Markit (nee Macroeconomic Advisers) (5/32021 release), NBER, and author’s calculations.
The monthly GDP is only slightly below peak levels recorded in 2020M02. For a comparison against the official (advance) figure (discussed by Jim last week) and the current IHS-Markit (formerly Macroeconomic Advisers) nowcast, see the below figure.
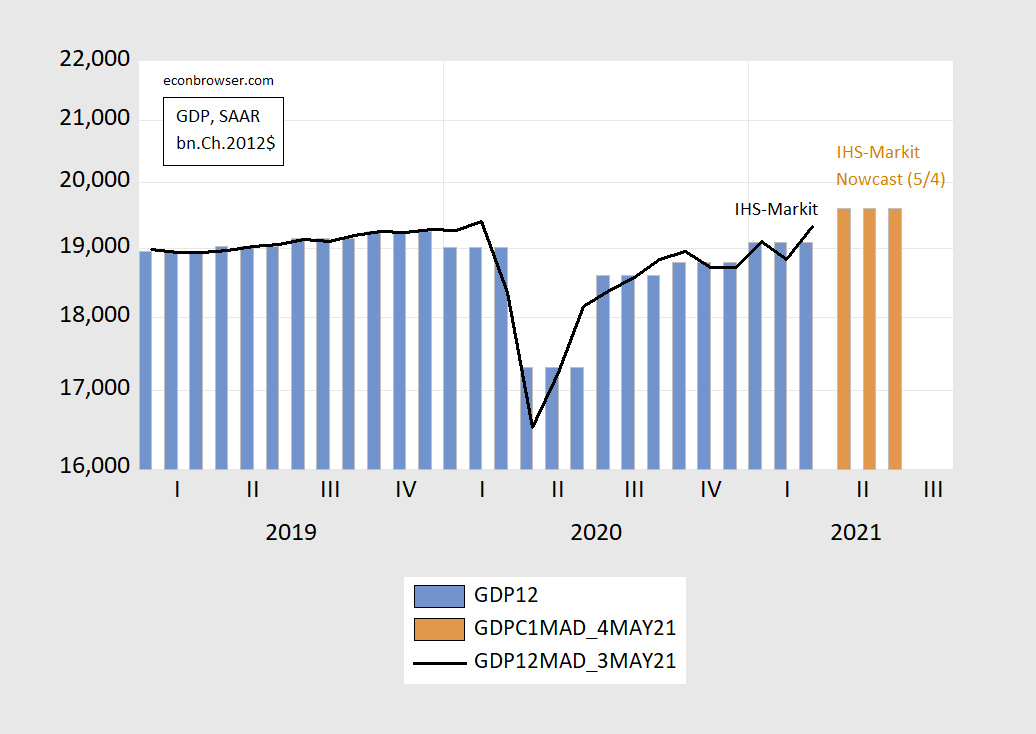
Figure 2: GDP from advance release (blue bar), IHS-Markit monthly GDP (black line), and IHS-Markit nowcast of 5/4 (brown bar). Source: BEA 2021Q1 advance release, IHS-Markit.
The Biden Boom! May the 4th Be With You!
Speaking of nowcasting, for those of you who are proficient in “R” there’s the “nowcasting” package:
https://cran.r-project.org/web/packages/nowcasting/index.html
Here’s the vignette that accompanies the “nowcasting” package. One of the examples reproduces the NY Fed’s nowcasts.
https://journal.r-project.org/archive/2019/RJ-2019-020/RJ-2019-020.pdf
I’m not proficient in “R”, but I still appreciate you posting this. Thanks
The NBER exercise is backward-looking. IHS has the benefit of being recent, so implying more about the near future.
The big unknowns about the medium term remain fiscal policy and Covid, even though vaccination is less of a mystery now than in Q1 and before. The differences in magnitude and content between a Biden infrastructure plan and a Manchin-approved plan are large – many GDP % points apart. The outlook is much improved, but still difficult to forecast.
@ Macroduck
I’m too lazy and it’s too wearisome to track all this horse trading….. stuff. When it gets closer I’ll start reading Politico more closely. Manchin, what a piece of work. I’m trying to get a gauge on this guy, and I’ll admit it’s largely blank for me. He seems like that one guy at the office who can never get the vending machine to work and then you find out a few days later, after helping him get a can of Pepsi out, he just got another promotion. That’s the best I can come up with. And really he’s just too boring for me to want to adjust the microscope to look closer.
We have seen a number of people fretting about rising inflation with their cherry picked data designed to spook all of us. Not only is Kevin Drum not buying this hysteria, his latest post shows us all how it is done (not bad for someone who is not an economist):
https://jabberwocking.com/theres-not-much-evidence-that-inflation-is-on-the-rise/
Kevin has a few smart commenters but he also has his share of weird ones too including a troll who could be one of our Usual Suspects. This troll’s latest:
‘Mitchell Young
May 4, 2021 – 11:45 am at
Look at the time series…5% decreases don’t happen, except in electronic geegaws.’
The only good that ever falls by 5% is electronics??? WTF? I guess Mitchell has never looked at commodity prices. Even Princeton Stevie pooh knows oil prices can quickly fall. And Mitchell’s other rightwing rants are generally worse.
Given that the rest of the world economy is in a deep recession, except for China, there is massive supply available to meet demand from the U.S. If the U.S. were a closed economy, we could be looking at higher inflation but we can import all we need and pay for it with dollars that everyone in the world wants. The dollar is far stronger than it was a decade ago. https://fred.stlouisfed.org/series/DTWEXBGS#0
So no problem with buying from foreigners. Good time to travel to Europe too with few crowds.
“The dollar is far stronger than it was a decade ago. https://fred.stlouisfed.org/series/DTWEXBGS#0
So no problem with buying from foreigners. Good time to travel to Europe too with few crowds.”
I think your chart means the dollar has devalued over the year. But your overall point is a good one even if some will fret that our trade deficit got a bit larger. A strong US economy means more imports while a weak European economy lowers export demand.
@ Menzie
I found this data in relationship to your prior post. I thought it is quite an interesting graph, especially viewed in the context of corporations’ complaints about paying a more equitable tax rate compared to family and individual households:
https://fredblog.stlouisfed.org/2020/08/the-impact-of-recessions-on-net-worth/
in other words, in the old parlance of the “golden age of blogging” h/t to JohnH and h/t to Menzie Chinn [ lowers my imaginary western hat, Festus Haggen style ]
https://www.youtube.com/watch?v=IGlW4kYd1Is <—-100 seconds of old TV show.