Using an incredibly powerful device called “the Google”, I have discovered new prototype data releases regarding the distributional aspects of real personal income. Here are some figures depicting income accruing to select household income percentiles, contributions to income growth therefrom, and Gini coefficients. These figures are from this Working Paper entitled “Measuring Inequality in the National Accounts” (updated 2020).
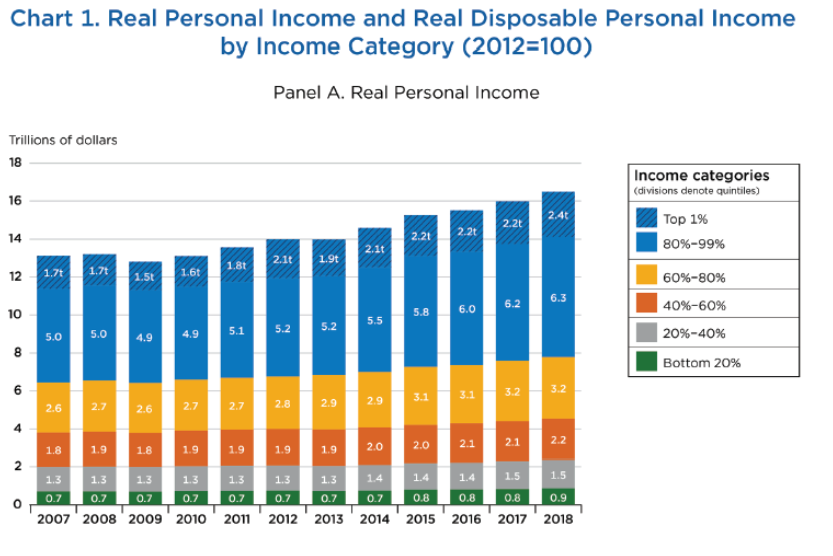
Source: Fixler, Gindelsky, Johnson, “Measuring Inequality in the National Accounts” (BEA, December 2020).
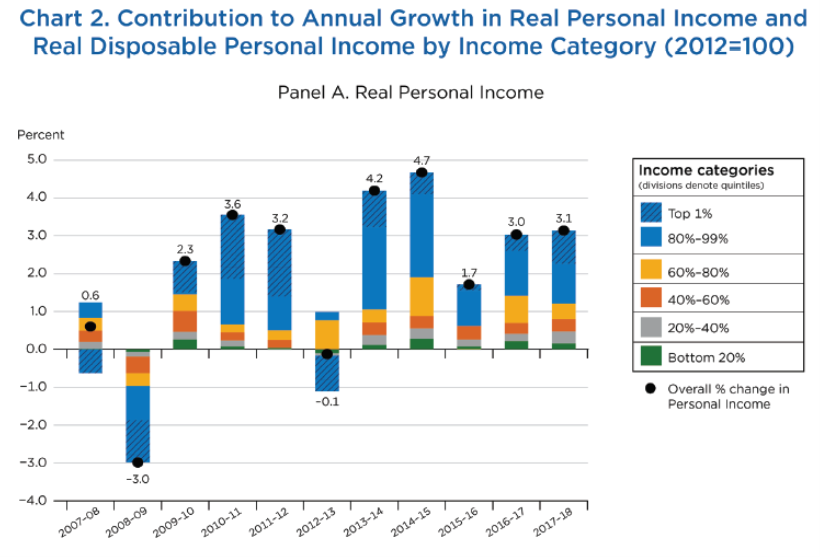
Source: Fixler, Gindelsky, Johnson, “Measuring Inequality in the National Accounts” (BEA, December 2020).
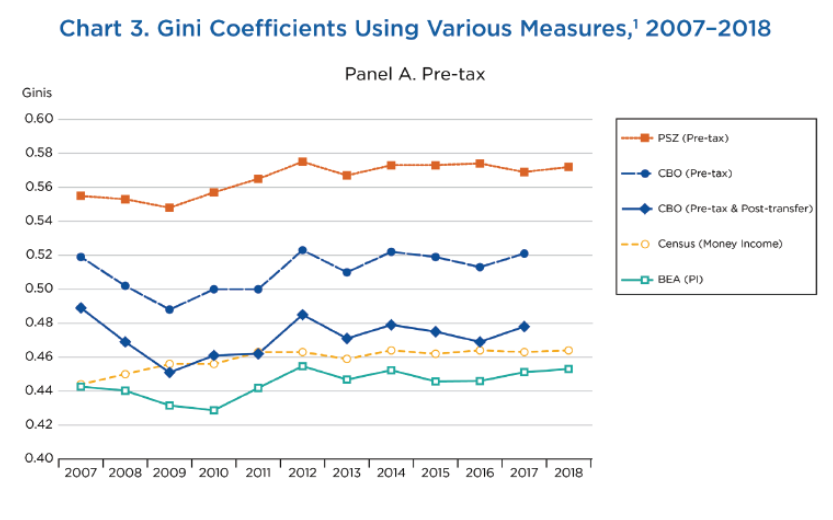
Source: Fixler, Gindelsky, Johnson, “Measuring Inequality in the National Accounts” (BEA, December 2020).
While some similar income statistics are available from the Census, these variables are constructed in a manner related to NIPA, so are useful for business cycle analysis. One could criticize the data as being at a relatively low frequency (annual). However, my guess is that reporting these series at higher frequency (e.g., quarterly) would entail such large amounts of interpolation and estimation that they would not be particularly useful.
The entire webpage on this subject is here. Technical details discussed here.
…….. device called “the Google”.
Durned Damnded Blasted smurt alex dund did confoundered me. I gotz deh kommen since, I don’t duhn-did need ner smurt alex on me.
Some good news for you – Facebook extends Trump ban for another 6 months:
https://www.msn.com/en-us/news/politics/trump-facebook-ban-upheld-as-review-board-extends-exile-for-now/ar-BB1go20I?ocid=uxbndlbing
That is good news for civilized society.
Oh good grief – Trump has started his own blog:
https://www.donaldjtrump.com/desk/desk-htrykas6u6/
Notice no comment section. It seems his blog posts feature rants attacked Romney and Liz Cheney.
Hey we can treat this stupid blog like we treat that worthless blog ala Princeton Steve.
You’re doing exactly the same thing the media has done, and will continue to do (because even the NYT thinks they get more readership, and TV knows they get more ratings). By mentioning the orange creature you are giving much needed oxygen to the fire. Not very intelligent.
What is happening right now is similar to what happened in the Tea Party era. Republicans are now cannibalizing themselves. The wise move is to ignore the orange creature as best can be done, and let the proceedings unfold. In this case it didn’t take long for history to repeat itself:
https://www.politico.com/magazine/story/2016/08/tea-party-pacs-ideas-death-214164
I am basically responding to something YOU wrote. Oh well – my bad.
I don’t see how my razzing Menzie about his dry humor relates to the orange creature. I think I see your point though, it’s not that important, I just, I just feel we’re all better off not discussing the creature. I no longer include it in the human race, and if it wasn’t a mild threat at this point, the orange creature would be dead to me.
something tells me that site will come under frequent hacker attacks. and my guess is most of those attacks will be successful, because security is not something trump will pay for on the site i would imagine.
Some 400 pound dude in China is working on that right now!
@ pgl
Like, does he look similar to Wayne Knight’s “guy you love to hate” character in Jurassic Park??
@ baffling
We don’t always agree, but I actually like that little theory of yours. Will be interesting to watch. The orange abomination could make it secure, but it would be costly. It likes to do things the Mike Lindell way, which means it’s going to have B-team programmers running that site. I think you’re onto something here.
if you attack a government site, you run a greater risk of penalty such as jail time. but that threat is much lower for a civilian site. trump is a civilian now, and not particularly liked by the digital underworld. i can see compromising his site as a trophy of sorts.
Menzie,
Thanks for reinforcing that it is very hard to get reasonable income distribution estimates for the US at frequencies at sub-annual rates.
Interesting that all of the measures show a gini coefficient greater than 0.40, which is often cited as a critical tipping point on the way to the unwinding of a democracy.
That….. and leaders with orange colored skin.
Whether we measure this annually or quarterly, it is clear that the US could do a lot better when it comes to income equality.
The U.S. has the highest Gini coefficient among G7 nations, also higher than Iran, Russia and China (https://www.indexmundi.com/facts/indicators/SI.POV.GINI/rankings). It’s easy to see how income inequality would contribute to the erosion of democracy, though there is other stuff at play.
It would make a great talking point if voter suppression efforts line up with state Gini coefficients, but no. New York, Illinois and California have high numbers, as do all the racist southern states.
Found out some wild things about the funding of Proud Boys today. Really kind of shocked and floored me. Not gonna repeat it, just really bewildered. Honestly not angry, but extremely bewildered by it.
“One could criticize the data as being at a relatively low frequency (annual). However, my guess is that reporting these series at higher frequency (e.g., quarterly) would entail such large amounts of interpolation and estimation that they would not be particularly useful.”
A point Barkley, I, and several others have been making. This is an interesting paper. But alas JohnH will accuse the authors of not caring since they did not come up with quarterly measures.
Interesting data from Gallup: “ While economic damage [ from COVID] was generally worse in low-income countries, the United States stands out among high-income democracies as experiencing both high job losses and a large gap between workers with and without a college degree. Among the 31 O.E.C.D. member countries with data, the United States had the third-largest gap in job loss between college degree holders and nonholders (eight percentage points), behind Chile and Israel.”
https://www.nytimes.com/2021/05/03/upshot/covid-layoffs-worldwide.html
Presumably the extent of the damage and its distribution in 2020 will be reflected in the Household Survey out in September. That still leaves 2021 when voters across the income spectrum will be reflecting on their economic well-being and voting for congressional seats in November.
Also, here is the report from Australia, done only every three years, based on internationally established guidelines;
https://www.abs.gov.au/statistics/economy/national-accounts/australian-national-accounts-distribution-household-income-consumption-and-wealth/latest-release
“The report of the Commission on the Measurement of Economic Performance and Social Progress (September 2009), the “Stiglitz-Sen-Fitoussi Commission”, stressed the importance of a greater focus on the household to provide better measures of people’s well-being. The report emphasised the importance of formulating metrics that presented the distributional aspects of households such as median income and income quintiles consistent with the System of National Accounts.”
That would be Joseph Stiglitz – a great economist. Even you would admit this. But your suggestion that they measure income by quintiles only every 3 years is wrong. The series is not that long but it is done annually. What? What? Australia does not do this monthly? I guess by your stupid metric, Stiglitz does not care about income distribution.
Notice what the authors said about the frequency of reporting:
“In order to create trends in income and the distribution of income, one must choose a reference period, time period, and methods to adjust for changes in the cost of living that occur during the time period. Most studies use annual measures of income. Monthly or quarterly measures of income are typically more volatile, without providing meaningful information on inequality trends. Alternatively, if the goal is to measure permanent income or consumption, which requires more stability, averaging over longer periods (years) may be more appropriate. The time period chosen significantly affects the results.”
Sounds reasonable.
A lot of statistics reported on a monthly basis bounce around a lot. Think CPI.
https://www.bls.gov/charts/consumer-price-index/consumer-price-index-by-category-line-chart.htm
Even so, they are still reported, perhaps so people on blogs can argue about them…
JohnH: You can figure out a price, in principle, for a point in time. Income is a flow. Figuring out the exact timing is hard enough on an annual basis. I think of myself (and my taxes), I do a task in one month, get paid several months down the line…sometimes in the next year.
Most people do their taxes yearly and go grocery shopping weekly not daily. But I guess in JohnH’s world, shopping is an annual event while figuring out his taxes is done daily.
In terms of just gathering data, getting price data is relatively easy. One picks a sample of stores and just goes in to see the publicly posted prices. one can do that easily as frequently as one wants to.
OTOH, income data is not remotely as easily available. People do not have their incomes posted on their front doors so that you can just randomly pick some houses and drive by. You can call them up and ask them, but they may not even know accurately, given that they only know what their taxes are once a year, as has been repeatedly pointed out by many. And even if they know, they may not tell you anything or may lie to you.
It is not easy to collect prices if the grocery store has banned one for being a carnival barker!
@ pgl
Keep my personal history out of this discussion.
Menzie, I think you already “get” this, but I think we can categorize JohnH’s assertions on this topic as very well-intentioned. Being the pragmatic economist you are you might bring up the quote “the road to hell is paved with…….. ” but I think these type comments can be corrected but treated different than CoRev and “our usual suspects”. If one of your students sees this blog argument, maybe they will be inspired when the numbers ever are malleable to be less than annual. Stranger things have happened in this world.
The OEWS survey covers all full-time and part-time wage and salary workers in nonfarm industries. Surveys collect data for the payroll period including the 12th day of May or November. The survey does not cover the self-employed, owners and partners in unincorporated firms, household workers, or unpaid family workers. The May 2020 survey covered 139 million workers. 143 million Americans file taxes.
https://www.bls.gov/oes/oes_emp.htm#scope
It sounds like the bulk of the work is already being done on a semi-annual basis.
Now if we could get the naysayers to start saying, “yes, we can and must “instead of “no, we can’t.”
John,
Quite aside from the people left out, wages and salaries are only a portion of income, with most of the income of those at the top end being capital income, not wages and salaries, quite aside from not knowing what their taxes are.
Sorry, this does not do it. Nice try.
You do know that this a measure of income by sector not by quintile – don’t you? Maybe not but as Barkley noted – “nice try”.
if you are interested in he distribution of income and inequality, then you want a measure that has less volatility in it. somebody self employed may have dramatically varying incomes throughout the year, but may have a steady state income year after year. in this case, trying to measure that volatility (with frequent measurements) would not give you much additional information on the item you are measuring. or it will give you misleading information. think of a PID system controller. if you let the Derivative term dominate, your system will vibrate out of control. the Integrator smooths out the measurement (or error). in measuring income, if you measure too frequently you let the derivative dominate the discussion. you want to average it out over time with an integration. income and inequality are not measurements that change dramatically by the month for most people in the country.
It is interesting that JohnH celebrates a cite that provides annual data back some 60 years (which is a good thing) as he whines he cannot get data on the latest monthly observation. Yes – he is THAT confused!
Just wondering how much of that is related to stock market gains (103% increase in S&P500 1/1/12-1/1/19)? Generally, the lower income groups have less income from capital gains/stock options and are more tied to direct salary/hourly wages.
Is the difference then a measure of income inequality or the differences in the ability to invest and take financial risks?
Gee Bruce – basic accounting would say it is a matter of both. Or does Bruce “no relationship to Robert” Hall not realize that capital gains are part of income?
bruce, if that is the case and you believe inequality is bad, this would be strong evidence that federal policy should redistribute some of those capital gains to those who are unable to take on that increased financial risk. or should capital be treated better than labor?
It’s a difference in income inequality.
The ability to real benefits from saving is part of income inequality, one factor among several, so you’ve imbedded an error in your question. You’ve done something similar with “invest and take financial risk” since the latter is implied in the former.
That said, much of the rise in income disparity is from “earned” income, not unearned. CEOs, lawyers, doctors, brokers and other high earners have made big gains while middle and low end earners incomes have stagnated in real terms for much of the past 20 years or so. Surprised you didn’t know that, given that it is a widely discussed problem in economics and policy.
Reap benefits.
Not quite Pareto’s Principle in term of income distribution – and apparently somewhat better than the global data – but still warrents a sigh.
https://gabriel-zucman.eu/files/SaezZucman2020JEP.pdf
September, 2020
The Rise of Income and Wealth Inequality in America: Evidence from Distributional Macroeconomic Accounts
By Emmanuel Saez and Gabriel Zucman
For the measurement of income and wealth inequality, there is no equivalent to Gross Domestic Product statistics—that is, no government-run standardized, documented, continually updated, and broadly recognized methodology similar to the national accounts which are the basis for GDP. Starting in the mid2010s, we have worked along with our colleagues from the World Inequality Lab to address this shortcoming by developing “distributional national accounts”— statistics that provide consistent estimates of inequality capturing 100 percent of the amount of national income and household wealth recorded in the official national accounts.
This effort is motivated by the large and growing gap between the income recorded in the datasets traditionally used to study inequality—household surveys, income tax returns—and the amount of national income recorded in the national accounts. The fraction of national income that is reported in individual income tax data has declined from 70 percent in the late 1970s to about 60 percent in 2018. The gap is larger in survey data, such as the Current Population Survey, which do not capture top incomes well. This gap makes it hard to address questions such as: What fraction of national income is earned by the bottom 50 percent, the middle 40 percent, and the top 10 percent of the distribution? Who has benefited from economic growth since the 1980s? How does the growth experience of the different groups of the population in the United States compare to that seen in other countries?
Distributing the totality of income and wealth allows us to compute income growth rates for the different social groups consistent with the official macroeconomic growth rates, thus bridging the gap between macroeconomic analysis and the study of inequality. This procedure reduces arbitrariness compared to approaches that focus on narrower notions of economic resources. In addition, because the macroeconomic aggregates are defined and estimated following harmonized, internationally agreed upon concepts and methods, distributional national accounts should maximize the comparability of inequality over time and across countries.
Piketty, Saez, and Zucman (2018) present a prototype of distributional national accounts for the United States. These series are supplemented by a set of publicly available micro-files representative of the US population. In these microfiles, each variable corresponds (and adds up) to a national account aggregate, such as compensation of employees, corporate profits, or income taxes paid; and each observation is a synthetic individual created by combining tax, survey, and other publicly available data sources. These microfiles allow anyone to reproduce all our findings on US inequality—including those described in this article—and to compute other statistics of interest. In the same way as the national accounts are constantly updated, revised, and refined, we regularly update our series and micro-files whenever new data become available and when improved estimation techniques are designed. These revisions are documented in methodological notes that explain the changes made and their effect on previously reported statistics. Following regularly updated guidelines (Alvaredo et al. 2020), similar methods are applied to construct prototype distributional national accounts in a growing number of countries, including France, India, China, and Brazil. The series are made available on the World Inequality Database at http://WID.world, along with all computer code and technical appendices. Because the code and raw data are generally publicly available, alternative methodologies can be tested.
In time, we hope that our prototype distributional national accounts will be taken over by governments and published as part of the official toolkit of government statistics. Inequality statistics are too important to be left to academics, and producing them in a timely fashion requires resources that only government and international agencies possess. A similar evolution happened for the national accounts themselves, which were developed in the first half of the twentieth century by scholars in the United States (such as Simon Kuznets), the United Kingdom (such as James Meade and Richard Stone), France (such as Louis Dugé de Bernonville), and other countries, before being taken over by government agencies.
It may take decades before we get there. Economic statistics, like aggregate output or concentration of income, are not physical facts like mass or temperature. Instead, they are creations that reflect social, historical, and political contexts. How the data sources are assembled, what conceptual framework is used to combine them, what indicators are given prominence: all of these choices reflect objectives that must be made explicit and broadly discussed. Before robust distributional national accounts are published by government agencies, there are still many methodological choices to be debated and agreed on by the academic and statistical community. As part of that process, our prototype can be used to characterize the rise of inequality in the United States, to confront our methods and findings with those of other studies, and to pinpoint the areas where more research is needed….
https://gabriel-zucman.eu/files/SaezZucman2020JEP.pdf
September, 2020
The Rise of Income and Wealth Inequality in America: Evidence from Distributional Macroeconomic Accounts
By Emmanuel Saez and Gabriel Zucman
The Rise of Wealth Inequality
A first step toward the creation of US distributional national accounts was taken in Saez and Zucman (2016), who produced estimates of US wealth inequality allocating 100 percent of the household wealth recorded in the Financial Accounts, the official US macroeconomic balance sheet. Household wealth includes all the nonfinancial assets (such as real estate) and financial assets (such as equities, bonds, and pension wealth, whether held in individual retirement accounts or through pension funds) of US households, net of debts. In 2019, the Federal Reserve released its own official Distributional Financial Accounts painting a similar picture of a large rise in wealth concentration….
The Rise of Income Inequality: Beyond Tax Data
Bridging the Gap between the Study of Inequality and Macroeconomics
There has been a surge of research in recent years to which we have contributed our share, measuring income inequality using administrative tax data rather than self-reported household survey data. This work has made us aware of the large and growing gap between national income and taxable income. On the labor side, untaxed labor income includes tax-exempt employment benefits (contributions made by employers to pension plans and to private health insurance), employer payroll taxes, the labor income of non-filers, and unreported labor income due to tax evasion. The fraction of labor income which is taxable has declined from 80 to 85 percent in the post-World War II decades to just under 70 percent in 2018, due to the rise of employment fringe benefits—in particular the rise of employer contributions for health insurance, particularly expensive in the United States. Most studies of wage inequality ignore fringe benefits even though they are a large and growing fraction of labor costs. As for capital, only one-third of total capital income is reported on tax returns. Untaxed capital income includes undistributed corporate profits, the imputed rents of homeowners, capital income paid to pension accounts, and dividends and interest retained in trusts, estates, and fiduciaries….