Analysis of current economic conditions and policy
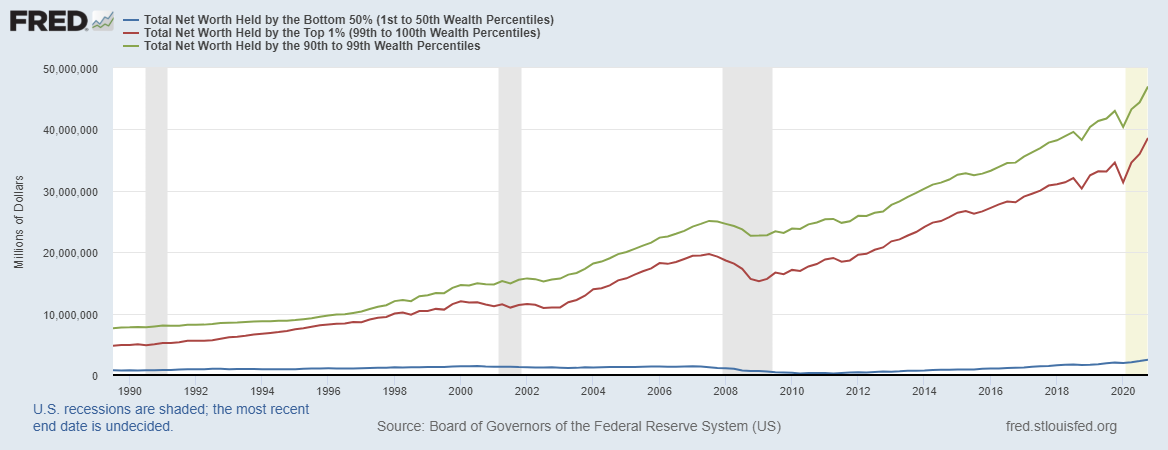
Net Worth for Bottom 50% and Above
Income distribution statistics come out annually, but net worth (asset/liability) distribution comes out quarterly.
Source: Federal Reserve Board, Financial Accounts of the United States, via FRED.
80 thoughts on “Net Worth for Bottom 50% and Above”
Barkley Rosser
Well, just goes to show how wrong I am sometimes. I just put a comment on another thread saying wealth data is harder to obtain than income data and that wealth distribution data s less available and less frequent than income distribution data, and here goes Menzie noting the quarterly Fed data on net worth. I am not sure how they gather that data. I also think that they have not been doing it for a super long time, but I could be completely wrong about that obviously, yet another thing MH can put on his list of reasons why the taxpayers of Virginia should shocked, shocked I tell you! shocked! that I am on their payroll as a prof at JMU, how utterly shameful, and with me claiming all this expertise on income distribution data, although it was over a decade ago that I was looking into that stuff really closely, more like two decades ago.
Moses Herzog
@ Barkley Junior
The topic of how often the data is reported was initiated between JohnH and “pgl”. If you weren’t such a hypersensitive narcissist you could have noticed that fairly easily.
I would trust someone like Thomas Piketty, Arindrajit Dube, Jill Yavorsky, or even some “old school” Simon Kuznets over Barkley Rosser on income distribution and wealth distribution. I think what some guy with only a bachelor’s from a small state university (not even in Economics) says about you, should be of very little consequence to you Junior. That person’s opinions should mean next to nil on a PhD prof’s radar. However, if such a person regularly found you to be in error on factual grounds, then I think that might be cause for major worry on your part. In which case I would understand your borderline obsession.
pgl
I would trust someone like Thomas Piketty, Arindrajit Dube, Jill Yavorsky, or even some “old school” Simon Kuznets
Barkley would trust these scholars as well. If you think your latest cheap shot at Barkley had any merit – just go back to your cheap wine and chill out.
Barkley Rosser
Gosh, Moses, of course when two people here get into a discussion, nobody else should say anything about it or participate. This is certainly a policy I know you have always followed fastidiously. Getting involved in other peoples’ discussions here is without doubt “hypersensitive narciissism,” as you so eloquently put it.
And I am no Simon Kuznets, even though he was the major professor of the the major professor of my major professor. It is just decline all the way.
Not to mention that you are also a supreme expert on facts here. Everyone was so appreciative when you pointed out how silly it was of me to claim that consumption grew at a record rate last May, and, of course, population geneticists all around the world have cited you multiple times for making it clear that even distributions of ancestorship across genes implies such even distributions across populations. The entire world is totally grateful to you for revealing this profound reality.
Moses Herzog
@ Barkley Junior
You can get involved in any topic you like, it’s a fountainhead of humor for me, please don’t stop. My complaint was you claiming you originated a topic which was raised between two other commenters, and your brain is so weak you can’t remember who raised the issue of reporting intervals for income distributions first just farther up inside that same comment thread.
You claimed a “skewed” distribution. The authors you yourself quoted labeled it near to a uniform distribution. No one is quoting you on Native American ancestry in the North American European population either Junior, but trust me, I’m praying for the day you write that paper with a respected scholar in that specialized literature. Not happening for you, sorry.
For the record, labeling the May consumption of 2020 “a record” is still a point only a jacka$$ would make, based on the fact of where consumption had been over the immediate prior months, not to mention how you were using “the record” for your claim that SAAR 2nd quarter GDP had a great chance to be positive. Which, if any of your colleagues read this blog, I’m sure sends them into near hysterical laughter, the same type they get when they read John Cuckrant’s (of Grumpy Economist infamy) strong implication that we’re on the precipice of 1970s inflation.
pgl
“My complaint was you claiming you originated a topic”
He did no such thing. He did contribute to the discussion – unlike you are your stupid notion that JohnH was merely complaining about the press reporters.
Moses Herzog
@ pgl
I know you’re horrible at reading between the lines, as you have to be good at reading comprehension first to be able to read between the lines:
“Well, just goes to show how wrong I am sometimes. I just put a comment on another thread saying wealth data is harder to obtain than income data and that wealth distribution data s less available and less frequent than income distribution data, and here goes Menzie noting the quarterly Fed data on net worth.”
The very obvious implication here is that El Narcisista in Virginia has delusions he inspired the post. This is the comment, by JohnH, which started the discussion: “To my knowledge, statistics on the prosperity of income quintiles and on the top 1% are tracked only annually. Which begs the question, why? Why not track household income by quintile as often as other statistics?”
Now…. I know pgl likes to label anything that calls out misstatements by pgl as “pointless”. In which case, I hope one day pgl will put it in the form I take the descriptor of “pointless” when it emanates from pgl: A gold medal of honor.
It is telling to note pgl thinks a misstatement on wealth distribution data availability is “a contribution”.
Barkley Rosser
Oh, of course you are completely correct, Moses, even though misguided pgl is claiming I did not claim to have initiated the discussion between him and JohnH. Of course my saying “I just put a comment on another thread that wealth data is harder to obtain than income data…” is clearly a claim to have “initiated” the whole discussion there. Everybody here can see that!
Regarding “skewed distributions” I have not published specifically on the matter of the distribution of Native American genes in populations. I have, however published on distributional issues in population genetics, although the titles may not look like it obviously. One of those has 365 citations, another 64, another 49, with several others having fewer. it has been stated here previously, much to your annoyance, that I personally knew Sewall Wright, one of the founders of modern population genetics and the neo-Darwinian synthesis, on which I have also published cited work. I happen to own Wright’s personal copy of his 1926 paper on corn-hog cycles. But, hey, of course my comments on skewed distributions of of genes in populations are clearly laughable and all here can see that clearly with you the superior expert, and have all along the many times you have brought this matter up following your efforts to repeat lies made by Trump and his pals about a certain femaie senator from Massachusetts. (I shall not bother to list the citations to works by me about skewed and kurtotic distributions more generally, although I shall remind you that I am one of 3 economists mentioned by Nassim Taleb in the pb edition of his Black Swan as living ones he respects, something I am sure you would like to correct him on, foolish him.)
Ah, of course you are completely correct that only a “jackass” would note that the rate of increase of consumption last May was by a record amount, a fact confirmed by our Menzie. The question then is, what kind of animal is a person who denied that it was a record and made insulting remarks about somebody noting that it was a record. A wise owl perchance?
Of course you also must be given credit for noting that it was not possible after the first Dem debate that Harris and Warren could be ahead in Iowa in the polls of Joe Biden, he whom you also so accurately depicted as being “s—-e,” along with me and Nancy Pelosi. Certainly his performance in office completely confirms your view along with that of Sean Hannity and V.V. Putin that he is “mentally challenged,” not to mention the complete disaster Harris has been as VP. At least we do not have that senator from MA in with all her awful statements about her Native American ancestry!
Moses Herzog
@ Barkley Junior
I am sure when your autobiography comes out (was that the rough draft you put there just now??), everyone will be quite impressed. However, that will not make the distribution of Native American ancestry (“admixture” if anyone prefers) in the European/”white” population of North America “skewed”. It’s not going to make a woman who most likely has less than 2% Native American blood “Cherokee” either, even if Senator Warren thought it would help her when applying for Ivy League university jobs or would give Harvard an “out” from hiring real minority candidates back around 1995.
“According to the test, Warren’s DNA is between 1/64 and 1/1032 Columbian, Mexican and/or Peruvian (used as proxies for measuring Cherokee heritage for reasons described in the report); between 0.1 percent and 1.5 percent of her DNA may be Native American in origin; she may have had a Native American ancestor between six to 10 generations back.
Warren depicted this as “slam dunk” proof that she really is of Native American ancestry. This is a base-rate fallacy. In fact, the average white person in America has 0.18 percent Native American DNA — meaning they could be described as about 1/ 556 Native American or as having a Native American ancestor nine to10 generations back. Warren does not seem to have a unique claim to Native American heritage over and above the typical white American.
Junior, why don’t you just tell us all that because the term “Black Swan” originated in the 2nd century that Nassim Taleb can confirm if Rachel Dolezal is black or not. It about adds up to your same basis of “logic” here.
Barkley Rosser
Very serious lol here, Moses. You have dredged back up the argument you made that made such a fool of you in the first place.
That the average amount of Native American ancestry in a European American is 0.18% does not mean that “the average European American” has 0.18% ancestry. Why not? Because indeed the distribution of that Native American ancestry is skewed. The hard fact is that the “average European American” has zero Native American ancestry. A majority of them have none. Why? Because you have these concentrations of “European Americans,” a minority of them, who have much higher amounts.
As it is when we first discussed this I did not know that you now live in Warren’s home state of Oklahoma. But that is exactly where there is a concentration of this minority of European Americans with high amounts of such ancestry, given the large numbers of Native Americans there, with it also being the state where they are probably more assimilated than in any other, with lots of resulting intermarriage with the European Americans who happened to have moved there a long time ago, unlike you, who arrived basically yesterday (do you have any Native American ancestry, Moses? I do not, and my ancestors have been here for hundreds of years).
The upshot is that probably the “average Oklahoma European American” has Native American ancestry, just like E. Warren, and quite possibly more than she has. The people there have been doing lots of intermarrying over quite a long time, without large numbers of recently-arrived-from-Europe immigrants there who would not be descended from all those people doing all that intermarrying.
But then there are places like Brighton Beach, Brooklyn, or South Boston, various Little Italies in numerous large cities of the US, where if they did not themselves arrive from Europe yesterday where basically nobody has Native American ancestry, they are descended on both sides from people who did arrive from somewhere in Europe pretty recently and have zero Native American ancestry. This is where it is at and why the majority of European Americans have zero Native American ancestry so that “the average European American” has zero Native American ancestry, even though “the average amount of Native American ancestry in European Americans” is 0.18%. That latter number gets driven up by all those “European Americans” in Oklahoma who have an 1/8 or a 1/4 Native American ancestry.
This has been explained to you before, and I think pretty much everybody else here got it who was around back then, and those now reading it for the first time will get it also. Do you finally get it, Moses?
Barkley Rosser
Adding a further clarification here, for anybody not quite getting this. The average amount of Native American ancestry in a European American is the mean of the distribution, 0.18% in this case reportedly. However the “average European American” is the one halfway through the distribution, which is the median. Given that a majority of European Americans have zero Native American ancestry, the value at the median is zero. They are not equal.
They are not equal because of the asymmetry of the distribution, its skewness, the fact that there are these clusters such as one finds in Oklahoma of small numbers of European Americans with much more than 0.18% Native ancestry. They drag the mean up, that “average” amount, even as there is this long tail of people, the majority, with zero such ancestry.
Thus Elizabeth Warren can have less (or not much more) Native ancestry than is the “average” amount, the mean amount, even as she has more than the median, the amount for the “average European American,” which is zero, and she does.
Regarding distributions, the mean is the first moment, the variance is the second moment (whose square root is the standard deviation), arguably the main measure of disperson, the third moment is skewness, which indicates this asymmetry, which when not zero means that the mean, median, and mode do not equal each other as they do in symmetric distributions, and kurtosis is the fourth moment, which measures excessive or extreme dispersion in both directions, the so-called “fat tails” that Nassim Taleb talks about a lot and that financial returns exhibit, and which also get modeled a lot by econophysicists.
The “normal” Gaussian distribution is fully characterized by its first two moments, the mean, or expected value, and the variance, its dispersion. Both skewness and kurtosis are zero. Intelligence is thought to exhibit such a distribution.
Income has a skewed distributon, and financial returns, as noted above, have fat tails, a positive fourth moment or kurtosis.
Most of financial theory is baeed on assuming Gaussian distributions, even though financial returns are not Gaussian due to their fat tails. This is why the grad textbook by John Cochrance, Asset Pricing, his most cited publication, is such an embarrassment. It does not even mention kurtosis or fat tails, although all financial practitioners have to deal with them. This has led to the use of things like copulas, which led to some problems in 2008.
Barkley Rosser
Oh, on that distribution of Native ancestry in the European American population, if number of observations is on the vertical axis as usual, then the zero is not a “tail” but a pileup on the zeroth amount, which is thus both the mode and the median.
Moses Herzog
@ Barkley Junior
I “get” that what the authors of the paper called very near to a uniform distribution of the Native American admixture in North American Europeans/”whites”, you mistakenly called a “skewed” distribution, tried to hide the link to the paper after you quoted it, and now you’re talking like a grade school kid, with an anecdotal type case and no papers, to avoid looking like the a$$ you are. I “get” that.
All of this, after you had to eat your own hat after Elizabeth Warren apologized by press conference for lying about her background: https://www.youtube.com/watch?v=vQdUiFLxqpQ <—-two minute video
Do you think Senator Warren asked multiple Native American leaders to attend her phony apology there, which would have made her belated “apology” look more legit optics-wise, and that not a one took her up on it and that is why you see her face the music alone?? Gee, I wonder……
JohnH
I never thought I’d see the day when an economist mocked someone for advocating for more timely data! But there was pgl breaching the zero bound!!!
Mocking my call for income data released as often as…say…inflation data, or GDP, etc.
I must say that I have long doubted the acronym pgl, which supposedly stands for progressive growth liberal. Ha! What progressive growth liberal wouldn’t care about the welfare of the general population in a timely manner, not lagging by almost a year? And what better indicator of the general welfare than monthly statistics on income by quintile or decile? [Let the mockery begin!!!]
But now I also have to doubt pgl’s creds as a bona fide economist. I mean, what economist doesn’t want better and more timely data?
pgl
“I never thought I’d see the day when an economist mocked someone for advocating for more timely data!”
Yes – leave to you to flat out LIE what this has been about. If it were feasible to report more data I’d be for it. But as I have noted many times the folks at Census do really hard work to report what they can. And for you to say they do not care about income distribution issues is just pathetic.
But that is who you are. A lying pathetic little whine bag. I’m sorry but there is no other way to put this. Get a life dude as your whining and demeaning people who do the hard work is just worthless trolling.
Barkley Rosser
The problem, JohnH, is that the “more timely data” is likely to be crap, made up bilge. Does the fact that highly questionable net worth data is being put out quarterly by the Fed when the really hard data only appears once every 3 years from the Survey of Consumer Finances lead to politicians or anybody else getting more active about doing anything about wealth distributional inequality, which is far more extreme than income inequality in the US?
JohnH
Interestingly, “A number of countries, such as Australia, have introduced distributional statistics in their national accounts while others are in the process of doing so. ” Other researchers have succeeded in estimating income shares by quintile for most of the last century. There is a methodology in place. Given research and experience, the methodology, the data, and the estimates would certainly improve over time.
But here’s the rub. Movers and shakers, including economists in powerful positions, don’t care enough about the rising and falling fortunes of the vast majority and won’t establish and fund the research needed to track it. It’s much better to pay people to track inflation on a monthly basis–something of interest to virtually no one but the wealthy and a few academics–than to track people’s well being across the income spectrum.
Speaking of crap, I still remember the day that my grad school professor took the class through the detail of how GDP numbers are compiled. I doubt that anyone left the room with much confidence in the number, particularly the percentage growth, down to a tenth of a percent, that is widely accepted as gospel today. But, presumably the data and the methodology have improved since then…
What’s also interesting to me is that this discussion is a departure from the usual one, where I say that there does not seem to be much interest among economists about a certain topic. pgl then misrepresents my statement to assert than I said that no one is interested, and then proceeds to reveal a paper indicating that someone, somewhere showed an interested in that particular topic, “definitively proving” his incorrect assertion.
This time around, no one stood up to prove me wrong by citing a paper. Is this an indication that the eminent economists on this blog are so little versed in the literature of inequality that they are not aware of such papers? Could they be a representative sample of economists generally? Hmmm…
Fortunately there are people working like Jedi Knights in the obscurity of planet Serelia to bring timely data on income distribution to the attention of the citizenry of the Empire. Not surprisingly, one is Joseph Stiglitz.
We should all support their efforts before we learn in November, 2022 that Democrats–totally unexpectedly–got trounced. How could that have happened? After all, the economy (for the rich) had been going gangbusters. Democrats had been exceedingly confident and ran on their economic record. But in the census data, published a few weeks before the election, it was revealed that 2021 incomes for the vast majority, spurring by stimulus checks, had been great…in the first quarter. Then there was a big drop, back to the norm. Biden had been a one hit wonder, stimulus checks, then nada. Republicans ran on nostalgia of the “Trump Miracle” of 2019, when real median incomes were higher than ever before.
In this fairly plausible scenarios, timely data on incomes by quintile could have informed Democrats on the angst of the American people and how to respond and preserve their tiny majorities.
Barkley Rosser
JohnH,
Sorry, but I just did what Menzie recommends and used Google to see if I could find any income distribution data estimared quarterly or more frequently in Australia. Maybe somebody is working on doing that down under there (maybe Not Trampis knows), but as of now the only data I could find, and I searched pretty hard, is annual, just like in the US, with some of it less frequent than that, namely for Gini coefficients.
Let me be clear since you may not realize it, constantly going on about how so many economists do not care about this, I have published quite a few papers on income distributional issues, some of them cited over 100 times. It was in doing so that I dug into this data sometime ago for many nations and was the basis of various remarks I made, most of them accurate except for my incorrect claim that weatth distribution data is reported less frequently than income distribution data in the US. As it is, however, those quarterly estimates by the Fed are cooked up by lots of complicated interpolations using highly questionable assumptions. It is frankly not very reliable. The hard numbers are reported only once every three years by the Survey of Consumer Finance, whereas indeed we do get annual data from the Census Bureau that are hard numbers. On that basic point I was right.
Lots of economists are interested in this. Do you not remember that the book on this by Piketty in 2014 was an actual bestseller? His coauthors have been getting lots of recognition by the AEA and are art prominent schools in the US. Lots of economists are working on this.
Oh, and I am sorry, but near as I can tell, the NIPA estimates are not really all that much better now than they were way back then (and who was that grad prof you had who dragged you through all that? Wondering if it was anybody I knew). Menzie can correct me if in fact there really has been a massive improvement in how all this is done, aside from having lots of computers now. I have not really checked on it in a serious way recently.
Barkley Rosser
Ooops. The Census Bureau data is annual for income distribution, as has been explained at length by pgl and me and others. The hard wealth distribution data is only once every three years from the Survey of Consumer Finance. The quarterly Fed reports are modeled out of that. Something like that could be done for income, but even Menzie notes this would involve heroic assumptions and may not be worth it.
Heck, it may be that the Fed did it for wealth because the hard numbers are so infrequent, while the income distribution data gives us hard numbers annually. That is pretty good, and really quite sufficient for informing the public and the politicians of the major trends in this that are going on. Economists can shout about this data all they want, but ultimately it is others who must act.
Barkley Rosser
OK, I have just checked on exactly where the Fed is getting these quarterly estimates, and this is a very fuzzy number. These “distributional financial accounts” (DFAs) are extimated by modeling based on interpolation between two data sets, which are based on different definitions of wealth categories. Anyway, the numbers that are hard and measured quarterly are aggregate values of equities, housing values, and other categories like those, which are reasonably available.
The tricky part is turning those into estimates of what is going on for different wealth level groups in the US. This depends on a hard number that is only estimated once every three years by a survey, about the rate I thought was the case, not even as frequently as the annual estimates by the Census Bureau of income distribution. These triennial surveys are carried out by the Survey of Consumer Finances, and are subject to the problem I mentioned on another thread, that people may lie in these surveys and there is no way for the SCF to double check on whether or not they are. About the best that can be hoped for is that the pattern of lying is consistent over time so that as one measures how this changes over time one does not get too much of a distortion.
Anyway, the SCF does give some degree of breakout of the composition of this wealth by income level, so the Fed uses that in a three stage estimation that includes translating those categories into the other categories and then heroically assuming that all the ratios remain reasonably constant for three years. So they have hard numbers quarterly on various wealth aggregates, but they essentially assume that SCF estimates that can be as out of date as by three years of how those aggregates are distributed across the wealth levels of the population in order to produce the numbers they report quarterly on supposed changes in net worth by wealth levels of the population, which show up in the FRED graph.
pgl
Gathering this data is very hard work. I salute Census for the hard work they put into gathering annual data on income distribution. Which is why I find JohnH’s claim that the folks at Census really do not care about this issue so incredibly insulting. He has no clue on this or almost anything else but that has never prevented him from getting on his high horse falsely accusing others of not caring.
pgl
One question – is that series in nominal terms or in real terms?
It is not surprising that we can track net worth quarterly as things like bank accounts, mortgages, stock valuations are reported on a regular basis. Now after tax income – who files their tax returns monthly?
On 2nd thought – that incredible disparity would persist even if these series were report in real dollars.
This is why we need things like Social Security and Federally paid health care. But of course Mitch McConnell likely wants to pay for infrastructure investment by scrapping both programs. After all – he cannot bring himself to tax the Hampton crowd.
Moses Herzog
I know some statistics is complicated, hence my now years long dream of one day mastering the program of “R”, along with a review of some stats. But I often think the hard part of statistics may not be the computing of the numbers, but rather, the “compiling” and “collection of” the numbers.
That’s all today from Captain Obvious, Signing off from duty.
Many apparently scoff at the need for more up to date data. Well, here’s a practical application: many liberals are still scratching their heads at how a racist, misogynist boor like Trump could possibly have garnered 74 million votes. I mean, how could Hispanics in the Rio Grande valley have possibly ditched the Democrats?
The data suggests an answer–like Trump said, more people were better off than ever before. For most of the Obama years real incomes of the lower quintiles had stagnated below their levels of 2000, 2007 and even 1989. And Democrats seemed to think that that was no problem. But after Trump took office, and particularly by 2019 real incomes were higher than ever before. Those who were swayed mostly by their prosperity presumably expected that Trump could deliver again after the pandemic ended.
Had liberals had access to monthly reports of rising prosperity under Trump, they could easily have seen early on that some Trump supporters had rational reasons for voting for the guy. Perhaps such information could have tempered liberals’ disdain for anyone who voted for him and led to some constructive dialogue.
Personally I voted third party, as usual. It didn’t affect the outcome, but it did register my protest. Had I had any inkling that Biden would be a pleasant surprise, I would have considered voting for him. Fortunately, Biden seems to have come to the conclusion that winning means catering to more than just the affluent and the wealthy.
pgl
“This month, the Census Bureau released its annual report on household income data for 2019.”
So they are only repeating the information from the hard working people at Census who you accused of not caring about this issue. Of course you do have this pathetic habit of making such bogus accusations with respect to the people who do the hard work.
‘Had liberals had access to monthly reports of rising prosperity under Trump, they could easily have seen early on that some Trump supporters had rational reasons for voting for the guy.’
Had I had a crystal ball, I could have predicted who won the Kentucky Derby. No one produces monthly data in this issue and if you do not get this by now – you are beyond clueless. Which I guess explains that really dumb statement about support for Trump. Like TCJA was a progressive tax cut. DUH!
pgl
Too bad their graph is not segmented out so we can see that the real income of the lower quartile rose each year from 2011 to 2019. I seem to recall in your first (really dumb) comment on this topic that you said any gain would be some sort of blip. Yea – a decade long blip. JohnH – wrong as usual on just about everything.
Macroduck
So, Obama was inaugurated during the worst recession in 7 decades, he undertook a massive fiscal stimulus without a single Republican vote in Congress, and “liberals” are to blame for weak wage growth? Trump inherited the longest expansion in U.S. history because Obama didn’t screw it up, cut taxes when the output gap was gone to keep the party going, and that’s evidence “liberals” lack some understanding of how things work?
The problem is not that your political views cloud your understanding of economics. Your views cloud your understanding of economics, history, politics and whatever else was in that stuff you wrote.
Before putting fingers to keyboard, get a grip on your biases.
pgl
Careful there – JohnH has now resorted to sheer lying along with this pathetic parade of putting people who get this down as not caring about poor people. But of course he used to do this garbage over at Thoma’s place so why not here.
JohnH May 2, 2021 at 8:44 pm
JohnH puts up a hard to read chart which he calls a user friendly format. I guess this is why he wrote this confused nonsense:
‘The data suggests an answer–like Trump said, more people were better off than ever before. For most of the Obama years real incomes of the lower quintiles had stagnated below their levels of 2000, 2007 and even 1989. And Democrats seemed to think that that was no problem. But after Trump took office, and particularly by 2019 real incomes were higher than ever before.’
Tax Policy Center presents the Census data so we can actually read it. It is true that the mean income for the lower quintile was low. After 8 years of Bush43 and the Great Recession, this was not exactly a surprise. And yes income in 2019 was higher for the lower quintile was higher but maybe JohnH aka Mr. Magoo never realized that this income rose each year from 2011 onwards.
Or maybe he is not as stupid as I have been accusing him of. After all – he totally lacks any integrity.
pgl
There happens to be one useful graph in your little source further down following this paragraph, which I just noticed and if you had an ounce of integrity (which you don’t) you would too:
‘To give us a better idea of the underlying trends in household incomes, we’ve also prepared a chart of the real percentage growth since 1967. Note in particular the growing spread between the top quintile (and especially the top 5%) and the other four quintiles. The growth spread began in the mid-1980s during the Reagan administration, the era of Supply Side Economics (aka “Reaganomics” and Trickle-Down Economics). As this chart illustrates, tax and other policy changes to benefit the wealthier households didn’t have the heavily promoted trickle-down effect. We’ve also highlighted recessions to show the correlation of household incomes to the business cycle.’
The graph does show that real income for the lower quintile took a hit after the Great Recession. Go figure. But after that hit real incomes started rising under Obama – the horrific jerk of a President according to Holier than Thou JohnH. Yea the Obama boom continued even after Trump took office. Of course the tax and policy changes from TCJA in 2017 was not exactly the progressive agenda you think Trump has been putting in effect. DUH!
pgl
There is also that conservative canard about how the disparity in consumption equality is not as great as the measured income inequality. While they note the Friedman permanent income hypothesis as the sole explanation, they are missing the implications that the rich get to save a lot more of their income than the poor. Which of course shows up in how incredibly unequal net worth is.
Alan Goldhammer
At the Berkshire Hathaway annual meeting this past weekend, vice Chairman Charlie Munger noted that Bernie Sanders has won the argument about income inequality. This graph shows why.
pgl
This was noted earlier. My snarky retort was something along these lines – Bernie has not won until we report income distribution on a weekly basis. Yea – stupid but that was the theme of JohnH’s first comment.
Moses Herzog
You know I really hate to play the role of peacemaker, especially when I’m sober and not slush drunk ‘cuz it’s less nauseating portraying peacemaker when I’m slush drunk. But…… maybe JohnH is putting the bulk of his complaint with the general media’s treatment of income distribution and not economists’ treatment of it. And I think he can at least be semi-forgiven if it doesn’t register with him how hard the data is to compile.
I’m wondering if a mixture of proxies could be used to obtain a rough but more current data estimate. I think it’s a worthy endeavor.
Barkley Rosser
Shame on you, Moses! Did you not just enunciate clearly that interfering in this discussion initiated by pgl and JohnH indicates one is suffering from hypersensitive narcissism? And we know that you never exhibit anything like that. Tsk tsk.
As it is, it is not obvious that generating either monthly or quarterly data on this would make any difference regarding the politics of this, especially given that the so-called data would be some sort of artificially modeled unreliable bilge. In fact the annual series do show the trends. It is a matter of people paying attention to those trends and acting on them or not.
pgl
“maybe JohnH is putting the bulk of his complaint with the general media’s treatment of income distribution and not economists’ treatment of it.”
So when he bashes Paul Krugman with his usual dishonest drivel, Krugman is a reporter not an economist? No Moses – he was bashes the folks at Census. Who knew they are all reporters!
pgl
“maybe JohnH is putting the bulk of his complaint with the general media’s treatment of income distribution and not economists’ treatment of it.”
We have winner for the dumbest comment of the week. Unless the hard working people at Census are nothing but reporters, if the only role Krugman has at the NYTimes is journalist, Uncle Moses missed the entire boat.
Maybe a short video on local TV with Sandra telling people how it feels to have your 13+ years boyfriend groping women while you’re picking out engagement rings could add a “personal touch” to make him more relatable to Sophia Loren fans.
Macroduck
What implication did Munger draw from Bernie’s victory?
Moses Herzog
I think it went something like “Poor me, I may have to pay the same tax rate working Americans have had to pay for the last 40 years. Don’t you people know I’m special??”
That’s a paraphrase of something I never heard, but I have the distinct idea it went down like that.
Share of Total Net Worth Held by Top 1%, Top 90 to 99% and Top 50 to 90%, 1990-2020
ltr
Note: the top reference link is fine but the bottom link is faulty and being worked on.
ltr
The reference links to the net worth share graphs are correct, however FRED is having trouble with them.
2slugbaits
As bad as that graph is, the reality is even worse. The chart’s vertical axis cuts off at zero, but the net worth of the bottom 10 percent of households is actually negative.
Thanks for this. The Urban Institute certainly does yeoman work on these issues – even if JohnH thinks they do not care since they do not report income statistics more than annually.
Moses Herzog
That one doesn’t surprise me at all. Ever count the number of payday loan outfits in some neighborhoods??~~along with “services” and apps which will allow people the collect their check early if they pay a fee or interest on the payment.
When I was learning to drive semi and in my first few weeks of driving, the company I worked for regularly, no near obsessively, told drivers (because they knew many were in bad straights starting out and were near financially illiterate) they could get “advances” on their salaries. They never called these short-term small loans, which is what they indeed were. “Collateralized” by their own salary, which they had in essence already earned. If you looked at the small amount the drivers were getting, in the advances vs the fee or rate, if you worked it out on an annual basis the interest rate was monstrously high, I would say it was a usury rate. But the semi companies always acted like they were doing drivers a big favor. Most of those semi-drivers were working class, “salt of the Earth” type people who’d give you the shirt off their backs if you needed it. They just were dumb as hell on money issues. And the semi companies knew that. I have no doubt they do those same things to this very day, only it’s probably even more digitized now, and easier than it was in my day to click something on your phone with your thumb to get the debt—to pay interest on your own damned salary.
pgl
Maybe I should just delete LinkedIn from my computer and pollyanna free trade is grand babble keeps popping up such as their rah rah – the pharma multinationals saved our lives:
No mention of mega profits accruing to tax havens. Or the distribution consequences of free trade – not from a bunch of right wingers on LinkedIn. I grew tried of reading it so feel free to take whatever shot at this cheerleader you wish.
ltr
Luxembourg Income Study https://www.lisdatacenter.org/ offers the most comprehensive and immediate information on income distribution internationally.
Barkley Rosser
ltr,
The LIS is certainly one of the best comprehensive sources on income distribution around the world. Probably its only rival is OECD, except that the OECD only has data for its member nations, where the quality of data is much better than in most of the rest of the world.
A major longtime figure associated with the LIS is Tim Smeeding, a colleague of Menzie’s at the LaFollette School at UW-Madison who retired not too long ago but is still professionally active, one of the world’s leading experts on income distribution. To JohnH, Tim served as Director of the UW’s Center for Research on Poverty for quite a few years.
pgl
Interesting data. I think Paul Krugman has been citing this data ever since he started at CUNY.
Not only do you pay a fortune with your iPhone, if you use a 3rd party app, the 3rd party has to pay Apple 30% of the revenue received by the 3rd party. One 3rd party is taking Apple to court for its anti-competitive highway robbery.
Moses Herzog
The fact that this is even being discussed, tells you all you need to know about both the CEO of Facebook, and the platform itself. I dead stop gutter for sewage, that makes Reddit look hygienic by comparison: https://www.nytimes.com/2021/05/03/technology/facebook-trump-ban.html
pgl
He already has an open mic down at Maro Lago with a band to back up his parade of lies. I’m all for the First Amendment but in the case of traitor wannabe dictators, his right to free speech should be curtailed.
baffling
From about 2000 to 2003, the 1% gained (actually lost) at a different rate than the top 10%. what caused this? the dot-com crash? were the extremely wealthy that impacted by stock (or ownership fo the firms?). or was it a policy change? after 2003, it appears both groups grow with a similar slope.
AgTrader
Will we ever get a mea culpa on the stupidity of your soybean posts? I doubt it
AgTrader: Sorry, stupidity of which soybean posts? The ones where I noted the accuracy/unbiasedness of futures contracts, the ones where I noted the decline in soybean prices in the wake of the trade war, the ones where I noted the dependence of soybean (and other ag commodity prices) on the dollar’s value?
Moses Herzog
I think he’s referring to how you didn’t filter CoRev’s and Ed Hanson’s comments. (joke, sorry, sometimes I can’t resist the low-lying fruit)
pgl
Is this a new name for CoRev – or just his Minnie Me?
Share of Total Net Worth Held by Top 1%, Top 90 to 99% and Top 50 to 90%, 2000-2020
(Indexed to 2000)
Steven Kopits
So here’s a question for Menzie or Jim or anyone else interested in the topic: What is the systemic risk of cryptocurrencies? I remember reading about CLOs and CMOs and SPACs in 2007 and having no idea what they were, and poof, they took down the financial system in 2008. Do cryptocurrencies represent an analogous risk, or are they simply unimportant?
Barkley Rosser
Steven,
Absolutely unknowable in any seriously scientific way. Of course lots o people will be willing to make authoritative statements based on something or other. If you wish to believe any of them, well, get some darts.
2slugbaits
Steven Kopits It would be more on topic if you inquired about the extent to which highly illiquid cryptocurrencies represent real wealth.
Moses Herzog
There’s an oil industry “consultant” in New Jersey who claims he doesn’t know the oil industry gets hundreds of billions in government subsidies (sometimes called social welfare or income redistribution). I’d check with him and see what he says about it. You’ll see him with the red colored dunce cap on OANN saying that tomato and citrus fruit pickers are raping white women all along the rural American countryside. He also says the price at the U.S. gas station pump will soon be $4 a gallon….. so keep an eye out for that.
pgl
“I remember reading about CLOs and CMOs and SPACs in 2007 and having no idea what they were”
Back in 2007 I was reviewing certain materials from New Century and Country Wide when it hit me that their entire business models were Ponzi schemes about to take down housing finance big time. They had smart people – sort of like the sophisticated crooks at Enron.
baffling
i do not think spac’s were part of the problem in 2008.
the tools you are referencing in 2007 were derivative products. this means they are probably leveraged and artificial in nature. unless cryptos and spac’s (in 2021) have similar characteristics, then i don’t think they will have the same outsized influence. cdo’s and other similar instruments had notional values in the trillions due to their leverage, and this is what brought the financial system to its knees when it crashed. i don’t see that with crypto or spacs at this point.
interestingly, i just bought my first crypto recently through coinbase. not a large investment, but enough to make myself a little educated. i went with ethereum rather than bitcoin, mostly because its blockchain technology has some valuable uses. may buy bitcoin in the future though. can’s say i am sold on crypto yet. it has made me money, though, as i bought square a couple years ago as a proxy for bitcoin (its cash app allows you to buy bitcoin). should have bought Bitcoin directly, but good trade nevertheless. millennials and younger seem to have more faith in crypto than gold. long term security of the crypto seems to be a concern of mine.
Macroduck
Use as collateral, or any use in capital structure in the financial sector, is a critical element in creating one kind of systemic risk. Not sure, but my impressionis that crypto-currenxies do not have a large role in the capital structure of systemically important financial firms. If that’s right, then at least one form of systemic risk from crypto$ is small.
Priblem is, we may not be so good at identifying novel forms of systemic risk. Financial innovationtend to lead to financial crisis – part of the learning process. We learn to fence in risk after risk manifests.
Macroduck
Remember, something as simple as bank savings accounts have been transmitters of systemic risks. Crypt$ accountsare similar to uninsured savings accounts. There is a fire-break between crypto$ accounts and insured accounts, which is a comfort.
baffling
coinbase seem to have some ability to buy on margin. have not investigated it thoroughly, but my initial thought is this COULD be problematic. not sure how easy it is to access that margin account.
Kevin Drum listens to 60 Minutes so Bruce Hall does not have to:
Anyway, we’re now being deluged with stories along this line. Last night, for example, 60 Minutes ran a segment about the shortage of chips for cars and videogames and whatnot. And why is there a shortage of chips? Is it because we’ve outsourced everything to the wily Chinese folks on Taiwan? You’d think so after inhaling Lesley Stahl’s inane reporting, except for the fact that she inadvertently allowed the chairman of Taiwanese chipmaker TSMC a brief moment to give the game away: “In March, 2020, as COVID paralyzed the U.S., car sales tumbled, leading automakers to cancel their chip orders. So TSMC stopped making them.” Oh. So it has nothing to do with Taiwanese fabs vs. American fabs or global supply constraints or any of that. Nor is it related to a possible invasion of Taiwan or the fact that Intel may or may not have made good decisions about its future business. It’s because American car companies canceled their chip orders and never bothered to reinstate them. Then in December, when car sales “unexpectedly” began to rebound, they panicked and realized what they had done. You’d think these guys had never done an economic forecast or used an MRP system before in their lives.
This was only a portion of Kevin’s tirade over stupid reporters. I watched the same episode and yea it was kind of dumb. But in fairness to Lesley Stahl – her reporting was a LOT more insightful when compared to Bruce Hall’s dumb rants on this topic.
pgl
A different topic but what Peter Orszag has to say about the Biden infrastructure proposal is a must read:
Orszag calls out the “new pundit” view that our bridges and roads are not the bad. It is interesting I found this over at Kevin Drum’s place since Kevin is a leading figure in this new pundit camp.
baffling
i have seen this minimization technique in action on this blog. at one point, when it worked in his favor, steven kopits argued how our infrastructure was falling apart. but the very next day, he challenged that notion when it was also a convenient argument, saying our infrastructure is fine and we are overspending on it. you cannot have it both ways.
the fact is, our infrastructure is falling behind every day, and a lack of investment will result in a tsunami of issues as time goes on. we have an enormous amount of infrastructure, especially bridges, that are 50 to 75 years old. not only are they structurally deficient, they are operationally deficient as well. many of your time consuming traffic jams occur at highway interchanges that have too few lanes to handle the mixing of traffic. often times, those lane limitations are a result of bridges that cannot be widened. this is just one example of how our infrastructure is falling behind in both safety and performance.
biden is right to expand the notion of what infrastructure is. we cannot keep living in a world defined by the 1950’s. what constitutes infrastructure-the basics required for the performance of the society desired-has expanded to include energy and information. investing in our infrastructure is an investment in America’s future. those fighting are simply weakening our future.
pgl
Switzerland is angry at President Biden for saying they are a tax haven just like the Caymans and Bermuda:
Switzerland may be a nice place to ski but they need to get over it – the nation is a tax haven. Just without the really nice beaches.
pgl
“Barkley Rosser May 4, 2021 at 6:42 pm
JohnH,
Sorry, but I just did what Menzie recommends and used Google to see if I could find any income distribution data estimared quarterly or more frequently in Australia. Maybe somebody is working on doing that down under there (maybe Not Trampis knows)”
Barkley is responding to some long winded whiny BS from JohnH. It is funny that JohnH under another thread told us the Aussies only do this every 3 years. Of course he is wrong about that too. Since Joseph Stiglitz et al. recommended reporting income by quintiles back in 2009, the Aussies are doing this on an annual basis.
Not monthly? Is JohnH now telling us that Stiglitz does not care about income distribution???
Well, just goes to show how wrong I am sometimes. I just put a comment on another thread saying wealth data is harder to obtain than income data and that wealth distribution data s less available and less frequent than income distribution data, and here goes Menzie noting the quarterly Fed data on net worth. I am not sure how they gather that data. I also think that they have not been doing it for a super long time, but I could be completely wrong about that obviously, yet another thing MH can put on his list of reasons why the taxpayers of Virginia should shocked, shocked I tell you! shocked! that I am on their payroll as a prof at JMU, how utterly shameful, and with me claiming all this expertise on income distribution data, although it was over a decade ago that I was looking into that stuff really closely, more like two decades ago.
@ Barkley Junior
The topic of how often the data is reported was initiated between JohnH and “pgl”. If you weren’t such a hypersensitive narcissist you could have noticed that fairly easily.
I would trust someone like Thomas Piketty, Arindrajit Dube, Jill Yavorsky, or even some “old school” Simon Kuznets over Barkley Rosser on income distribution and wealth distribution. I think what some guy with only a bachelor’s from a small state university (not even in Economics) says about you, should be of very little consequence to you Junior. That person’s opinions should mean next to nil on a PhD prof’s radar. However, if such a person regularly found you to be in error on factual grounds, then I think that might be cause for major worry on your part. In which case I would understand your borderline obsession.
I would trust someone like Thomas Piketty, Arindrajit Dube, Jill Yavorsky, or even some “old school” Simon Kuznets
Barkley would trust these scholars as well. If you think your latest cheap shot at Barkley had any merit – just go back to your cheap wine and chill out.
Gosh, Moses, of course when two people here get into a discussion, nobody else should say anything about it or participate. This is certainly a policy I know you have always followed fastidiously. Getting involved in other peoples’ discussions here is without doubt “hypersensitive narciissism,” as you so eloquently put it.
And I am no Simon Kuznets, even though he was the major professor of the the major professor of my major professor. It is just decline all the way.
Not to mention that you are also a supreme expert on facts here. Everyone was so appreciative when you pointed out how silly it was of me to claim that consumption grew at a record rate last May, and, of course, population geneticists all around the world have cited you multiple times for making it clear that even distributions of ancestorship across genes implies such even distributions across populations. The entire world is totally grateful to you for revealing this profound reality.
@ Barkley Junior
You can get involved in any topic you like, it’s a fountainhead of humor for me, please don’t stop. My complaint was you claiming you originated a topic which was raised between two other commenters, and your brain is so weak you can’t remember who raised the issue of reporting intervals for income distributions first just farther up inside that same comment thread.
You claimed a “skewed” distribution. The authors you yourself quoted labeled it near to a uniform distribution. No one is quoting you on Native American ancestry in the North American European population either Junior, but trust me, I’m praying for the day you write that paper with a respected scholar in that specialized literature. Not happening for you, sorry.
For the record, labeling the May consumption of 2020 “a record” is still a point only a jacka$$ would make, based on the fact of where consumption had been over the immediate prior months, not to mention how you were using “the record” for your claim that SAAR 2nd quarter GDP had a great chance to be positive. Which, if any of your colleagues read this blog, I’m sure sends them into near hysterical laughter, the same type they get when they read John Cuckrant’s (of Grumpy Economist infamy) strong implication that we’re on the precipice of 1970s inflation.
“My complaint was you claiming you originated a topic”
He did no such thing. He did contribute to the discussion – unlike you are your stupid notion that JohnH was merely complaining about the press reporters.
@ pgl
I know you’re horrible at reading between the lines, as you have to be good at reading comprehension first to be able to read between the lines:
“Well, just goes to show how wrong I am sometimes. I just put a comment on another thread saying wealth data is harder to obtain than income data and that wealth distribution data s less available and less frequent than income distribution data, and here goes Menzie noting the quarterly Fed data on net worth.”
The very obvious implication here is that El Narcisista in Virginia has delusions he inspired the post. This is the comment, by JohnH, which started the discussion:
“To my knowledge, statistics on the prosperity of income quintiles and on the top 1% are tracked only annually. Which begs the question, why? Why not track household income by quintile as often as other statistics?”
Now…. I know pgl likes to label anything that calls out misstatements by pgl as “pointless”. In which case, I hope one day pgl will put it in the form I take the descriptor of “pointless” when it emanates from pgl: A gold medal of honor.
It is telling to note pgl thinks a misstatement on wealth distribution data availability is “a contribution”.
Oh, of course you are completely correct, Moses, even though misguided pgl is claiming I did not claim to have initiated the discussion between him and JohnH. Of course my saying “I just put a comment on another thread that wealth data is harder to obtain than income data…” is clearly a claim to have “initiated” the whole discussion there. Everybody here can see that!
Regarding “skewed distributions” I have not published specifically on the matter of the distribution of Native American genes in populations. I have, however published on distributional issues in population genetics, although the titles may not look like it obviously. One of those has 365 citations, another 64, another 49, with several others having fewer. it has been stated here previously, much to your annoyance, that I personally knew Sewall Wright, one of the founders of modern population genetics and the neo-Darwinian synthesis, on which I have also published cited work. I happen to own Wright’s personal copy of his 1926 paper on corn-hog cycles. But, hey, of course my comments on skewed distributions of of genes in populations are clearly laughable and all here can see that clearly with you the superior expert, and have all along the many times you have brought this matter up following your efforts to repeat lies made by Trump and his pals about a certain femaie senator from Massachusetts. (I shall not bother to list the citations to works by me about skewed and kurtotic distributions more generally, although I shall remind you that I am one of 3 economists mentioned by Nassim Taleb in the pb edition of his Black Swan as living ones he respects, something I am sure you would like to correct him on, foolish him.)
Ah, of course you are completely correct that only a “jackass” would note that the rate of increase of consumption last May was by a record amount, a fact confirmed by our Menzie. The question then is, what kind of animal is a person who denied that it was a record and made insulting remarks about somebody noting that it was a record. A wise owl perchance?
Of course you also must be given credit for noting that it was not possible after the first Dem debate that Harris and Warren could be ahead in Iowa in the polls of Joe Biden, he whom you also so accurately depicted as being “s—-e,” along with me and Nancy Pelosi. Certainly his performance in office completely confirms your view along with that of Sean Hannity and V.V. Putin that he is “mentally challenged,” not to mention the complete disaster Harris has been as VP. At least we do not have that senator from MA in with all her awful statements about her Native American ancestry!
@ Barkley Junior
I am sure when your autobiography comes out (was that the rough draft you put there just now??), everyone will be quite impressed. However, that will not make the distribution of Native American ancestry (“admixture” if anyone prefers) in the European/”white” population of North America “skewed”. It’s not going to make a woman who most likely has less than 2% Native American blood “Cherokee” either, even if Senator Warren thought it would help her when applying for Ivy League university jobs or would give Harvard an “out” from hiring real minority candidates back around 1995.
“According to the test, Warren’s DNA is between 1/64 and 1/1032 Columbian, Mexican and/or Peruvian (used as proxies for measuring Cherokee heritage for reasons described in the report); between 0.1 percent and 1.5 percent of her DNA may be Native American in origin; she may have had a Native American ancestor between six to 10 generations back.
Warren depicted this as “slam dunk” proof that she really is of Native American ancestry. This is a base-rate fallacy. In fact, the average white person in America has 0.18 percent Native American DNA — meaning they could be described as about 1/ 556 Native American or as having a Native American ancestor nine to10 generations back. Warren does not seem to have a unique claim to Native American heritage over and above the typical white American.
For comparison: the average U.S. white also has about 0.19 percent African DNA; they can be said to be 1/ 526 black or to have a black ancestor nine to10 generations back. Rachel Dolezal might have about the same genetic claim to being black as Elizabeth Warren does to being Cherokee. “
https://thehill.com/opinion/white-house/412321-dna-is-irrelevant-elizabeth-warren-is-simply-not-cherokee
Junior, why don’t you just tell us all that because the term “Black Swan” originated in the 2nd century that Nassim Taleb can confirm if Rachel Dolezal is black or not. It about adds up to your same basis of “logic” here.
Very serious lol here, Moses. You have dredged back up the argument you made that made such a fool of you in the first place.
That the average amount of Native American ancestry in a European American is 0.18% does not mean that “the average European American” has 0.18% ancestry. Why not? Because indeed the distribution of that Native American ancestry is skewed. The hard fact is that the “average European American” has zero Native American ancestry. A majority of them have none. Why? Because you have these concentrations of “European Americans,” a minority of them, who have much higher amounts.
As it is when we first discussed this I did not know that you now live in Warren’s home state of Oklahoma. But that is exactly where there is a concentration of this minority of European Americans with high amounts of such ancestry, given the large numbers of Native Americans there, with it also being the state where they are probably more assimilated than in any other, with lots of resulting intermarriage with the European Americans who happened to have moved there a long time ago, unlike you, who arrived basically yesterday (do you have any Native American ancestry, Moses? I do not, and my ancestors have been here for hundreds of years).
The upshot is that probably the “average Oklahoma European American” has Native American ancestry, just like E. Warren, and quite possibly more than she has. The people there have been doing lots of intermarrying over quite a long time, without large numbers of recently-arrived-from-Europe immigrants there who would not be descended from all those people doing all that intermarrying.
But then there are places like Brighton Beach, Brooklyn, or South Boston, various Little Italies in numerous large cities of the US, where if they did not themselves arrive from Europe yesterday where basically nobody has Native American ancestry, they are descended on both sides from people who did arrive from somewhere in Europe pretty recently and have zero Native American ancestry. This is where it is at and why the majority of European Americans have zero Native American ancestry so that “the average European American” has zero Native American ancestry, even though “the average amount of Native American ancestry in European Americans” is 0.18%. That latter number gets driven up by all those “European Americans” in Oklahoma who have an 1/8 or a 1/4 Native American ancestry.
This has been explained to you before, and I think pretty much everybody else here got it who was around back then, and those now reading it for the first time will get it also. Do you finally get it, Moses?
Adding a further clarification here, for anybody not quite getting this. The average amount of Native American ancestry in a European American is the mean of the distribution, 0.18% in this case reportedly. However the “average European American” is the one halfway through the distribution, which is the median. Given that a majority of European Americans have zero Native American ancestry, the value at the median is zero. They are not equal.
They are not equal because of the asymmetry of the distribution, its skewness, the fact that there are these clusters such as one finds in Oklahoma of small numbers of European Americans with much more than 0.18% Native ancestry. They drag the mean up, that “average” amount, even as there is this long tail of people, the majority, with zero such ancestry.
Thus Elizabeth Warren can have less (or not much more) Native ancestry than is the “average” amount, the mean amount, even as she has more than the median, the amount for the “average European American,” which is zero, and she does.
Regarding distributions, the mean is the first moment, the variance is the second moment (whose square root is the standard deviation), arguably the main measure of disperson, the third moment is skewness, which indicates this asymmetry, which when not zero means that the mean, median, and mode do not equal each other as they do in symmetric distributions, and kurtosis is the fourth moment, which measures excessive or extreme dispersion in both directions, the so-called “fat tails” that Nassim Taleb talks about a lot and that financial returns exhibit, and which also get modeled a lot by econophysicists.
The “normal” Gaussian distribution is fully characterized by its first two moments, the mean, or expected value, and the variance, its dispersion. Both skewness and kurtosis are zero. Intelligence is thought to exhibit such a distribution.
Income has a skewed distributon, and financial returns, as noted above, have fat tails, a positive fourth moment or kurtosis.
Most of financial theory is baeed on assuming Gaussian distributions, even though financial returns are not Gaussian due to their fat tails. This is why the grad textbook by John Cochrance, Asset Pricing, his most cited publication, is such an embarrassment. It does not even mention kurtosis or fat tails, although all financial practitioners have to deal with them. This has led to the use of things like copulas, which led to some problems in 2008.
Oh, on that distribution of Native ancestry in the European American population, if number of observations is on the vertical axis as usual, then the zero is not a “tail” but a pileup on the zeroth amount, which is thus both the mode and the median.
@ Barkley Junior
I “get” that what the authors of the paper called very near to a uniform distribution of the Native American admixture in North American Europeans/”whites”, you mistakenly called a “skewed” distribution, tried to hide the link to the paper after you quoted it, and now you’re talking like a grade school kid, with an anecdotal type case and no papers, to avoid looking like the a$$ you are. I “get” that.
All of this, after you had to eat your own hat after Elizabeth Warren apologized by press conference for lying about her background:
https://www.youtube.com/watch?v=vQdUiFLxqpQ <—-two minute video
Do you think Senator Warren asked multiple Native American leaders to attend her phony apology there, which would have made her belated “apology” look more legit optics-wise, and that not a one took her up on it and that is why you see her face the music alone?? Gee, I wonder……
I never thought I’d see the day when an economist mocked someone for advocating for more timely data! But there was pgl breaching the zero bound!!!
Mocking my call for income data released as often as…say…inflation data, or GDP, etc.
I must say that I have long doubted the acronym pgl, which supposedly stands for progressive growth liberal. Ha! What progressive growth liberal wouldn’t care about the welfare of the general population in a timely manner, not lagging by almost a year? And what better indicator of the general welfare than monthly statistics on income by quintile or decile? [Let the mockery begin!!!]
But now I also have to doubt pgl’s creds as a bona fide economist. I mean, what economist doesn’t want better and more timely data?
“I never thought I’d see the day when an economist mocked someone for advocating for more timely data!”
Yes – leave to you to flat out LIE what this has been about. If it were feasible to report more data I’d be for it. But as I have noted many times the folks at Census do really hard work to report what they can. And for you to say they do not care about income distribution issues is just pathetic.
But that is who you are. A lying pathetic little whine bag. I’m sorry but there is no other way to put this. Get a life dude as your whining and demeaning people who do the hard work is just worthless trolling.
The problem, JohnH, is that the “more timely data” is likely to be crap, made up bilge. Does the fact that highly questionable net worth data is being put out quarterly by the Fed when the really hard data only appears once every 3 years from the Survey of Consumer Finances lead to politicians or anybody else getting more active about doing anything about wealth distributional inequality, which is far more extreme than income inequality in the US?
Interestingly, “A number of countries, such as Australia, have introduced distributional statistics in their national accounts while others are in the process of doing so. ” Other researchers have succeeded in estimating income shares by quintile for most of the last century. There is a methodology in place. Given research and experience, the methodology, the data, and the estimates would certainly improve over time.
But here’s the rub. Movers and shakers, including economists in powerful positions, don’t care enough about the rising and falling fortunes of the vast majority and won’t establish and fund the research needed to track it. It’s much better to pay people to track inflation on a monthly basis–something of interest to virtually no one but the wealthy and a few academics–than to track people’s well being across the income spectrum.
Speaking of crap, I still remember the day that my grad school professor took the class through the detail of how GDP numbers are compiled. I doubt that anyone left the room with much confidence in the number, particularly the percentage growth, down to a tenth of a percent, that is widely accepted as gospel today. But, presumably the data and the methodology have improved since then…
What’s also interesting to me is that this discussion is a departure from the usual one, where I say that there does not seem to be much interest among economists about a certain topic. pgl then misrepresents my statement to assert than I said that no one is interested, and then proceeds to reveal a paper indicating that someone, somewhere showed an interested in that particular topic, “definitively proving” his incorrect assertion.
This time around, no one stood up to prove me wrong by citing a paper. Is this an indication that the eminent economists on this blog are so little versed in the literature of inequality that they are not aware of such papers? Could they be a representative sample of economists generally? Hmmm…
Fortunately there are people working like Jedi Knights in the obscurity of planet Serelia to bring timely data on income distribution to the attention of the citizenry of the Empire. Not surprisingly, one is Joseph Stiglitz.
We should all support their efforts before we learn in November, 2022 that Democrats–totally unexpectedly–got trounced. How could that have happened? After all, the economy (for the rich) had been going gangbusters. Democrats had been exceedingly confident and ran on their economic record. But in the census data, published a few weeks before the election, it was revealed that 2021 incomes for the vast majority, spurring by stimulus checks, had been great…in the first quarter. Then there was a big drop, back to the norm. Biden had been a one hit wonder, stimulus checks, then nada. Republicans ran on nostalgia of the “Trump Miracle” of 2019, when real median incomes were higher than ever before.
In this fairly plausible scenarios, timely data on incomes by quintile could have informed Democrats on the angst of the American people and how to respond and preserve their tiny majorities.
JohnH,
Sorry, but I just did what Menzie recommends and used Google to see if I could find any income distribution data estimared quarterly or more frequently in Australia. Maybe somebody is working on doing that down under there (maybe Not Trampis knows), but as of now the only data I could find, and I searched pretty hard, is annual, just like in the US, with some of it less frequent than that, namely for Gini coefficients.
Let me be clear since you may not realize it, constantly going on about how so many economists do not care about this, I have published quite a few papers on income distributional issues, some of them cited over 100 times. It was in doing so that I dug into this data sometime ago for many nations and was the basis of various remarks I made, most of them accurate except for my incorrect claim that weatth distribution data is reported less frequently than income distribution data in the US. As it is, however, those quarterly estimates by the Fed are cooked up by lots of complicated interpolations using highly questionable assumptions. It is frankly not very reliable. The hard numbers are reported only once every three years by the Survey of Consumer Finance, whereas indeed we do get annual data from the Census Bureau that are hard numbers. On that basic point I was right.
Lots of economists are interested in this. Do you not remember that the book on this by Piketty in 2014 was an actual bestseller? His coauthors have been getting lots of recognition by the AEA and are art prominent schools in the US. Lots of economists are working on this.
Oh, and I am sorry, but near as I can tell, the NIPA estimates are not really all that much better now than they were way back then (and who was that grad prof you had who dragged you through all that? Wondering if it was anybody I knew). Menzie can correct me if in fact there really has been a massive improvement in how all this is done, aside from having lots of computers now. I have not really checked on it in a serious way recently.
Ooops. The Census Bureau data is annual for income distribution, as has been explained at length by pgl and me and others. The hard wealth distribution data is only once every three years from the Survey of Consumer Finance. The quarterly Fed reports are modeled out of that. Something like that could be done for income, but even Menzie notes this would involve heroic assumptions and may not be worth it.
Heck, it may be that the Fed did it for wealth because the hard numbers are so infrequent, while the income distribution data gives us hard numbers annually. That is pretty good, and really quite sufficient for informing the public and the politicians of the major trends in this that are going on. Economists can shout about this data all they want, but ultimately it is others who must act.
OK, I have just checked on exactly where the Fed is getting these quarterly estimates, and this is a very fuzzy number. These “distributional financial accounts” (DFAs) are extimated by modeling based on interpolation between two data sets, which are based on different definitions of wealth categories. Anyway, the numbers that are hard and measured quarterly are aggregate values of equities, housing values, and other categories like those, which are reasonably available.
The tricky part is turning those into estimates of what is going on for different wealth level groups in the US. This depends on a hard number that is only estimated once every three years by a survey, about the rate I thought was the case, not even as frequently as the annual estimates by the Census Bureau of income distribution. These triennial surveys are carried out by the Survey of Consumer Finances, and are subject to the problem I mentioned on another thread, that people may lie in these surveys and there is no way for the SCF to double check on whether or not they are. About the best that can be hoped for is that the pattern of lying is consistent over time so that as one measures how this changes over time one does not get too much of a distortion.
Anyway, the SCF does give some degree of breakout of the composition of this wealth by income level, so the Fed uses that in a three stage estimation that includes translating those categories into the other categories and then heroically assuming that all the ratios remain reasonably constant for three years. So they have hard numbers quarterly on various wealth aggregates, but they essentially assume that SCF estimates that can be as out of date as by three years of how those aggregates are distributed across the wealth levels of the population in order to produce the numbers they report quarterly on supposed changes in net worth by wealth levels of the population, which show up in the FRED graph.
Gathering this data is very hard work. I salute Census for the hard work they put into gathering annual data on income distribution. Which is why I find JohnH’s claim that the folks at Census really do not care about this issue so incredibly insulting. He has no clue on this or almost anything else but that has never prevented him from getting on his high horse falsely accusing others of not caring.
One question – is that series in nominal terms or in real terms?
It is not surprising that we can track net worth quarterly as things like bank accounts, mortgages, stock valuations are reported on a regular basis. Now after tax income – who files their tax returns monthly?
pgl: Nominal.
On 2nd thought – that incredible disparity would persist even if these series were report in real dollars.
This is why we need things like Social Security and Federally paid health care. But of course Mitch McConnell likely wants to pay for infrastructure investment by scrapping both programs. After all – he cannot bring himself to tax the Hampton crowd.
I know some statistics is complicated, hence my now years long dream of one day mastering the program of “R”, along with a review of some stats. But I often think the hard part of statistics may not be the computing of the numbers, but rather, the “compiling” and “collection of” the numbers.
That’s all today from Captain Obvious, Signing off from duty.
Census data on real household income by quintile is available in a user friendly format at https://www.advisorperspectives.com/dshort/updates/2020/09/17/updated-u-s-household-incomes-a-50-year-perspective
Many apparently scoff at the need for more up to date data. Well, here’s a practical application: many liberals are still scratching their heads at how a racist, misogynist boor like Trump could possibly have garnered 74 million votes. I mean, how could Hispanics in the Rio Grande valley have possibly ditched the Democrats?
The data suggests an answer–like Trump said, more people were better off than ever before. For most of the Obama years real incomes of the lower quintiles had stagnated below their levels of 2000, 2007 and even 1989. And Democrats seemed to think that that was no problem. But after Trump took office, and particularly by 2019 real incomes were higher than ever before. Those who were swayed mostly by their prosperity presumably expected that Trump could deliver again after the pandemic ended.
Had liberals had access to monthly reports of rising prosperity under Trump, they could easily have seen early on that some Trump supporters had rational reasons for voting for the guy. Perhaps such information could have tempered liberals’ disdain for anyone who voted for him and led to some constructive dialogue.
Personally I voted third party, as usual. It didn’t affect the outcome, but it did register my protest. Had I had any inkling that Biden would be a pleasant surprise, I would have considered voting for him. Fortunately, Biden seems to have come to the conclusion that winning means catering to more than just the affluent and the wealthy.
“This month, the Census Bureau released its annual report on household income data for 2019.”
So they are only repeating the information from the hard working people at Census who you accused of not caring about this issue. Of course you do have this pathetic habit of making such bogus accusations with respect to the people who do the hard work.
‘Had liberals had access to monthly reports of rising prosperity under Trump, they could easily have seen early on that some Trump supporters had rational reasons for voting for the guy.’
Had I had a crystal ball, I could have predicted who won the Kentucky Derby. No one produces monthly data in this issue and if you do not get this by now – you are beyond clueless. Which I guess explains that really dumb statement about support for Trump. Like TCJA was a progressive tax cut. DUH!
Too bad their graph is not segmented out so we can see that the real income of the lower quartile rose each year from 2011 to 2019. I seem to recall in your first (really dumb) comment on this topic that you said any gain would be some sort of blip. Yea – a decade long blip. JohnH – wrong as usual on just about everything.
So, Obama was inaugurated during the worst recession in 7 decades, he undertook a massive fiscal stimulus without a single Republican vote in Congress, and “liberals” are to blame for weak wage growth? Trump inherited the longest expansion in U.S. history because Obama didn’t screw it up, cut taxes when the output gap was gone to keep the party going, and that’s evidence “liberals” lack some understanding of how things work?
The problem is not that your political views cloud your understanding of economics. Your views cloud your understanding of economics, history, politics and whatever else was in that stuff you wrote.
Before putting fingers to keyboard, get a grip on your biases.
Careful there – JohnH has now resorted to sheer lying along with this pathetic parade of putting people who get this down as not caring about poor people. But of course he used to do this garbage over at Thoma’s place so why not here.
https://www.taxpolicycenter.org/statistics/household-income-quintiles
JohnH May 2, 2021 at 8:44 pm
JohnH puts up a hard to read chart which he calls a user friendly format. I guess this is why he wrote this confused nonsense:
‘The data suggests an answer–like Trump said, more people were better off than ever before. For most of the Obama years real incomes of the lower quintiles had stagnated below their levels of 2000, 2007 and even 1989. And Democrats seemed to think that that was no problem. But after Trump took office, and particularly by 2019 real incomes were higher than ever before.’
Tax Policy Center presents the Census data so we can actually read it. It is true that the mean income for the lower quintile was low. After 8 years of Bush43 and the Great Recession, this was not exactly a surprise. And yes income in 2019 was higher for the lower quintile was higher but maybe JohnH aka Mr. Magoo never realized that this income rose each year from 2011 onwards.
Or maybe he is not as stupid as I have been accusing him of. After all – he totally lacks any integrity.
There happens to be one useful graph in your little source further down following this paragraph, which I just noticed and if you had an ounce of integrity (which you don’t) you would too:
‘To give us a better idea of the underlying trends in household incomes, we’ve also prepared a chart of the real percentage growth since 1967. Note in particular the growing spread between the top quintile (and especially the top 5%) and the other four quintiles. The growth spread began in the mid-1980s during the Reagan administration, the era of Supply Side Economics (aka “Reaganomics” and Trickle-Down Economics). As this chart illustrates, tax and other policy changes to benefit the wealthier households didn’t have the heavily promoted trickle-down effect. We’ve also highlighted recessions to show the correlation of household incomes to the business cycle.’
The graph does show that real income for the lower quintile took a hit after the Great Recession. Go figure. But after that hit real incomes started rising under Obama – the horrific jerk of a President according to Holier than Thou JohnH. Yea the Obama boom continued even after Trump took office. Of course the tax and policy changes from TCJA in 2017 was not exactly the progressive agenda you think Trump has been putting in effect. DUH!
There is also that conservative canard about how the disparity in consumption equality is not as great as the measured income inequality. While they note the Friedman permanent income hypothesis as the sole explanation, they are missing the implications that the rich get to save a lot more of their income than the poor. Which of course shows up in how incredibly unequal net worth is.
At the Berkshire Hathaway annual meeting this past weekend, vice Chairman Charlie Munger noted that Bernie Sanders has won the argument about income inequality. This graph shows why.
This was noted earlier. My snarky retort was something along these lines – Bernie has not won until we report income distribution on a weekly basis. Yea – stupid but that was the theme of JohnH’s first comment.
You know I really hate to play the role of peacemaker, especially when I’m sober and not slush drunk ‘cuz it’s less nauseating portraying peacemaker when I’m slush drunk. But…… maybe JohnH is putting the bulk of his complaint with the general media’s treatment of income distribution and not economists’ treatment of it. And I think he can at least be semi-forgiven if it doesn’t register with him how hard the data is to compile.
I’m wondering if a mixture of proxies could be used to obtain a rough but more current data estimate. I think it’s a worthy endeavor.
Shame on you, Moses! Did you not just enunciate clearly that interfering in this discussion initiated by pgl and JohnH indicates one is suffering from hypersensitive narcissism? And we know that you never exhibit anything like that. Tsk tsk.
As it is, it is not obvious that generating either monthly or quarterly data on this would make any difference regarding the politics of this, especially given that the so-called data would be some sort of artificially modeled unreliable bilge. In fact the annual series do show the trends. It is a matter of people paying attention to those trends and acting on them or not.
“maybe JohnH is putting the bulk of his complaint with the general media’s treatment of income distribution and not economists’ treatment of it.”
So when he bashes Paul Krugman with his usual dishonest drivel, Krugman is a reporter not an economist? No Moses – he was bashes the folks at Census. Who knew they are all reporters!
“maybe JohnH is putting the bulk of his complaint with the general media’s treatment of income distribution and not economists’ treatment of it.”
We have winner for the dumbest comment of the week. Unless the hard working people at Census are nothing but reporters, if the only role Krugman has at the NYTimes is journalist, Uncle Moses missed the entire boat.
I’m counting on the NYC man, pgl, who told us that Governor Andrew Cuomo was “the leader” on Covid-19 policy and the betrothed molester and abuser of women was a great candidate for U.S. President to set me straight on all the facts.
https://www.deseret.com/u-s-world/2021/3/30/22358188/new-york-governor-andrew-cuomo-sexual-harassment-allegation-2017
https://www.politico.com/states/new-york/albany/story/2021/03/29/woman-accuses-cuomo-of-kissing-her-against-her-wishes-in-2017-1370327
I appreciate you informing me the Census Bureau is not part of the fourth estate. You are a fountain of knowledge everyone on this blog appreciates. Certainly with contributions like that, not one who makes pointless comments. Good luck with PR duties on Cuomo’s re-election campaign. Try some of these photos with Sandra Lee on some Brooklyn area billboards and let us all know how it goes.
https://www.dailymail.co.uk/news/article-9326655/Andrew-Cuomo-used-Catholic-faith-avoid-marrying-long-term-girlfriend-Sandra-Lee.html
Maybe a short video on local TV with Sandra telling people how it feels to have your 13+ years boyfriend groping women while you’re picking out engagement rings could add a “personal touch” to make him more relatable to Sophia Loren fans.
What implication did Munger draw from Bernie’s victory?
I think it went something like “Poor me, I may have to pay the same tax rate working Americans have had to pay for the last 40 years. Don’t you people know I’m special??”
That’s a paraphrase of something I never heard, but I have the distinct idea it went down like that.
https://fred.stlouisfed.org/graph/?g=DCEF
January 30, 2018
Share of Total Net Worth Held by Top 1%, Top 90 to 99% and Top 50 to 90%, 2000-2020
https://fred.stlouisfed.org/graph/?g=DCDl
January 30, 2018
Share of Total Net Worth Held by Top 1%, Top 90 to 99% and Top 50 to 90%, 1990-2020
Note: the top reference link is fine but the bottom link is faulty and being worked on.
The reference links to the net worth share graphs are correct, however FRED is having trouble with them.
As bad as that graph is, the reality is even worse. The chart’s vertical axis cuts off at zero, but the net worth of the bottom 10 percent of households is actually negative.
https://apps.urban.org/features/wealth-inequality-charts/
Thanks for this. The Urban Institute certainly does yeoman work on these issues – even if JohnH thinks they do not care since they do not report income statistics more than annually.
That one doesn’t surprise me at all. Ever count the number of payday loan outfits in some neighborhoods??~~along with “services” and apps which will allow people the collect their check early if they pay a fee or interest on the payment.
When I was learning to drive semi and in my first few weeks of driving, the company I worked for regularly, no near obsessively, told drivers (because they knew many were in bad straights starting out and were near financially illiterate) they could get “advances” on their salaries. They never called these short-term small loans, which is what they indeed were. “Collateralized” by their own salary, which they had in essence already earned. If you looked at the small amount the drivers were getting, in the advances vs the fee or rate, if you worked it out on an annual basis the interest rate was monstrously high, I would say it was a usury rate. But the semi companies always acted like they were doing drivers a big favor. Most of those semi-drivers were working class, “salt of the Earth” type people who’d give you the shirt off their backs if you needed it. They just were dumb as hell on money issues. And the semi companies knew that. I have no doubt they do those same things to this very day, only it’s probably even more digitized now, and easier than it was in my day to click something on your phone with your thumb to get the debt—to pay interest on your own damned salary.
Maybe I should just delete LinkedIn from my computer and pollyanna free trade is grand babble keeps popping up such as their rah rah – the pharma multinationals saved our lives:
https://eworld.substack.com/p/globalization-in-a-needle?r=16uqn&utm_campaign=post&utm_medium=web&utm_source=twitter
No mention of mega profits accruing to tax havens. Or the distribution consequences of free trade – not from a bunch of right wingers on LinkedIn. I grew tried of reading it so feel free to take whatever shot at this cheerleader you wish.
Luxembourg Income Study https://www.lisdatacenter.org/ offers the most comprehensive and immediate information on income distribution internationally.
ltr,
The LIS is certainly one of the best comprehensive sources on income distribution around the world. Probably its only rival is OECD, except that the OECD only has data for its member nations, where the quality of data is much better than in most of the rest of the world.
A major longtime figure associated with the LIS is Tim Smeeding, a colleague of Menzie’s at the LaFollette School at UW-Madison who retired not too long ago but is still professionally active, one of the world’s leading experts on income distribution. To JohnH, Tim served as Director of the UW’s Center for Research on Poverty for quite a few years.
Interesting data. I think Paul Krugman has been citing this data ever since he started at CUNY.
So this is Apple’s game?
https://www.washingtonpost.com/technology/2021/04/30/epic-apple-trial-antitrust-fortnite-app-store/
Not only do you pay a fortune with your iPhone, if you use a 3rd party app, the 3rd party has to pay Apple 30% of the revenue received by the 3rd party. One 3rd party is taking Apple to court for its anti-competitive highway robbery.
The fact that this is even being discussed, tells you all you need to know about both the CEO of Facebook, and the platform itself. I dead stop gutter for sewage, that makes Reddit look hygienic by comparison:
https://www.nytimes.com/2021/05/03/technology/facebook-trump-ban.html
He already has an open mic down at Maro Lago with a band to back up his parade of lies. I’m all for the First Amendment but in the case of traitor wannabe dictators, his right to free speech should be curtailed.
From about 2000 to 2003, the 1% gained (actually lost) at a different rate than the top 10%. what caused this? the dot-com crash? were the extremely wealthy that impacted by stock (or ownership fo the firms?). or was it a policy change? after 2003, it appears both groups grow with a similar slope.
Will we ever get a mea culpa on the stupidity of your soybean posts? I doubt it
AgTrader: Sorry, stupidity of which soybean posts? The ones where I noted the accuracy/unbiasedness of futures contracts, the ones where I noted the decline in soybean prices in the wake of the trade war, the ones where I noted the dependence of soybean (and other ag commodity prices) on the dollar’s value?
I think he’s referring to how you didn’t filter CoRev’s and Ed Hanson’s comments. (joke, sorry, sometimes I can’t resist the low-lying fruit)
Is this a new name for CoRev – or just his Minnie Me?
https://fred.stlouisfed.org/graph/?g=ohWv
January 30, 2018
Producer Prices for Soybeans, 2017-2021
(Percent change)
https://fred.stlouisfed.org/graph/?g=pJvj
January 30, 2018
Producer Prices for Soybeans and Corn, 2017-2021
(Percent change)
https://fred.stlouisfed.org/graph/?g=DE9I
January 30, 2018
Producer Prices for Soybeans and Trade Weighted Price of Dollar for advanced economies, 2017-2021
(Percent change)
I noted the dependence of soybean (and other ag commodity prices) on the dollar’s value…
Menzie Chinn
[ About 35% of American agricultural production is exported, a significantly portion than in 2000. ]
About 35% of American agricultural production is exported, a significantly higher portion than in 2000:
https://fred.stlouisfed.org/graph/?g=DEFv
January 30, 2018
Exports of Agricultural Goods / Farm Output, 2000-2019
https://fred.stlouisfed.org/graph/?g=DCDl
January 30, 2018
Share of Total Net Worth Held by Top 1%, Top 90 to 99% and Top 50 to 90%, 1990-2020
https://fred.stlouisfed.org/graph/?g=DDi5
January 30, 2018
Share of Total Net Worth Held by Top 1%, Top 90 to 99% and Top 50 to 90%, 1990-2020
(Indexed to 1990)
https://fred.stlouisfed.org/graph/?g=DCEF
January 30, 2018
Share of Total Net Worth Held by Top 1%, Top 90 to 99% and Top 50 to 90%, 2000-2020
https://fred.stlouisfed.org/graph/?g=DDib
January 30, 2018
Share of Total Net Worth Held by Top 1%, Top 90 to 99% and Top 50 to 90%, 2000-2020
(Indexed to 2000)
So here’s a question for Menzie or Jim or anyone else interested in the topic: What is the systemic risk of cryptocurrencies? I remember reading about CLOs and CMOs and SPACs in 2007 and having no idea what they were, and poof, they took down the financial system in 2008. Do cryptocurrencies represent an analogous risk, or are they simply unimportant?
Steven,
Absolutely unknowable in any seriously scientific way. Of course lots o people will be willing to make authoritative statements based on something or other. If you wish to believe any of them, well, get some darts.
Steven Kopits It would be more on topic if you inquired about the extent to which highly illiquid cryptocurrencies represent real wealth.
There’s an oil industry “consultant” in New Jersey who claims he doesn’t know the oil industry gets hundreds of billions in government subsidies (sometimes called social welfare or income redistribution). I’d check with him and see what he says about it. You’ll see him with the red colored dunce cap on OANN saying that tomato and citrus fruit pickers are raping white women all along the rural American countryside. He also says the price at the U.S. gas station pump will soon be $4 a gallon….. so keep an eye out for that.
“I remember reading about CLOs and CMOs and SPACs in 2007 and having no idea what they were”
Back in 2007 I was reviewing certain materials from New Century and Country Wide when it hit me that their entire business models were Ponzi schemes about to take down housing finance big time. They had smart people – sort of like the sophisticated crooks at Enron.
i do not think spac’s were part of the problem in 2008.
the tools you are referencing in 2007 were derivative products. this means they are probably leveraged and artificial in nature. unless cryptos and spac’s (in 2021) have similar characteristics, then i don’t think they will have the same outsized influence. cdo’s and other similar instruments had notional values in the trillions due to their leverage, and this is what brought the financial system to its knees when it crashed. i don’t see that with crypto or spacs at this point.
interestingly, i just bought my first crypto recently through coinbase. not a large investment, but enough to make myself a little educated. i went with ethereum rather than bitcoin, mostly because its blockchain technology has some valuable uses. may buy bitcoin in the future though. can’s say i am sold on crypto yet. it has made me money, though, as i bought square a couple years ago as a proxy for bitcoin (its cash app allows you to buy bitcoin). should have bought Bitcoin directly, but good trade nevertheless. millennials and younger seem to have more faith in crypto than gold. long term security of the crypto seems to be a concern of mine.
Use as collateral, or any use in capital structure in the financial sector, is a critical element in creating one kind of systemic risk. Not sure, but my impressionis that crypto-currenxies do not have a large role in the capital structure of systemically important financial firms. If that’s right, then at least one form of systemic risk from crypto$ is small.
Priblem is, we may not be so good at identifying novel forms of systemic risk. Financial innovationtend to lead to financial crisis – part of the learning process. We learn to fence in risk after risk manifests.
Remember, something as simple as bank savings accounts have been transmitters of systemic risks. Crypt$ accountsare similar to uninsured savings accounts. There is a fire-break between crypto$ accounts and insured accounts, which is a comfort.
coinbase seem to have some ability to buy on margin. have not investigated it thoroughly, but my initial thought is this COULD be problematic. not sure how easy it is to access that margin account.
https://jabberwocking.com/the-great-reopening-will-generate-a-million-identical-stories/
Kevin Drum listens to 60 Minutes so Bruce Hall does not have to:
Anyway, we’re now being deluged with stories along this line. Last night, for example, 60 Minutes ran a segment about the shortage of chips for cars and videogames and whatnot. And why is there a shortage of chips? Is it because we’ve outsourced everything to the wily Chinese folks on Taiwan? You’d think so after inhaling Lesley Stahl’s inane reporting, except for the fact that she inadvertently allowed the chairman of Taiwanese chipmaker TSMC a brief moment to give the game away: “In March, 2020, as COVID paralyzed the U.S., car sales tumbled, leading automakers to cancel their chip orders. So TSMC stopped making them.” Oh. So it has nothing to do with Taiwanese fabs vs. American fabs or global supply constraints or any of that. Nor is it related to a possible invasion of Taiwan or the fact that Intel may or may not have made good decisions about its future business. It’s because American car companies canceled their chip orders and never bothered to reinstate them. Then in December, when car sales “unexpectedly” began to rebound, they panicked and realized what they had done. You’d think these guys had never done an economic forecast or used an MRP system before in their lives.
This was only a portion of Kevin’s tirade over stupid reporters. I watched the same episode and yea it was kind of dumb. But in fairness to Lesley Stahl – her reporting was a LOT more insightful when compared to Bruce Hall’s dumb rants on this topic.
A different topic but what Peter Orszag has to say about the Biden infrastructure proposal is a must read:
https://www.bloomberg.com/opinion/articles/2021-05-04/america-s-bridges-need-greater-investment-to-survive
Orszag calls out the “new pundit” view that our bridges and roads are not the bad. It is interesting I found this over at Kevin Drum’s place since Kevin is a leading figure in this new pundit camp.
i have seen this minimization technique in action on this blog. at one point, when it worked in his favor, steven kopits argued how our infrastructure was falling apart. but the very next day, he challenged that notion when it was also a convenient argument, saying our infrastructure is fine and we are overspending on it. you cannot have it both ways.
the fact is, our infrastructure is falling behind every day, and a lack of investment will result in a tsunami of issues as time goes on. we have an enormous amount of infrastructure, especially bridges, that are 50 to 75 years old. not only are they structurally deficient, they are operationally deficient as well. many of your time consuming traffic jams occur at highway interchanges that have too few lanes to handle the mixing of traffic. often times, those lane limitations are a result of bridges that cannot be widened. this is just one example of how our infrastructure is falling behind in both safety and performance.
biden is right to expand the notion of what infrastructure is. we cannot keep living in a world defined by the 1950’s. what constitutes infrastructure-the basics required for the performance of the society desired-has expanded to include energy and information. investing in our infrastructure is an investment in America’s future. those fighting are simply weakening our future.
Switzerland is angry at President Biden for saying they are a tax haven just like the Caymans and Bermuda:
https://www.swissinfo.ch/eng/diplomacy_switzerland-diplomatically-rejects-biden-s–fiscal-paradise–label-/46578996
Switzerland may be a nice place to ski but they need to get over it – the nation is a tax haven. Just without the really nice beaches.
“Barkley Rosser May 4, 2021 at 6:42 pm
JohnH,
Sorry, but I just did what Menzie recommends and used Google to see if I could find any income distribution data estimared quarterly or more frequently in Australia. Maybe somebody is working on doing that down under there (maybe Not Trampis knows)”
Barkley is responding to some long winded whiny BS from JohnH. It is funny that JohnH under another thread told us the Aussies only do this every 3 years. Of course he is wrong about that too. Since Joseph Stiglitz et al. recommended reporting income by quintiles back in 2009, the Aussies are doing this on an annual basis.
Not monthly? Is JohnH now telling us that Stiglitz does not care about income distribution???