The forecasted price level (CPI) has been moved up, as near term expected inflation has increased. Near term GDP growth forecasts upwardly revised, but downside risks remain. Projected output gap small positive at year’s end.
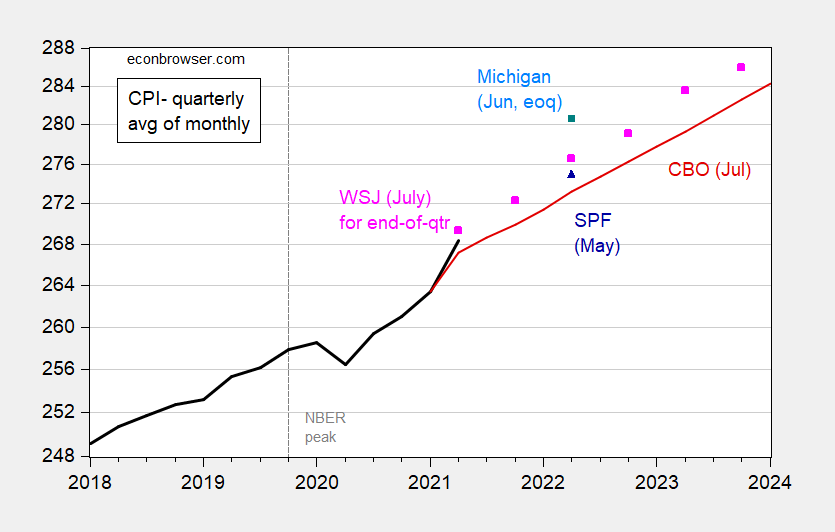
Figure 1: CPI – all urban, quarterly average of monthly data (black bold), CBO projection (red), WSJ July survey mean for end-of-quarter (pink), Michigan survey of consumers for end-of-quarter (blue square), Survey of Professional Forecasters median (blue triangle). Q2 CPI actual and Michigan survey implied level for June 2022 uses Bloomberg consensus for June 2021 CPI as of 7/12. NBER peak at dashed line. Source: BLS via FRED, WSJ July survey, Michigan survey of consumers, SPF/Philadelphia Fed, Bloomberg as of 7/12, and author’s calculations.
Note the actual CPI data and the CBO and SPF forecast are for quarter averages of monthly data, while the Michigan and Wall Street Journal forecasts are for end-of-quarter.
Showing these in comparable time series:

Figure 2: CPI – all urban, end-of-quarter monthly data (black bold), CBO projection for quarterly average of monthly data (red), WSJ July survey mean for end-of-quarter (pink square), Michigan survey of consumers for end-of-quarter (blue triangle), Brian Wesbury, Robert Stein/First Trust Advisors (green +), Bill Diviney/ABN Amro (blue +). June CPI actual and Michigan survey implied level for June 2022 uses Bloomberg consensus for June 2021 CPI as of 7/12. NBER peak at dashed line. Source: BLS via FRED, WSJ July survey, Michigan survey of consumers, Bloomberg as of 7/12, and author’s calculations.
The forecasts imply a deceleration in inflation (the index is on a log scale, so a flattening of the slope implies a slowing of growth rate). There is a considerable spread in the expectations of price increase. At the 90% lower bound (for inflation over the next year) is Diviney/ABN Amro, while Wesbury and Stein at First Trust is at the top.
The Wall Street Journal article stresses the jump up in inflation expectations:
Americans should brace themselves for several years of higher inflation than they’ve seen in decades, according to economists who expect the robust post-pandemic economic recovery to fuel brisk price increases for a while.
Economists surveyed this month by The Wall Street Journal raised their forecasts of how high inflation would go and for how long, compared with their previous expectations in April.
Notice that the Michigan y/y inflation estimate (4% for June) implies a CPI level above the 90% upper bound for CPI from the professional forecasters.
On GDP, the forecast for Q1 GDP growth has been moved up again relative to April (the WSJ moved to quarterly surveys from monthly). The July, April, January and October 2020 forecasts for Q1 were 9.11%, 8.15%, 4.91%, and 3.72% (SAAR), respectively.

Figure 3: GDP as reported (bold black), WSJ October 2020 survey (light green), January 2021 survey (red), April survey (dark blue), July survey (green), all in billions Ch.2012$ SAAR. Source: BEA, 2021Q1 3rd release, WSJ survey of economists, various issues, and author’s calculations.
There’s a fairly wide dispersion of forecasts, particularly on the downside. That is, most respondents agree on rapid growth in the next quarter (Q2) and in the near future, but there’s a view that downside risks to growth remain.
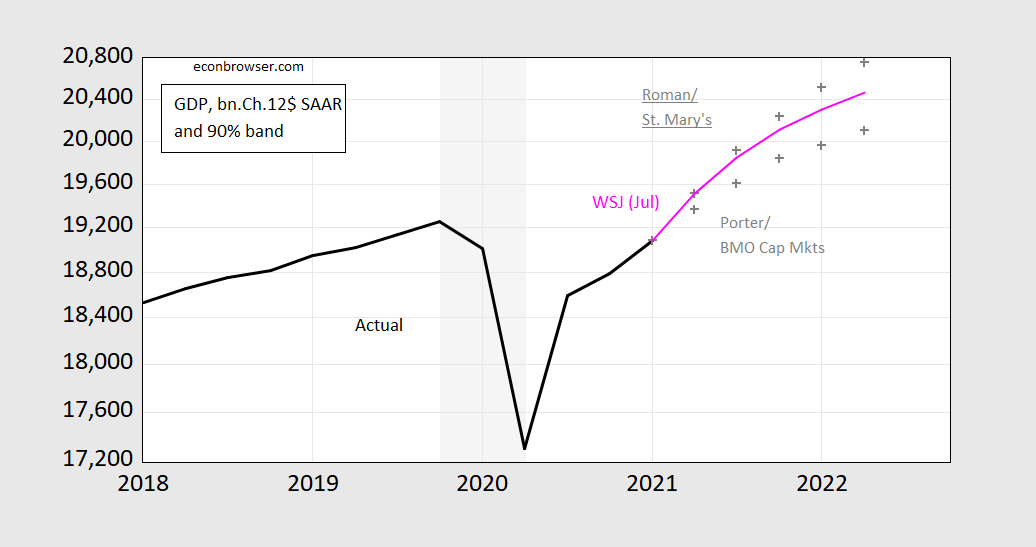
Figure 4: GDP as reported (bold black), July survey (pink), Belinda Roman (gray +), Doug Porter (gray +), at 90% band, all in billions Ch.2012$ SAAR. Source: BEA, 2021Q1 3rd release, WSJ survey of economists, July 2021, and author’s calculations.
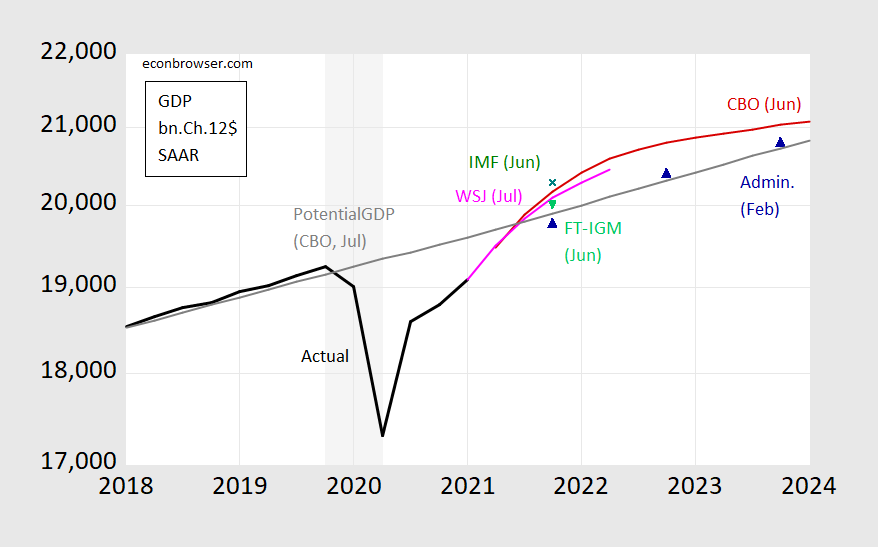
Figure 5: GDP as reported (bold black), WSJ July survey (pink), CBO (red), Administration (blue triangle), IMF Article IV for US (green +), FT-IGM survey (light green triangle), all in billions Ch.2012$ SAAR. Source: BEA, 2021Q1 3rd release, WSJ survey of economists, July 2021, IMF, FT-IGM June survey, and author’s calculations.
All of the forecasts save the Administration’s imply a small positive output gap (using the CBO estimate of potential) by year’s end.
I see these numbers as slightly optimistic because of the Delta variant in low percentage vaccination states. But nothing here to get super worked up about. Obviously see the inflation numbers as lower as well. What, one of the core inflation numbers now is 3.8% inflation (specifically for the month of May)?? I didn’t see it going any higher than 3.5%, so I suppose I’m already wrong on that score. I suppose I could hold out that it will be lower on an annual basis by the end of the year?? But I’m willing to wave the white flag on inflation (at least the short term number) and say I was wrong.
https://cepr.net/news-for-washington-post-people-dont-see-economic-growth-they-read-about-it-in-the-news/
July 12, 2021
News for Washington Post: People Don’t See Economic Growth, they Read About it in the News
By Dean Baker
The Washington Post gave readers * the dire warning that the rapid growth this year, and projected growth for next year, is likely to lead to slower growth in 2023. It then tells readers:
“But there’s a catch. Americans don’t typically look at the level of GDP. They look at the change; they compare things to the previous quarter, not the previous decade, or to a counterfactual scenario in which no stimulus packages were passed. And it’s likely that, because the boom of 2021 and 2022 helped GDP reach its potential more rapidly, the rate of growth in 2023 will be slower than it would have been without stimulus.”
Actually, in their direct daily experience, people have no ability to assess GDP growth. They know if they and their family and friends have jobs. They know if they feel secure in those jobs and are getting decent pay raises. On these issues, the projections provide little basis for concern. The Congressional Budget Office projects that unemployment will average 3.7 percent in 2023, the same as the 2019 average and lower than any other year since 1969.
If the unemployment rate is in fact this low, it is likely that workers will feel relatively secure in their jobs and be in a position to demand reasonable pay increases. If the economy is in fact growing slowly in 2023, as currently projected, people will only be aware of this fact because news outlets and politicians choose to highlight it.
* https://www.washingtonpost.com/business/2021/07/12/coronavirus-spending-economy/
Its probably even simpler than that. People who for whatever reason want to believe that Biden is failing will find some number somewhere that can make this point. They will find plenty of dishonest news outlets that can come up with or make up numbers that support said narrative. Those who don’t want to think that Biden has failed will find numbers supporting that he (the economy) did well. A small number of people will have the knowledge, expertise and integrity to cut through the BS and figure out where we are and where we likely are heading. Those would be people like Baker, Krugman and our host. Unfortunately they have fairly small audiences so the real world will not have a lot of influence on what people think is going on.
https://fred.stlouisfed.org/graph/?g=sVz7
January 15, 2020
Consumer Price Index and Consumer Price Index Less Food & Energy, 2020-2021
(Percent change)
https://fred.stlouisfed.org/graph/?g=FmWS
January 15, 2020
Consumer Price Index for Food and Energy, 2020-2021
(Percent change)
https://fred.stlouisfed.org/graph/?g=Fn2B
January 15, 2020
Consumer Price Index Rent and Owners’ Equivalent Rent, 2020
(Percent change)
https://fred.stlouisfed.org/graph/?g=ECQX
January 15, 2020
Consumer Price Indexes for New and Used cars & trucks, 2020-2021
(Percent change)
https://fred.stlouisfed.org/graph/?g=CgJo
January 15, 2020
Sticky Consumer Price Index and Sticky Consumer Price Index less Shelter, 2020-2021
(Percent change)
Kevin Drum has not just one but 3 recent posts on inflation. This one notes that if you decide to load up the diet on good old hamburgers, hot dogs, and potatoes, then prices are falling!
https://jabberwocking.com/the-price-of-hamburger-is-down-8-4/
OK – not the diet of sushi loving liberals but the MAGA crowd should be elated!
Sticky prices CPI cooled in June back into a normal pace of rise, up 2.7% y/y. That’s moderate inflation. as recently as February, the sticky CPI was up just 1.7%, core just 1.5%.
Flexible prices CPI accelerated further and core flexible prices CPI rose at a 70% annualized pace in June; Eeeehaw! Used car prices rose 10.5% m/m, which is a roughly 330% annualized pace of rise.
We aren’t seeing a sustained rapid rise in the general level of prices. Just a crazy rise in a few prices and pretty tame general price rise.
A lot of poor people got stimulus checks – and used it to get reliable transportation (better used cars). People stuck in low paying jobs got substantial freedom with stimulus and increased unemployment support – and used it to pursue training and move into jobs with better future prospects (forcing dead end sectors to increase pay and prices). Seem pretty good to me.
https://news.cgtn.com/news/2021-07-13/China-s-foreign-trade-up-27-1-in-H1-of-2021-11RaaXjLaRG/index.html
July 13, 2021
China’s export growth beats forecast, up 32.2% in June
China’s exports in dollar terms grew by 32.2 percent in June from a year earlier, at a much faster-than-expected pace, as easing lockdown measures and global vaccination progress drove demand, data from the General Administration of Customs (GAC) showed on Tuesday.
The export growth in June was above the predictions of 23.1 percent by Reuters and 22.9 percent by Bloomberg. It was up from the year-on-year growth of 27.9 percent in May.
https://news.cgtn.com/news/2021-07-13/China-s-foreign-trade-up-27-1-in-H1-of-2021-11RaaXjLaRG/img/54a9125d6c6941bfbca5d55087e99c19/54a9125d6c6941bfbca5d55087e99c19.jpeg
The country’s import growth in dollar terms also beat expectations of 30 percent by Reuters and 29.3 percent by Bloomberg, and increased by 36.7 percent in June from a year ago. But the pace eased from May’s 51.1-percent gain, which was the fastest growth since January 2011.
https://news.cgtn.com/news/2021-07-13/China-s-foreign-trade-up-27-1-in-H1-of-2021-11RaaXjLaRG/img/7a13e25369134be1801e8c7e49fffd08/7a13e25369134be1801e8c7e49fffd08.jpeg
This was the 12th consecutive month of export growth and the ninth consecutive month of import growth. Exports grew to $281.42 billion in June, while imports rose to $229.89 billion.
In the first half of this year, the country’s exports went up by 38.6 percent from a year ago to $1.52 trillion, while imports increased by 36 percent over the same period to $1.27 trillion….
http://www.xinhuanet.com/english/2021-07/13/c_1310058561.htm
July 13, 2021
Over 1.39 bln doses of COVID-19 vaccines administered in China
BEIJING — More than 1.39 billion doses of COVID-19 vaccines had been administered in China as of Monday, the National Health Commission announced on Tuesday.
[ Along with the more than 1.39 billion doses of Chinese vaccines administered domestically, more than 500 million doses have been distributed internationally. ]
distributed internationally, including to Indonesia, where evidence is mounting that the Chinese vaccine is far less effective than those developed elsewhere.
Man, oh man, I missed all those old “Russian invention” jokes. Western comedians putting on bad Russian accents to brag about great Russian inventions like lightbulb, television, srf board Moscow Mule. All to mock propaganda about “brilliant Russian science”. Now, thank goodness, they’re back, recycled into jokes about “brilliant Chinese science”. Authoritarians are a hoot. Thank you, ltr, for your diligence on behalf of state-sponsored slap-stick.
@ macroduck
Don’t get me started. I have a difficult time separating my internal bitterness about certain things, and some ludicrous claims mainland Chinese make about “native to China inventions” and I can’t decipher which part is accurate commentary and which is just me being “legacy pissed off”. Make sense?? Nevermind.